


An Orifice Cavitation CFD simulation is very important for machines that handle liquids. An orifice plate is like a wall with a hole in it. We use these plates in pipes to control how much liquid flows or to drop the pressure. Think of it like putting your thumb over a garden hose – the water comes out faster. However, when liquid flows very fast through this small hole, a strange problem can happen: cavitation.
Cavitation happens when the pressure of the liquid drops too low, even lower than the pressure at which the liquid turns into vapor (like boiling water). When this happens, tiny vapor bubbles suddenly form in the liquid. This is shown in Figure 1. These bubbles then travel a short distance, and when the pressure goes up again, they suddenly burst or “collapse.” This bubble collapse is very powerful. It creates tiny, strong shock waves that hit the metal parts of the pipe and the orifice plate. Over time, these tiny impacts can cause serious damage, like holes in the metal (erosion). Cavitation also makes a lot of noise and can cause pipes to shake. This report shows how we use ANSYS Fluent to study Cavitation In Orifice Plate Fluent. Our goal is to see exactly where these damaging bubbles form and where they burst, so engineers can design better systems that avoid this problem. This study is based on a real engineering paper [1].
- Reference [1]: Wanzheng, Ai. “Energy dissipation characteristics of sharp-edged orifice plate.” Advances in Mechanical Engineering8 (2015): 1687814015595571.
Figure 1- A diagram illustrating Cavitation in an Orifice Plate, showing the formation and collapse of vapor bubbles.
Simulation Process for Orifice Cavitation CFD
To study the Cavitation In Orifice Plate CFD problem, we created a computer model of the orifice plate and the pipe around it. Because the orifice plate is round and even on all sides, we could use a special way to save computer time. We used the Axisymmetric method. This means we only needed to model a small slice of the pipe, which makes the simulation much faster without losing accuracy. We also used a neat and organized grid of cells, called a structured grid, to get very good results.
To see the vapor bubbles form, we used the Mixture multiphase model in ANSYS Fluent. “Multiphase” means it can handle more than one type of material at the same time, here it is liquid and vapor. For the liquid to change into vapor and back again, we used a special method called the Mass Transfer mechanism. This method uses the Schnerr-Sauer submodel to correctly calculate when vapor bubbles appear and disappear based on the local pressure. This setup helps us understand the Orifice Cavitation CFD process in detail.
Post-processing: Understanding How Bubbles Form and Cause Damage
The simulation results give us a very clear story of cause and effect, showing exactly how cavitation happens and where it causes problems. The main cause is the small hole (orifice) itself. When the liquid tries to squeeze through this small hole, its direct effect is to speed up very, very fast. The velocity contour in Figure 2 is the perfect proof. We see that the liquid speed is low (blue, around 3-5 m/s) before the orifice. Then, as it goes through the tiny hole, it jumps to very high speeds (red, around 30-35 m/s). This fast-moving stream of liquid is called a “jet.” This super-fast jet is the cause of the second, very important effect: the pressure drops very low right after the orifice. Think of it like air rushing out of a vacuum cleaner hose – the pressure outside the hose is much lower. Because the pressure drops so low, it falls below the liquid’s vapor pressure. This causes the liquid to suddenly turn into vapor, forming many small bubbles. This is where Cavitation In Orifice CFD begins. The vapor volume fraction contour in Figure 3 is the best proof of this. We see a large area of red color right after the orifice, which means this area is full of vapor bubbles. As the liquid and bubbles move further down the pipe, the pipe gets wider, and the pressure starts to go back up. When the pressure rises, these vapor bubbles can no longer exist, so they suddenly burst or “collapse” back into liquid.
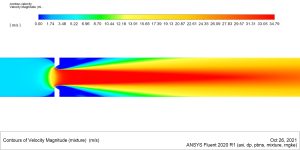
Figure 2: A velocity contour plot from the Orifice Flow Simulation, showing the high-speed jet created as fluid passes through the orifice.
The most important achievement of this Cavitation In Orifice Plate CFD simulation is that it clearly shows the exact locations where these damaging vapor bubbles form and where they collapse. Figure 3 precisely maps the vapor bubble region (red area) right after the orifice and then shows where these bubbles disappear (the transition from red/yellow back to blue). This information is crucial because the violent collapse of these bubbles (the effect) is what causes metal erosion and noise. By seeing these critical zones, engineers can design the orifice or the pipe to prevent the pressure from dropping too low, or they can use stronger materials in the high-impact areas, making the system much safer and more durable.
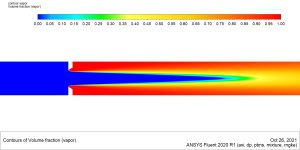
Figure 3: A vapor volume fraction contour from the Cavitation In Orifice Fluent analysis, clearly showing where cavitation bubbles form (red) and collapse in the pipe.


Reviews
There are no reviews yet.