

This parametric study tutorial shows you how to optimize performance of cross flow heat exchanger. Parametric analysis is a smart way to find the best design without wasting time and money on physical tests. Using ANSYS Fluent, this guide walks through a complete CFD simulation of a cross flow heat exchanger while changing different settings to see what works best. Optimization techniques like parametric studies help engineers discover which factors matter most for heat exchanger performance. By testing multiple design parameters in a systematic way, you can quickly find the perfect balance between heat transfer rate and pressure drop. Whether you’re fine-tuning an existing heat exchanger design or creating something new, this ANSYS Fluent tutorial makes parametric optimization easy to understand. Learn practical CFD modeling skills to run your own parametric studies and boost thermal performance without complicated math or expensive experiments.
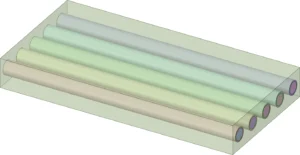
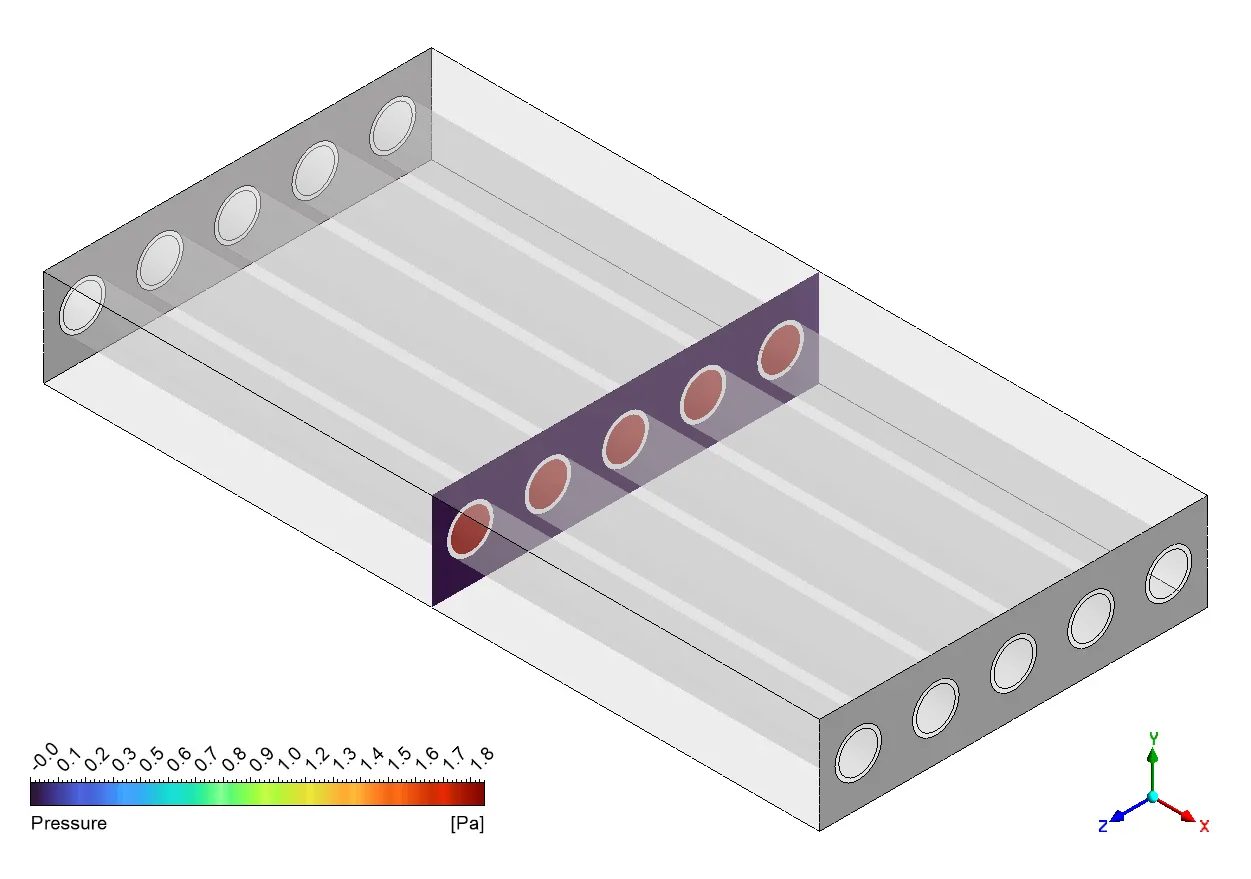
Figure 1: Geometry model established from 5 tubes in a shell considering conjugate heat transfer
Simulation process
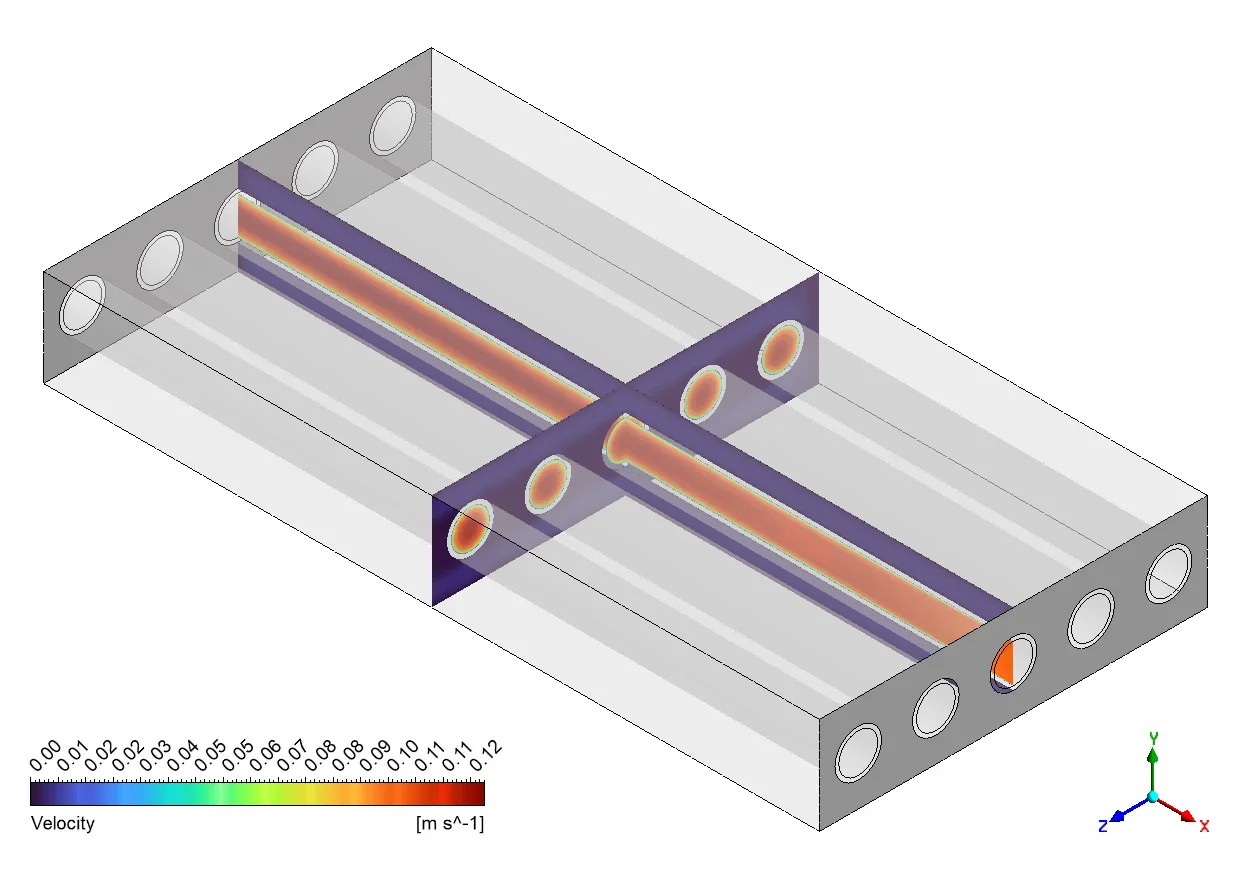
For this parametric study, we built a 3D model of a cross flow heat exchanger with five steel tubes. We made a good quality mesh using Fluent meshing to get accurate results. We set up the simulation to include conjugate heat transfer, which means heat can move between the water and the steel tubes. For our parametric analysis, we tested different settings: we changed the mass flow in the shell from 1 to 4.5 kg/s, and we also tried different water temperatures in the shell from 285K to 320K. Each time we changed a setting, we checked the temperature at both the shell outlet and tube outlet to see how well the heat exchanger was working. This way, we could find which settings give the best performance without building real prototypes.
Analysis of Results
Post-processing
Looking at the table, we can see two clear patterns in our parametric study. In the first part (DP 0-6), we kept the shell water temperature at 285K but changed the mass flow rate from 1 to 4.5 kg/s. As the flow got faster, the shell outlet temperature dropped from 288.23K to 286.62K. This makes sense – more water flowing means less time to heat up! The tube outlet temperature also dropped slightly from 344.38K to 344.25K. In the second part (DP 2, 7-12), we kept the mass flow rate steady at 2.5 kg/s but changed the shell inlet temperature from 285K to 320K. The results show that as we put warmer water in, we get warmer water out – the shell outlet temperature rose from 287.06K to 319.08K. The tube outlet temperature also went up a bit, from 344.29K to 344.68K. This parametric analysis shows us that if we want maximum cooling effect, we should use higher flow rates. But if we care about heating the shell-side fluid more efficiently (bigger temperature change), slower flow works better. These simple tests help us pick the best settings for our heat exchanger without wasting time and money on real prototypes.
Table 1: Parametric Study Results
| Design Point | Mass Flow (kg/s) | Shell Inlet Temp (K) | Shell Outlet Temp (K) | Tube Outlet Temp (K) |
| DP 0 | 1 | 285 | 288.23 | 344.38 |
| DP 1 | 2 | 285 | 287.28 | 344.31 |
| DP 2 | 2.5 | 285 | 287.06 | 344.29 |
| DP 3 | 3 | 285 | 286.91 | 344.28 |
| DP 4 | 3.5 | 285 | 286.79 | 344.27 |
| DP 5 | 4 | 285 | 286.7 | 344.26 |
| DP 6 | 4.5 | 285 | 286.62 | 344.25 |
| DP 7 | 2.5 | 295 | 296.21 | 344.4 |
| DP 8 | 2.5 | 300 | 300.78 | 344.45 |
| DP 9 | 2.5 | 305 | 305.36 | 344.51 |
| DP 10 | 2.5 | 310 | 309.93 | 344.57 |
| DP 11 | 2.5 | 315 | 314.51 | 344.63 |
| DP 12 | 2.5 | 320 | 319.08 | 344.68 |
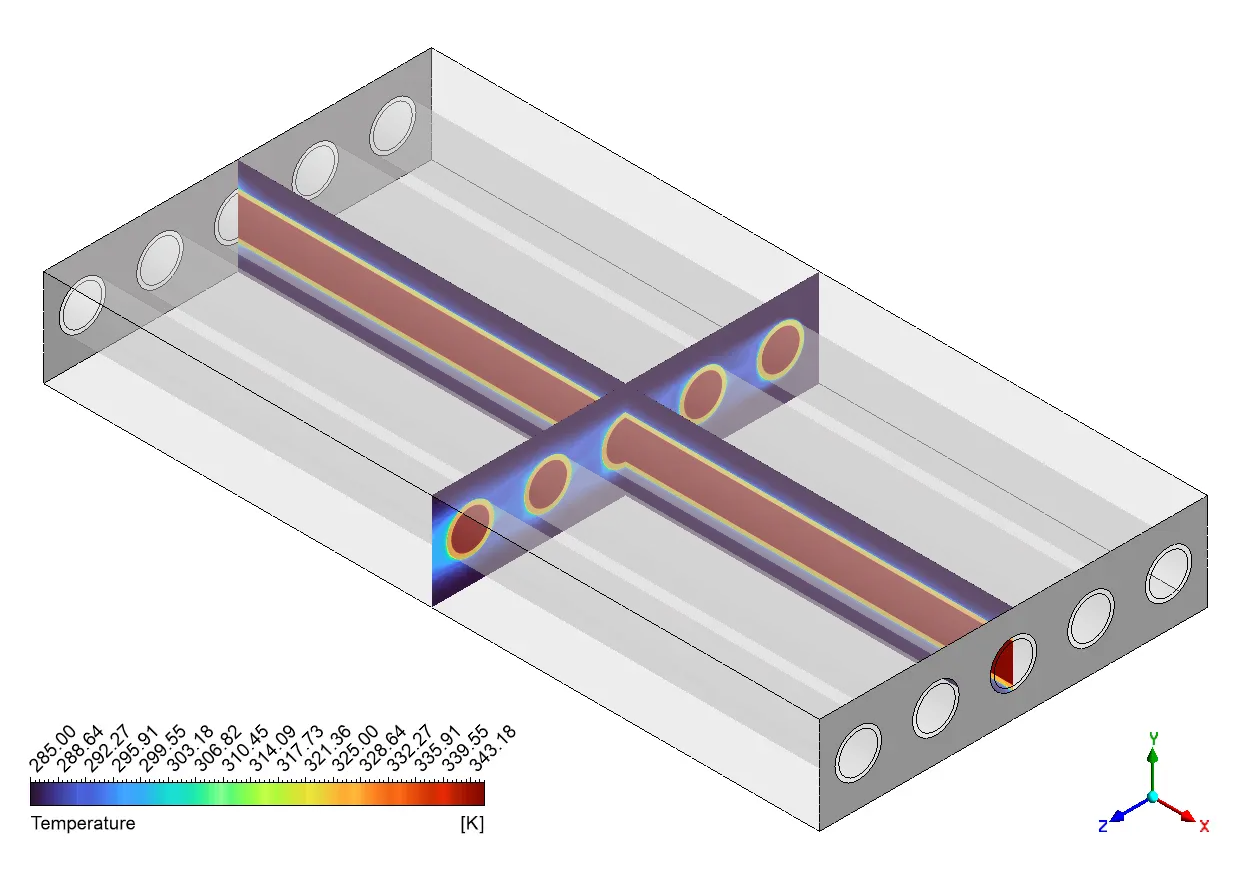
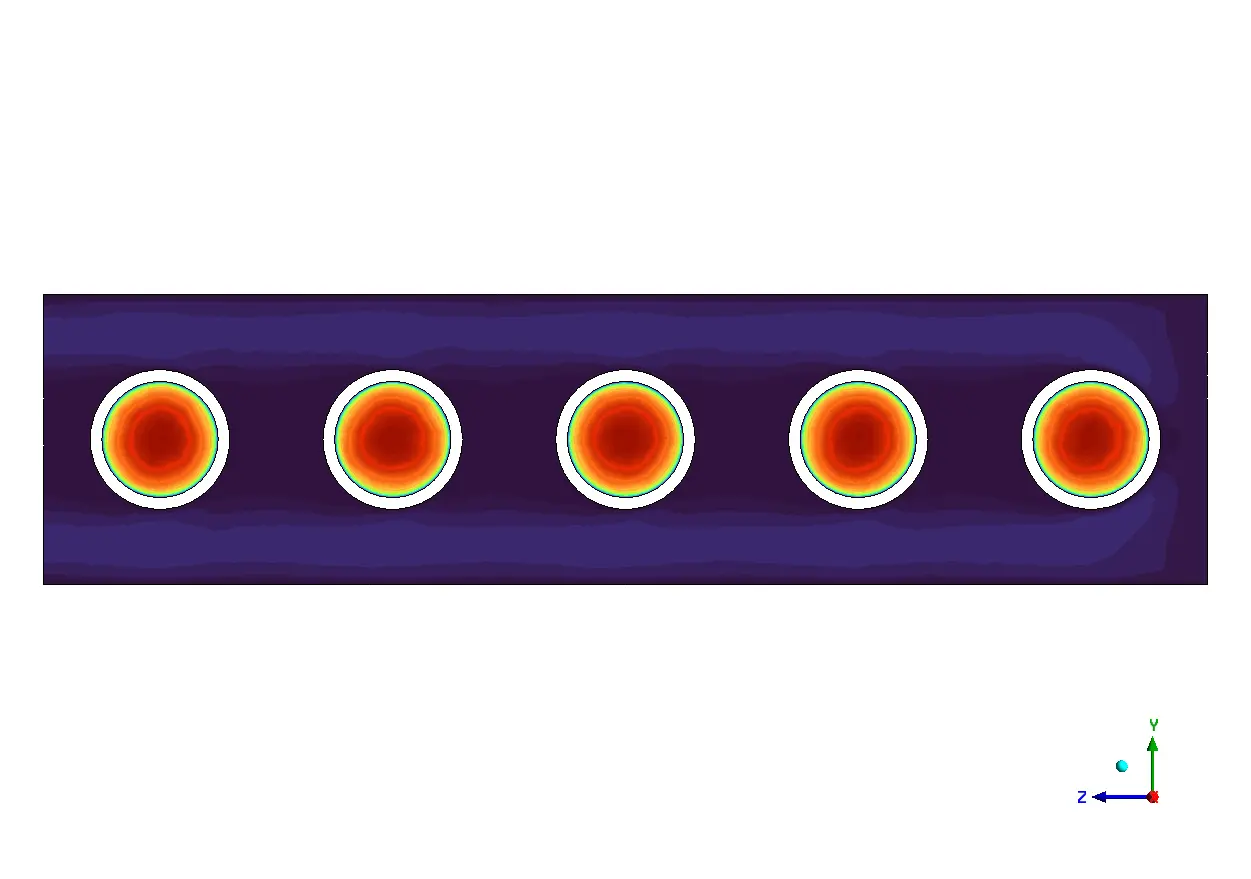
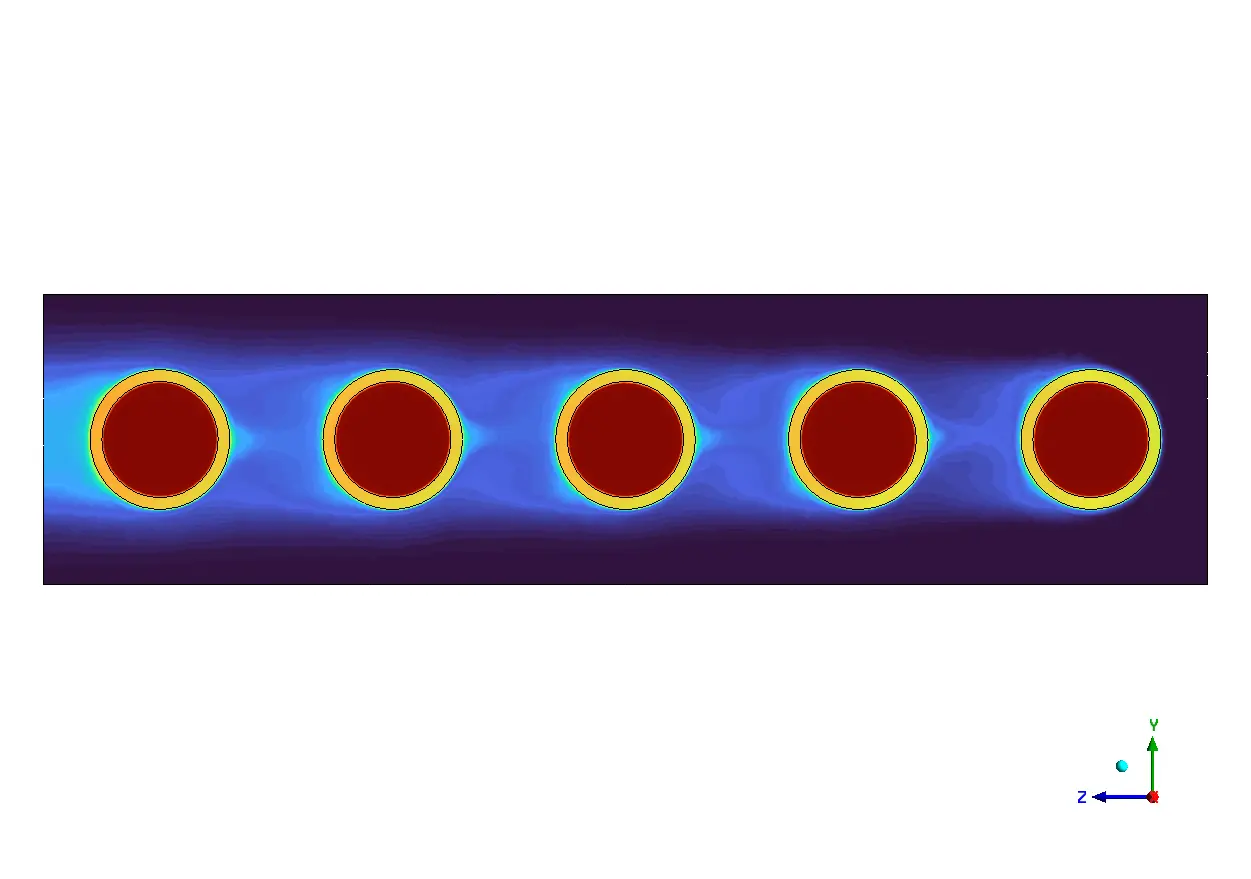
The picture shows how heat moves in our cross flow heat exchanger. You can see five tubes (the red circles) where hot fluid flows through. The blue area around the tubes is cooler water flowing across them. The yellow rings are the steel tube walls. The dark blue areas between tubes show where the cooling is strongest. This picture helps us understand how heat spreads from the hot tubes to the cooler water flowing around them.
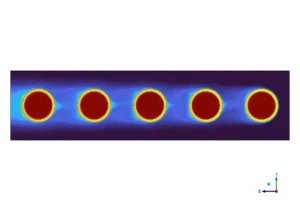
Figure 2: Temperature field around the tubes


Reviews
There are no reviews yet.