
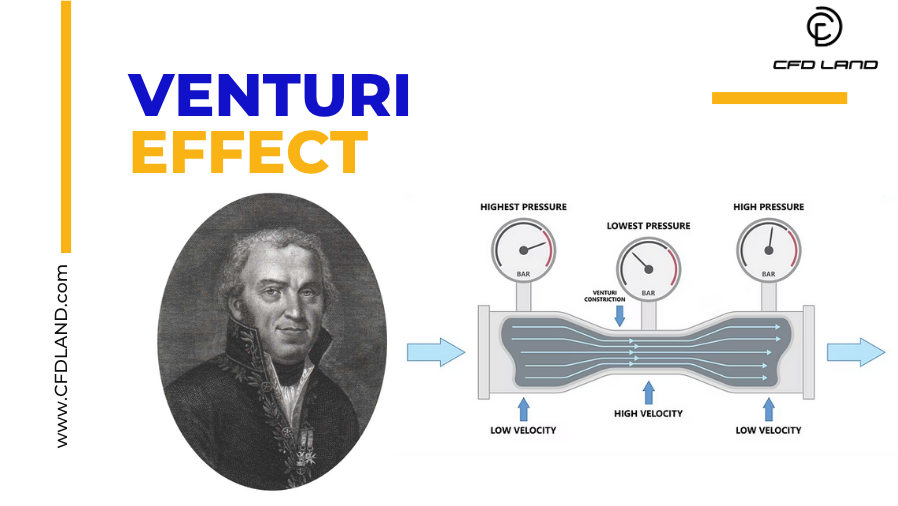
The Venturi effect is a fundamental principle in fluid dynamics that explains how fluid pressure decreases as fluid flows through a constricted section of pipe. This phenomenon, first described by Italian physicist Giovanni Battista Venturi in the 18th century (Fig.1), is widely applied in various fields such as aerospace, medicine, HVAC systems, and industrial fluid mechanics. In this article, we’ll explore the meaning of the Venturi effect, its theoretical background, how it works, and its real-life applications—from carburetors and atomizers to medical oxygen masks and water pumps.
Figure 1- Giovanni Battista Venturi (1746- 1822)
What Is the Venturi Effect?
Ever wondered how a vacuum cleaner creates suction, or how a car’s air diffuser works? The answer lies in a fascinating principle of fluid dynamics called the Venturi effect. The Venturi effect occurs when a fluid flows through a narrow or constricted section of a pipe, causing its velocity to increase and its pressure to decrease (Fig.2). This phenomenon only applies to subsonic flows and is a direct result of the Bernoulli principle, which states that in a steady flow, an increase in speed must be accompanied by a drop in pressure.
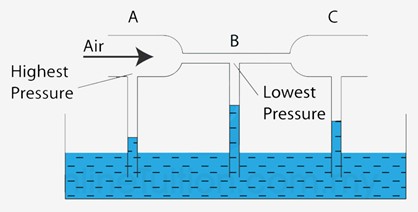
Figure 2- The Venturi effect is defined as the drop in static pressure of a fluid as it flows subsonically through a constricted area of a pipe.
Fig.3 illustrates how a vacuum cleaner demonstrates a practical, everyday use of the Venturi effect. As shown, the fan inside the vacuum rapidly spins to create a low-pressure zone within the main body of the device. Due to this pressure drop, air from the outside is forced to rush in through the nozzle, carrying dust and debris along with it. This is a direct application of the Venturi effect—as air moves through a constricted region (like the hose or nozzle), its velocity increases and pressure decreases, generating suction. The combination of high-speed airflow and reduced pressure enables the vacuum to pull in particles efficiently from floors or surfaces.
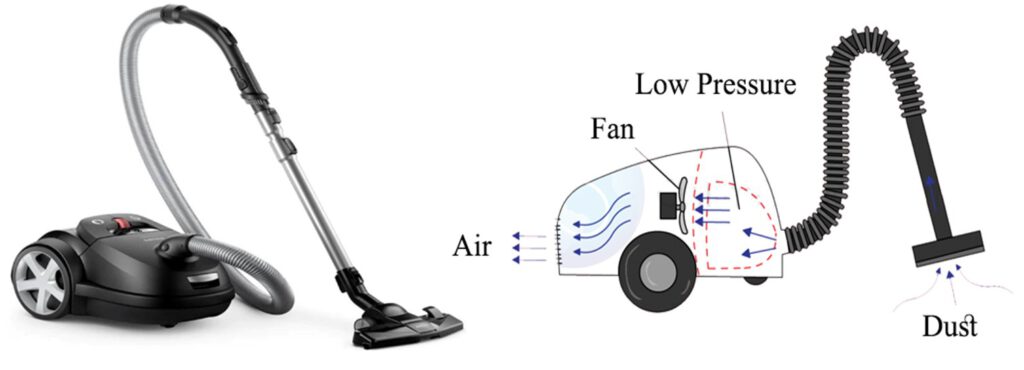
Figure 3- vacuum cleaner is an example of daily routine Venturi effect application
How the Venturi Effect Works
The Venturi effect can be fully understood through two essential equations in fluid dynamics: the continuity equation and Bernoulli’s equation. These mathematical expressions describe how fluid velocity and pressure change in a duct or pipe with varying cross-sectional area.
Continuity Equation
The continuity equation is based on the principle of mass conservation. For an incompressible fluid flowing through a pipe, the mass flow rate must remain constant:

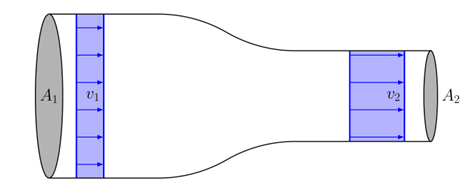
Figure 4- Incompressible fluid flow along a pipe with variable cross-section
Where A1, A2 are the cross-sectional areas of the pipe at two different points, and v1, v2 are the fluid velocities at those same points. This equation tells us that when the area decreases (like in a throat or narrowing of a pipe), the velocity must increase.
Bernoulli’s Equation
In order to better explain the Venturi effect, it is necessary to consider the fluid that moves inside the conduit as an ideal fluid and apply to it the Bernoulli principle, that says: the sum of the kinetic energy (contribution provided by the velocity v of the fluid), the potential energy (contribution provided by the change in height h of the fluid) and the pressure p remain constant along the conduit.
Figure 5- Porträt von Daniel Bernoulli (1700 – 1782)
In other words, when studying steady incompressible inviscid flows, Bernoulli’s principle is used to describe the relationship between pressure, density, fluid velocity per unit mass, and potential energy (normally just gravitational) per unit mass along a given streamline in a laminar flow. The following equation can be derived for flows along a given streamline (Fig.6):
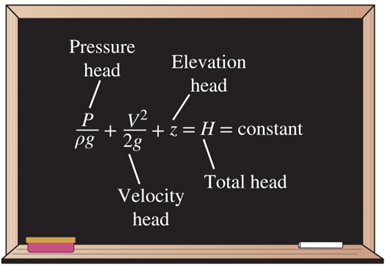
Figure 6- Bernoulli’s equation in fluid mechanics
If height h remains constant and velocity v increases, then pressure P must decrease.
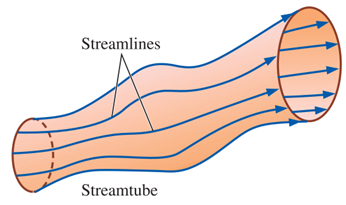
Figure 7- A streamtube consists of a bundle of individual streamlines: Bernoulli’s Equation must be written for a streamline in a laminar flow.
From Bernoulli’s principle, we should now see how the Venturi effect occurs (Fig.8). As the flow moves into the constricted region, there will be a pressure drop. If we have a decrease in pressure for an incompressible flow along a given streamline, then the velocity must increase in order to keep the RHS of Bernoulli’s principle constant. This explains why the flow rate increase observed in the Venturi effect occurs. Just from the basic flow rate solution in laminar flow, it should also be obvious that the pressure gradient increases in the constricted region, thus the flow rate should increase.
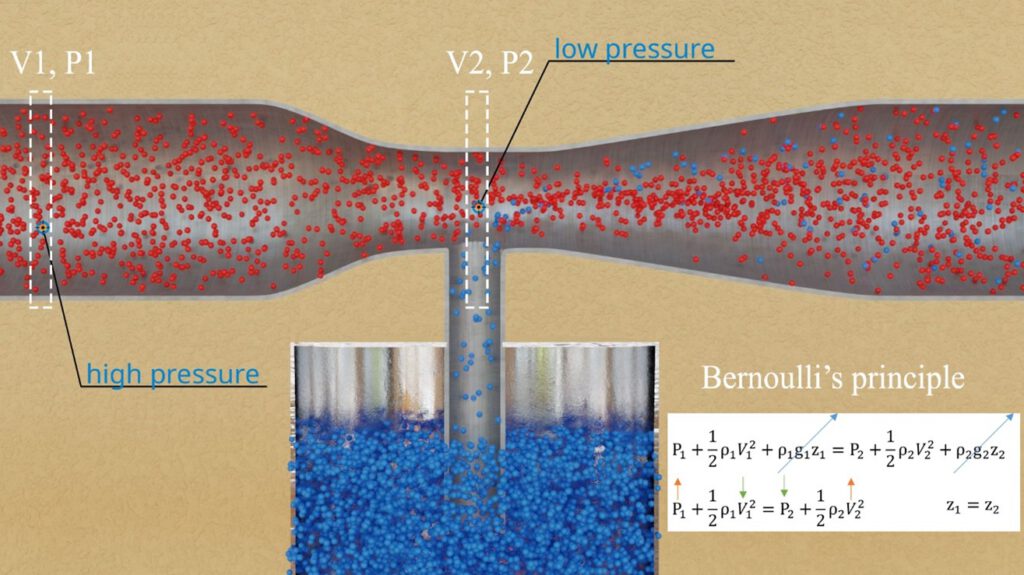
Figure 8- Venturi effect from Bernoulli’s principle point of view.
Venturi Effect: ANSYS Fluent Tutorial
Venturi Tube CFD: A Fluent Tutorial on Flow Measurement (Fig.9) is a practical, step-by-step CFDLAND product designed to help engineers and students simulate the Venturi effect using ANSYS Fluent. This tutorial models a 2D Venturi tube connected to a U-tube manometer, leveraging the Volume of Fluid (VOF) multiphase model to capture the air-water interface and track pressure-induced fluid level changes. The simulation includes a high-quality structured mesh, wall adhesion for accurate meniscus formation, and transient analysis to visualize real-time flow behavior. Ideal for those studying Bernoulli’s principle, flow measurement, or multiphase CFD, this training provides all necessary files and explanations to confidently model Venturi-based systems in Fluent.
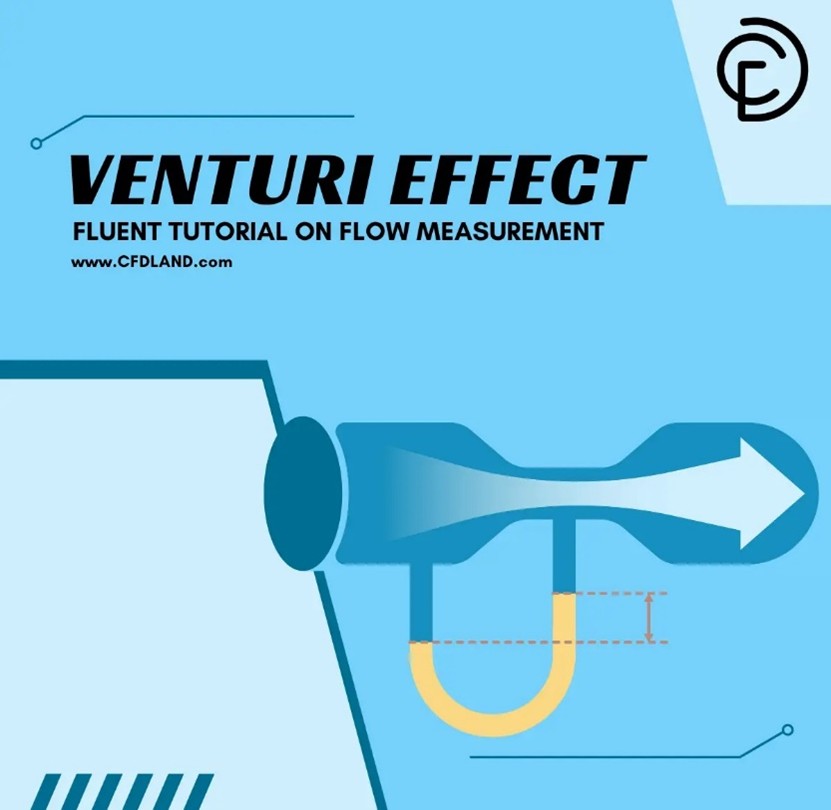
Figure 9- Venturi Tube CFD: A Fluent Tutorial on Flow Measurement
Venturi Effect Simulation in ANSYS Fluent
The Venturi effect is a key concept in fluid mechanics that explains how a fluid’s velocity increases while its pressure drops as it passes through a narrowed section of a pipe. Here, as an example, we simulate this phenomenon using ANSYS Fluent by designing a 2D Venturi tube, utilizing the Volume of Fluid (VOF) method in transient mode. The simulation effectively demonstrates the Venturi effect in a visual and practical manner.
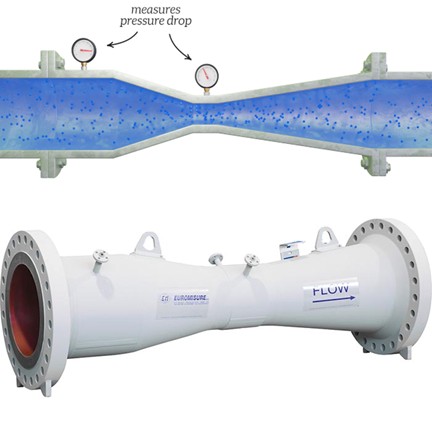
Figure 10- Example of Venturi tube for desert gas field flow measurement
- Venturi Tube Geometry Creation
To begin the Venturi effect simulation, create a 2D geometry of a Venturi tube in ANSYS SpaceClaim or DesignModeler. The geometry should consist of (Fig.11):
- An inlet section,
- A converging section,
- A narrow throat,
- A diverging section,
- And an outlet.
The symmetrical, streamlined shape ensures smooth acceleration and deceleration of flow. Optionally, you can add vertical manometer arms to the top of the tube to visualize pressure differences using a second fluid, such as water or mercury, in a multiphase setup.
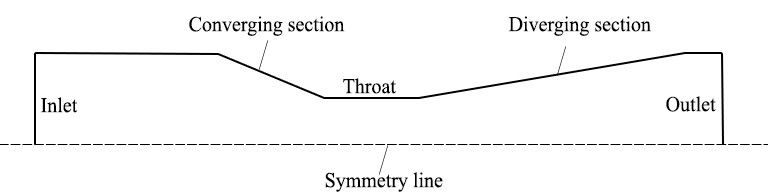
Figure 11- Common example of Venturi tube geometry
- Venturi Tube Meshing
Generate a structured mesh using ANSYS Meshing (Fig.12). Apply mapped face meshing to maintain a structured grid across the entire domain. Focus on refining the mesh in the throat region where velocity increases and pressure drops sharply, ensuring accurate capture of gradients. Good mesh quality with low skewness and aspect ratio is essential for achieving stable and accurate results in the Fluent solver.
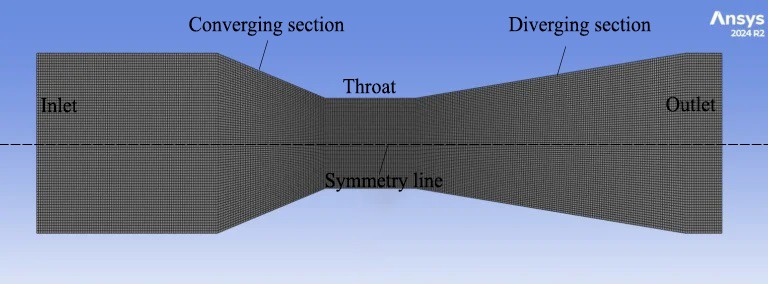
Figure 12- Venturi Tube Meshing by ANSYS Meshing
- Venturi Tube Fluent Setup
Open the mesh in ANSYS Fluent and choose a pressure-based solver in transient mode for time-dependent behavior. Enable gravity if you are modeling multiphase flow (e.g., manometer columns). Apply axisymmetric model if you didn’t use section such as manometer columns and so on. Moreover, for case study such as combination of manometer water columns and air flow in Venturi (Fig.13), activate the Volume of Fluid (VOF) model to track the interface between two immiscible fluids, and select the Geo-Reconstruct scheme for precise interface capturing. Depending on your flow conditions, select either a laminar model or a turbulence model such as k-epsilon.
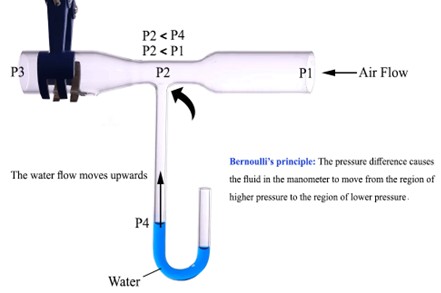
Figure 13- 2D model of the Venturi tube geometry
- Boundary Conditions
Set the inlet boundary as a velocity inlet with a known flow rate and the outlet as a pressure outlet at atmospheric pressure (Fig.14). Apply wall boundary conditions to all solid surfaces, including the tube walls and manometer arms. If using VOF, make sure to patch the initial water level in the manometer legs for proper initialization of the secondary phase.
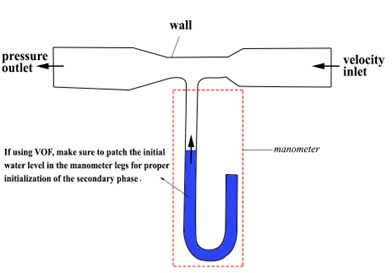
Figure 14- 2D Venturi tube with manometer: Boundary conditions types and flow visualization
- Input Material Properties
To change the fluid in your simulation, expand the Materials menu in the Outline View, then expand Fluid and double-click on the default material “air” (Fig.15). Rename it to “water”, optionally add the chemical formula “H₂O”, set the density to 1000 kg/m³ and viscosity to 0.001 Pa·s, then click Change/Create. When prompted to overwrite “air”, select No to keep both materials. Although “water” is now added to the material list, it hasn’t yet been assigned to any part of the domain—this must be done explicitly, as ANSYS supports multiple materials in different regions. In the next step, you’ll define which mesh zones use which materials.
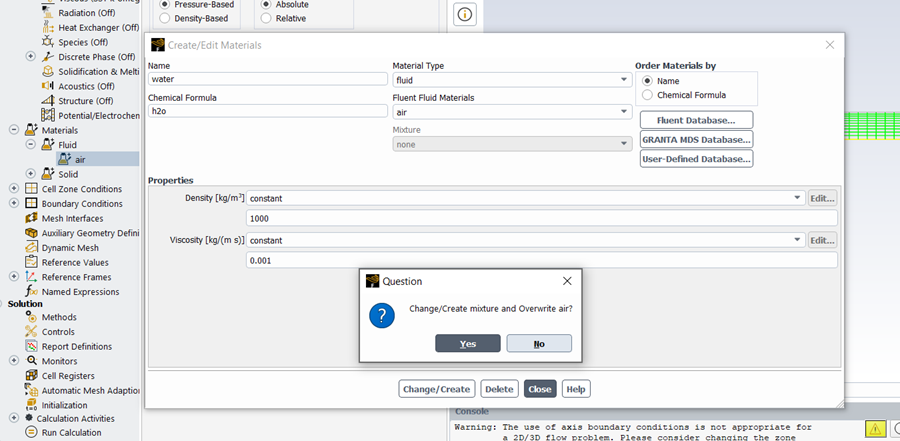
Figure 15- The schematic of creating/editing materials panel in ANSYS Fluent
- Post process the results
After completing the simulation of the Venturi tube in ANSYS Fluent, post-processing begins by visualizing key flow variables to interpret how the fluid behaves through the constricted geometry. Start by generating velocity contour plots (Fig.16) to observe how the flow accelerates in the throat of the Venturi tube. As expected, the velocity increases sharply where the cross-sectional area is reduced. This acceleration is a direct consequence of the conservation of mass (continuity equation), which requires the fluid speed to increase in narrower regions to maintain a constant mass flow rate. By contrast, in the inlet and outlet sections with larger areas, the velocity remains lower.
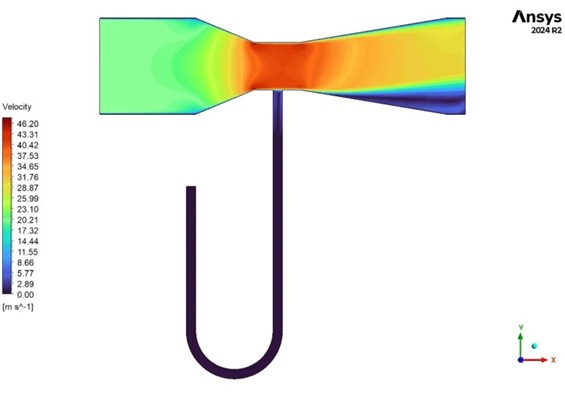
Figure 16- Venturi effect: velocity contour plots
Next, examine the static pressure contour or pressure line plots along the tube axis (Fig.17). According to Bernoulli’s principle, as velocity increases in the throat, the static pressure must decrease, and this inverse relationship is clearly shown in the results. You can also add streamlines and velocity vectors to visualize flow patterns, confirming smooth acceleration through the converging section and deceleration in the diverging section. These results together verify the Venturi effect and demonstrate the relationship between geometry, velocity, and pressure in fluid flow systems.
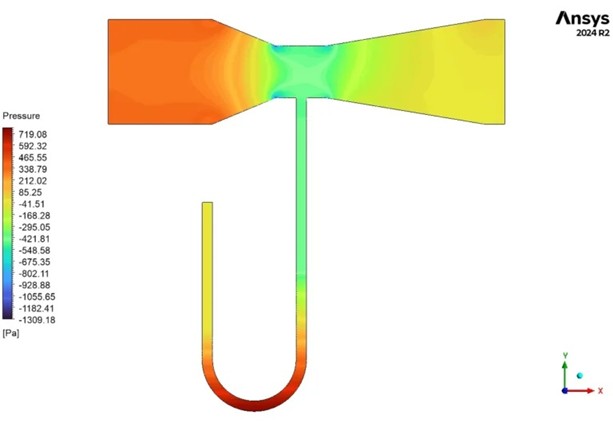
Figure 17- Venturi effect: pressure contour plots
Venturi Effect Application
The Venturi tube, based on a simple yet powerful fluid dynamic principle, finds wide application across various industries due to its ability to manipulate pressure and velocity effectively.
- Flow Measurement:
One of the most common applications of Venturi tubes is in measuring fluid flow rates in pipelines. Due to their reliable pressure-drop characteristics, they are used in water treatment plants, oil refineries, and chemical industries. By comparing pressure values at the inlet and the throat, engineers can calculate flow rate using Bernoulli’s equation and the continuity principle.
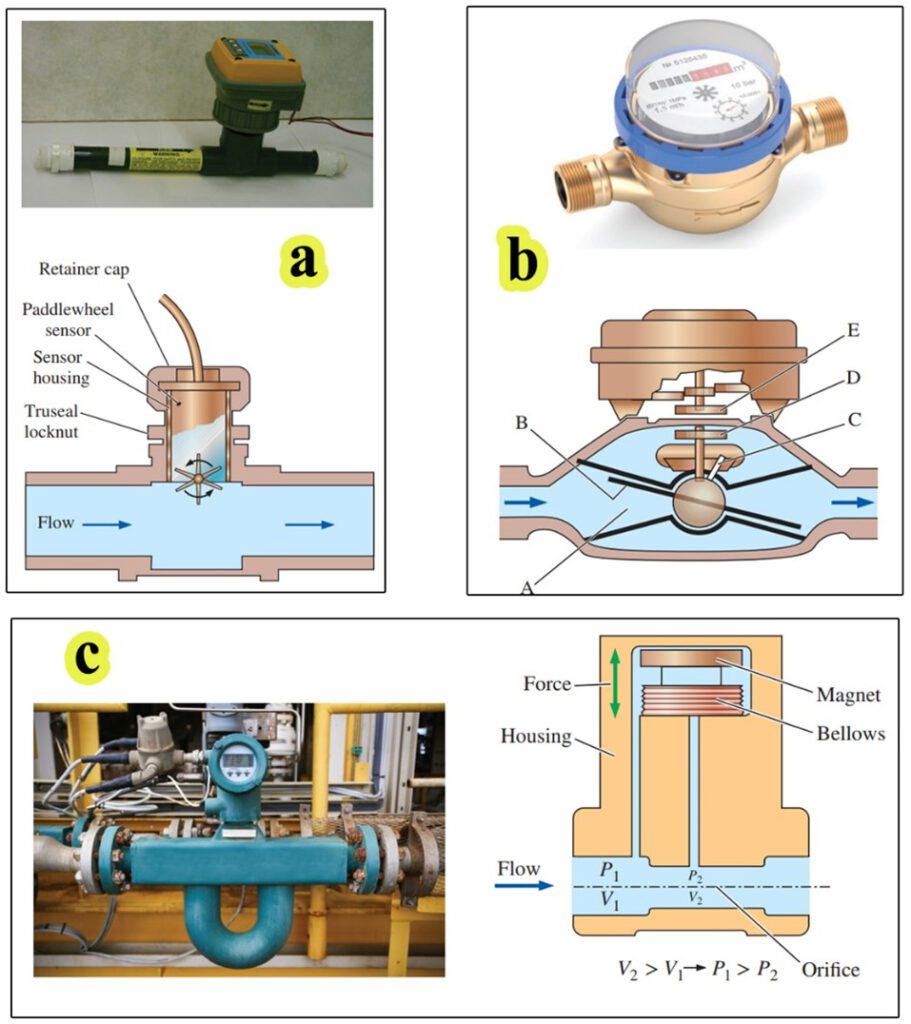
Figure 18- Types of Flow Measurement: a) Paddlewheel flowmeter, b) A nutating disk flowmeter, c) An orifice meter
- Carburetors in Internal Combustion Engines:
Venturi tubes are critical in carburetors, where they help mix air and fuel. As air flows through the narrow section of the Venturi, its velocity increases, and pressure decreases, drawing fuel into the airstream for efficient combustion in engines.
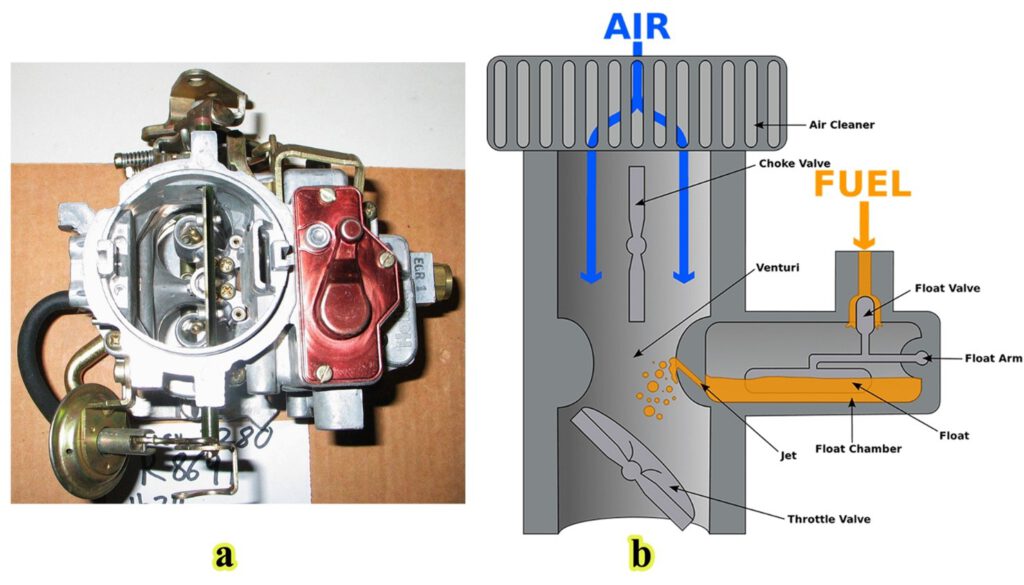
Figure 19- Venturi Effect application in Internal Combustion Engines: a)Two-barrel downdraft Holley 2280 carburetor, b) Cross-sectional schematic
- Medical Equipment (e.g., Oxygen Masks):
In respiratory devices like venturi masks, this principle allows controlled mixing of air and oxygen, delivering accurate oxygen concentrations to patients. The drop in pressure at the throat entrains room air with high-pressure oxygen.
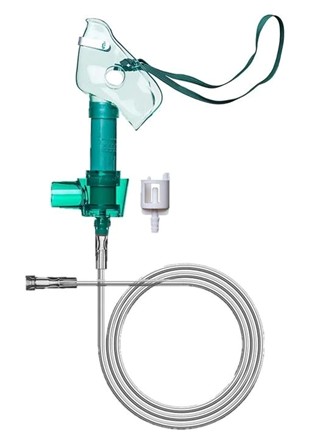
Figure 20- Venture effect example in Oxygen mask
- Vacuum Systems
Venturi tubes are used in vacuum generators, where high-speed fluid flow through a narrow section creates a low-pressure region, drawing in gases or liquids from another port, commonly seen in laboratory equipment.
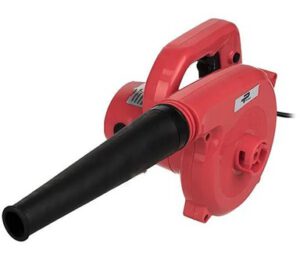
Figure 21- Electric Blower is an example of vacuum Systems: Venturi effect examples
- Agricultural and Industrial Sprayers
Many chemical sprayers in agriculture use the Venturi effect to draw liquid chemicals into a high-speed airflow, atomizing them into fine droplets for even spraying across fields or surfaces.
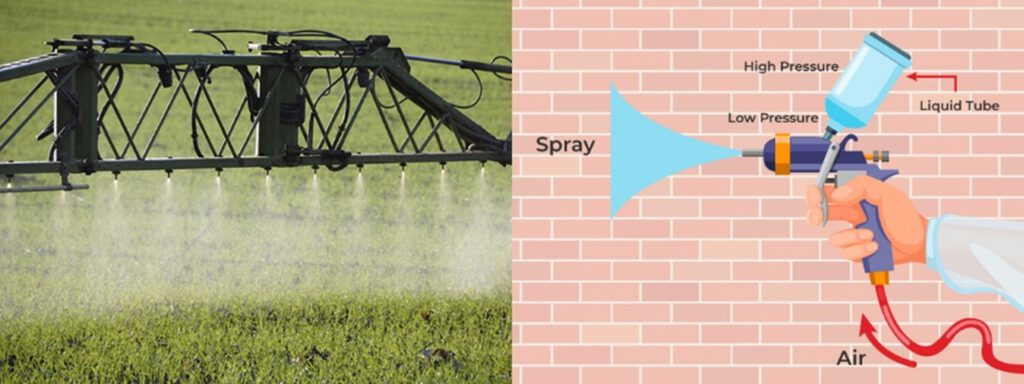
Figure 22- Venturi Effect can be observed in chemical sprayers in Agricultural and Industrial Sprayers
- HVAC Systems and Fluid Mixing
Venturi devices help mix or inject substances like refrigerants or additives into larger systems by exploiting pressure differences, ensuring uniform distribution without moving parts.
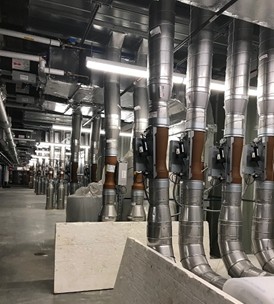
Figure 23- The Kansas University Integrated Science Building relies on venturi valves (red units in this image) to help ensure safe air in laboratories.
These applications highlight the Venturi tube’s value in systems where controlled flow, mixing, or suction is needed without mechanical complexity.
Conclusion
The Venturi effect is a key concept in fluid dynamics, with wide-ranging applications in engineering and daily life. By understanding the Venturi effect definition, we see how fluid speed increases and pressure drops in a constricted section—an outcome explained by Bernoulli’s principle. The Venturi effect equation helps quantify these changes and is critical in designing systems like nozzles, ventilators, and even Venturi effect masks used in medical settings. Practical Venturi effect examples include carburetors, atomizers, and flow meters, while its role in passive airflow control highlights the Venturi effect in buildings. Mastering this principle improves our ability to design efficient systems across mechanical, civil, and biomedical fields.
FAQs
- What is meant by Venturi effect?
The Venturi effect is the reduction in fluid pressure that occurs when a fluid flows through a narrow section of a pipe.
- What is the Venturi effect and Bernoulli’s principle?
The Venturi effect is a practical application of Bernoulli’s principle, which states that an increase in fluid speed leads to a decrease in pressure.
- How does a Venturi affect airflow?
A Venturi tube accelerates airflow in the throat region, causing the air pressure to drop and creating suction or pressure difference.
- What is the principle of Venturi?
The principle of Venturi is based on conservation of energy: as the fluid’s velocity increases in a constricted section, its pressure decreases.
- Where is the Venturi effect used in real life?
It’s used in carburetors, atomizers, flow meters, medical oxygen masks, and even in aircraft and HVAC systems.
- Can the Venturi effect be simulated in ANSYS Fluent?
Yes, the Venturi effect can be simulated in ANSYS Fluent using pressure-based solvers, appropriate boundary conditions, and transient or steady-state analysis.