


In engineering, fans are used to push air, and diffusers (expanding pipes) are used to slow that air down. When air slows down in a diffuser, its pressure goes up. This is called “pressure recovery,” and it is very important for HVAC systems and industrial cooling ducts. However, if the diffuser pipe expands too quickly, the air gets confused, breaks away from the walls, and wastes energy. To fix this, engineers put the fan directly inside the diffuser and test it using a Fan Inside Diffuser CFD simulation.
This report is a complete Fan Inside Diffuser fluent simulation tutorial. We are not comparing this to a physical lab test. Instead, we use ANSYS Fluent to visually learn how the spinning fan blades change the airflow inside the duct. By mastering this CFD Analysis of Fan Inside Diffuser, engineers can design better ventilation systems. For more lessons on how to simulate spinning machinery easily, please visit our MRF tutorials.
Figure 1: Schematic of the fan installed in a diffuser for aerodynamic flow analysis.
Simulation Process: The MRF Fluent Setup
To build this Fan Inside Diffuser ANSYS Fluent project, we created a 3D model of the duct and the propeller. Because the fan blades spin very fast, simulating the real physical movement takes too much computer time. Instead, we used the MRF Fluent method (Multiple Reference Frame). This is a smart mathematical trick. We tell the computer that a small invisible zone around the blades is spinning at exactly 1440 rpm, while the rest of the duct stays completely still. To make sure the math is accurate, we used a very fine mesh (tiny calculation grid) near the propeller blades and the duct walls (Figure 2). This is where the air speed changes the most, so the computer needs more points to calculate the physics correctly.
Figure 2: Finer mesh grid near the propeller blades and duct walls to capture the fast-changing aerodynamics.
Post-processing: The Cause and Effect of Aerodynamic Thrust
To truly understand this Fan Inside Diffuser fluent study, we must strictly analyze the visual data provided by the simulation. The story of this airflow has three distinct phases: the messy inlet, the powerful fan, and the struggling exit.
- Phase 1: The Messy Inlet (Before the Fan): Look at the left side of the Streamlines (Figure 3) and the Velocity Contour (Figure 4). The air enters the duct at a slow speed of 7 to 15 m/s (dark blue colors). Because of the shape of the inlet duct, the air does not flow straight. It tumbles and creates messy “recirculation swirls” (the twisted blue lines in Figure 3) before it even reaches the fan. This is bad because swirling air wastes energy.
- Phase 2: The Fan Engine (The Cause) The spinning fan is the engine of the system. The blades (spinning at 1440 rpm) violently crash into the messy, slow air. The blades grab the air, organize it, and shoot it forward. Look at the bright green and yellow colors in the Velocity Contour (Figure 4). The speed suddenly jumps to 60 to 75 m/s. Notice the shape of this fast air: it looks like a dumbbell. The air is very fast at the top and bottom (the blade tips) but slower in the middle (the hub). This proves exactly how a fan works: the outer tips of the blades travel faster and generate almost all of the pushing power (thrust).
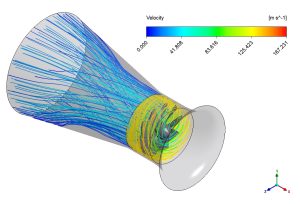
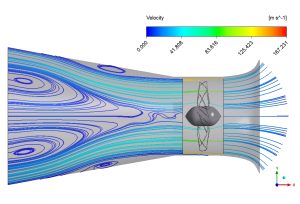
Figure 3: Streamlines showing the messy blue swirls before the fan, and the fast, organized jet created after passing through the blades.
- Phase 3: The Diffuser Expansion (The Effect & The Warning) Now the fast, energized air enters the diffuser section (the expanding pipe on the right). A diffuser is supposed to slow the air down smoothly to increase pressure. At first, the powerful jet from the fan works perfectly. The streamlines (Figure 3) show the air becoming straight and organized. However, we must look closely at the end of the Velocity Contour (Figure 4). Near the exit, the speed drops very rapidly, and a thick blue layer (the boundary layer) grows along the walls. This rapid drop is a physical warning. It tells us that the expansion angle of the diffuser is too wide. The air is struggling to stick to the walls, causing a phenomenon called “flow separation.” Because the air separates, the diffuser fails to recover the maximum amount of pressure.
This highly accurate CFD analysis shows engineers exactly what to fix. The fan works perfectly to energize the flow, but the exit diffuser must be redesigned with a gentler, more gradual angle to prevent flow separation and improve the system’s overall efficiency.
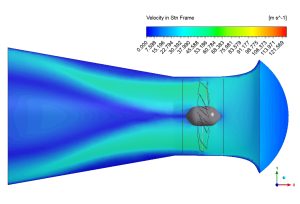
Figure 4: Velocity contour showing the air speeding up from 7-15 m/s to 60-75 m/s. The green/yellow dumbbell shape proves the blade tips generate the most thrust, while the rapid drop at the right indicates exit separation.
Key Takeaways & FAQ
- Q: What is the MRF (Multiple Reference Frame) method?
- A: It is a math setting in ANSYS Fluent that simulates the 1440 rpm spinning effect of the fan without physically moving the computer mesh, saving massive amounts of time.
- Q: Why does the velocity contour look like a “dumbbell”?
- A: Because the outer tips of the fan blades cover more distance per rotation than the center hub. Therefore, the tips hit the air harder, creating the highest velocity zones (60-75 m/s) at the top and bottom of the pipe.
- Q: What does the rapid velocity drop at the exit mean?
- A: It indicates that the diffuser is expanding too quickly. The air cannot follow the steep walls and detaches (flow separation), which ruins the pressure recovery. The diffuser angle needs to be made smaller and smoother.


Reviews
There are no reviews yet.