

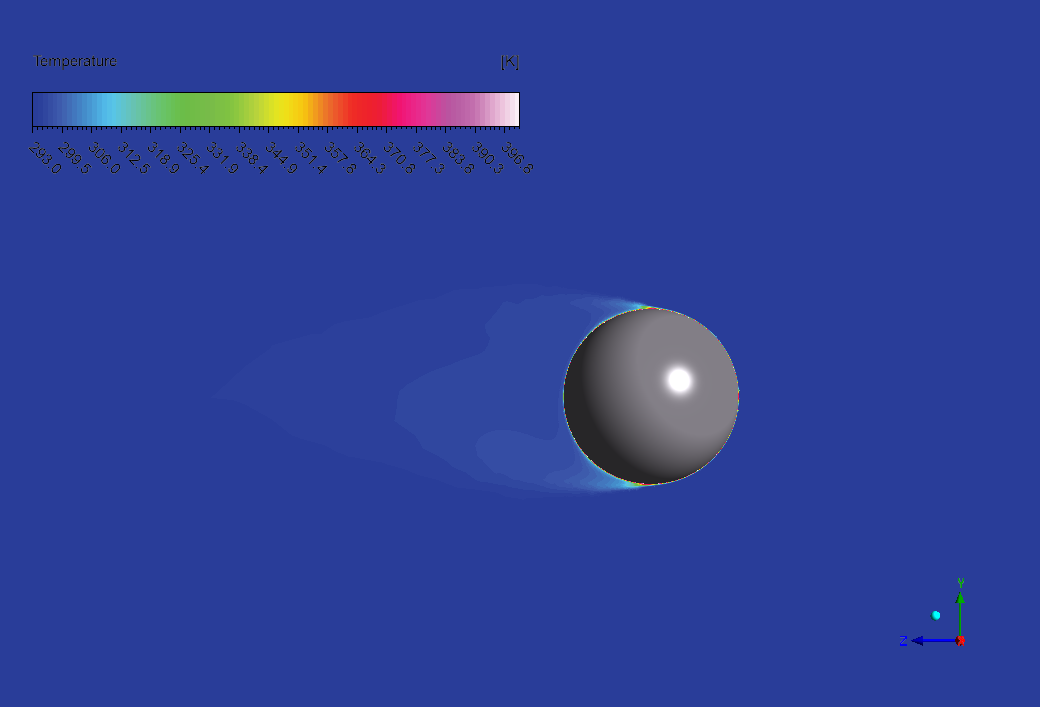
Heat transfer around spherical objects occurs in countless engineering applications, from cooling systems to space vehicles! First of all, engineers use both analytical solutions and computer simulations to understand how heat flows around a sphere. Additionally, the Nusselt number serves as a critical measurement that shows how effectively heat moves through fluids compared to still materials. Most importantly, VALIDATION studies comparing math formulas with CFD modeling results help engineers trust their computer predictions, with differences often below 6%. Furthermore, these studies reveal how convective heat transfer changes with different Reynolds numbers, creating predictable patterns that work for many real-world problems. Understanding heat flow around simple shapes builds the foundation for solving much more complex thermal engineering challenges in modern industries!

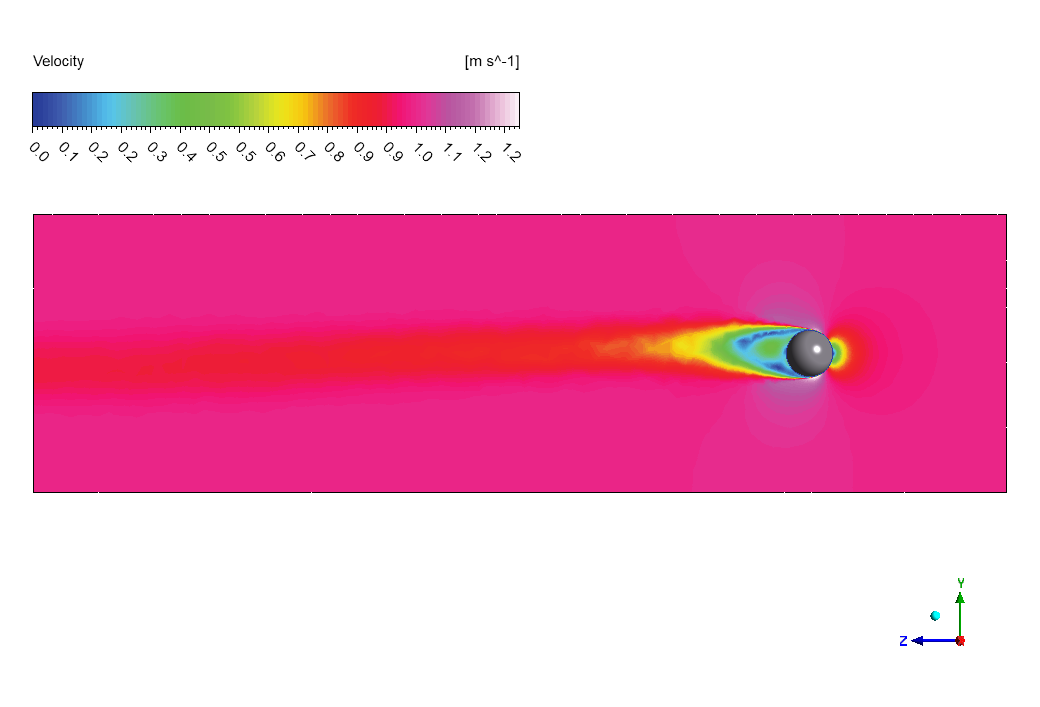
Figure 1: Heat Transfer around a sphere
Simulation Process
A 1-cm sphere is placed in a rectangular domain. The grid features a thin boundary layer on sphere walls that gradually increase in size, leading to 1398307 elements. The Nusselt number for the flow passing over a sphere is calculated analytically based on the following equation ( considering the acceptable range of Reynolds number):
![\[ \mathrm{Nu} = 2 + 0.66\mathrm{Re}^{0.5}_{D} \mathrm{Pr}^{0.33} \]](https://cfdland.com/wp-content/ql-cache/quicklatex.com-c3341fb19ced7a2d2e4462baea783a1f_l3.png "Rendered by QuickLaTeX.com")
![\[ 1<\mathrm{Re}_{D}<10^5 \ \ , \ \ 0.6<\mathrm{Pr}<380 \]](https://cfdland.com/wp-content/ql-cache/quicklatex.com-fb502b286ac9db64dcfdeb0179669aa6_l3.png "Rendered by QuickLaTeX.com")
In our case problem, Reynolds is 11190.
Post-processing
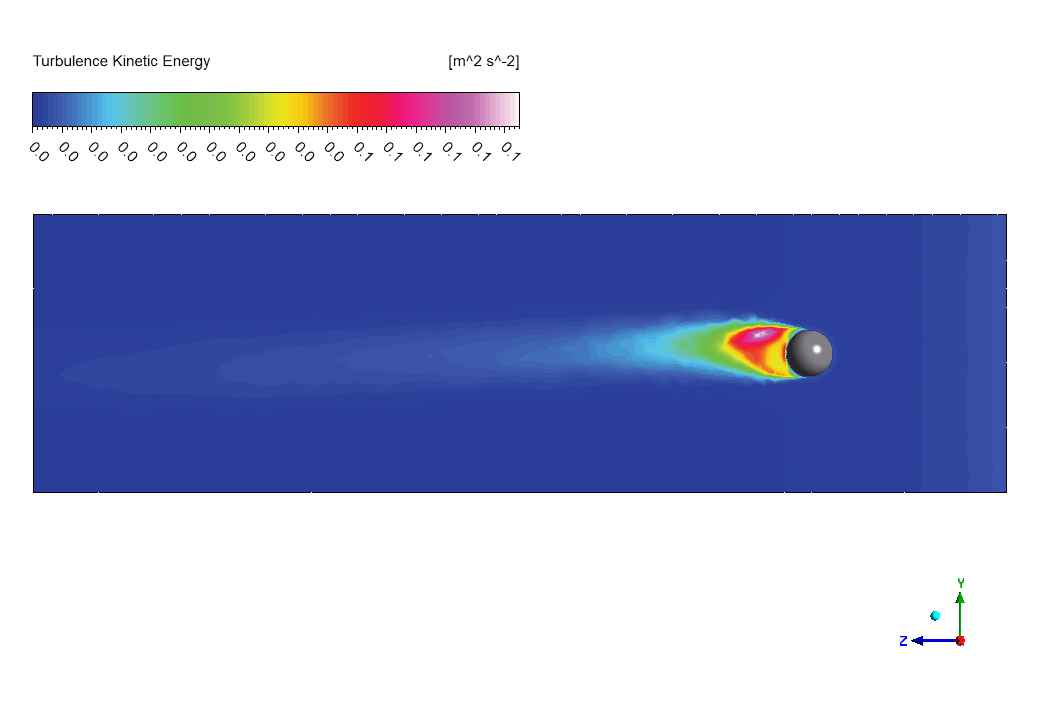
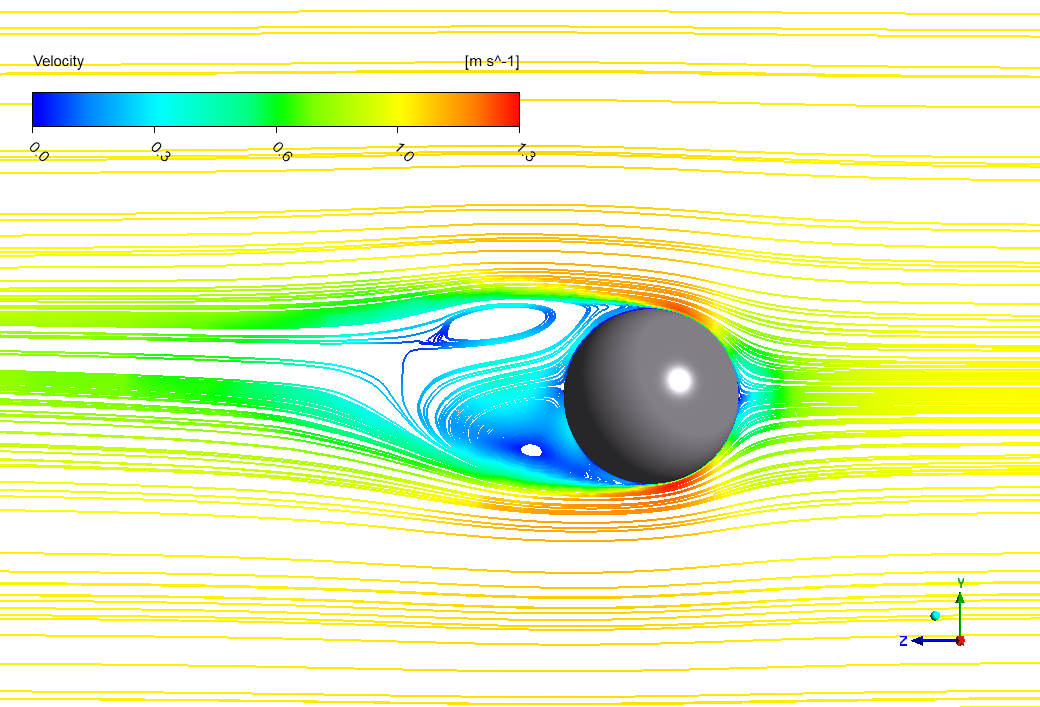
The heat transfer study for our sphere shows amazing results that match what math experts predicted! First of all, we checked how well heat moves around a sphere using both math formulas and computer models. Additionally, our CFD simulation calculated a number called the Nusselt number, which tells us how efficiently heat jumps from the sphere to the flowing air. Most importantly, our computer model found a Nusselt value of 121.86, which is super close to the math formula’s prediction of 129! Furthermore, the difference between these two values is only 5.2%, which engineers consider very good for real-world problems. The fluid flow pattern around the sphere creates zones where heat moves differently – faster at the front where air hits directly and slower at the back where swirling happens. Also, these swirls (called vortices) form behind the sphere when the Reynolds number reaches 11,190, matching exactly what scientists expect to see!
| Analytical Formulation | CFD Simulation | Error | |
| Nusselt Number | 129 | 121.86 | 5.2% |
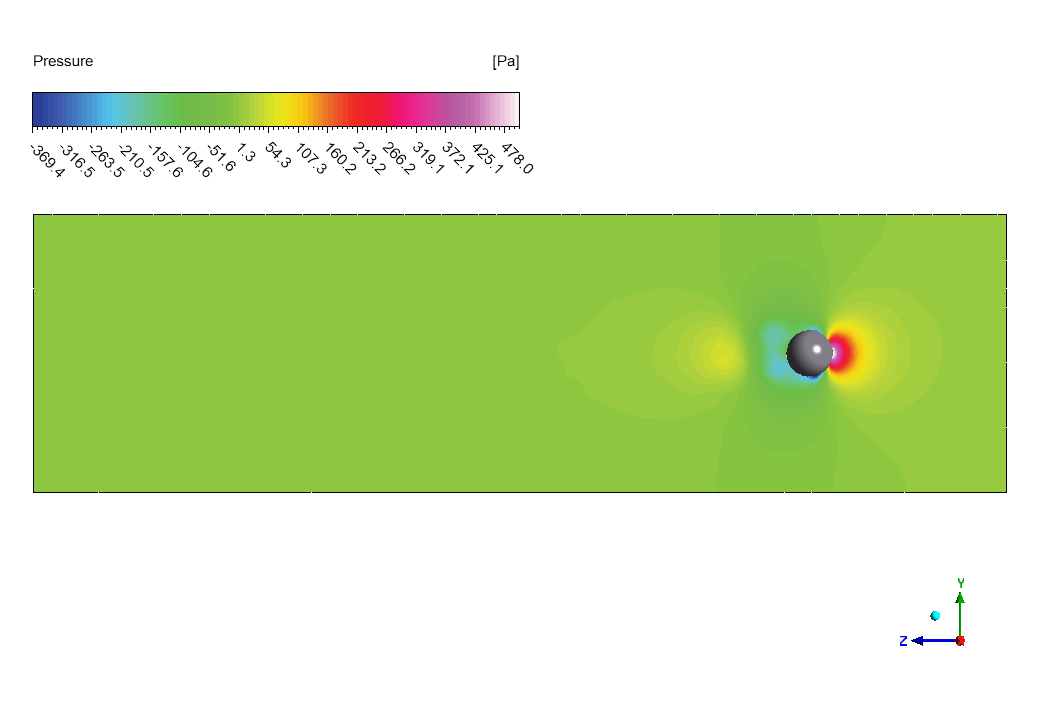
This small 5.2% difference between math formulas and computer models proves our thermal analysis is working correctly! First of all, seeing such close values means engineers can trust these computer models for designing real things like cooling systems or heaters. Additionally, the simulation shows exactly how air speeds up around the sides of the sphere, reaching almost 1.3 times the incoming speed at certain spots. Most importantly, our validation confirms that the heat transfer coefficient changes around different parts of the sphere, with highest values at the front and lowest at the back where air moves slowly. Furthermore, this knowledge helps engineers design better cooling systems for ball-shaped objects like storage tanks or electronic components. The study also confirms that for this specific Reynolds number, we can accurately predict how much cooling happens when air flows past spherical shapes – super helpful for many real-world engineering problems!
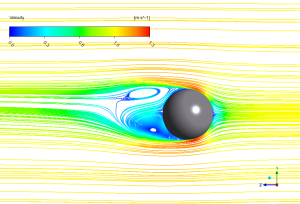
Figure 2: Velocity streamlines around a sphere showing fluid flow patterns with separation region


Reviews
There are no reviews yet.