

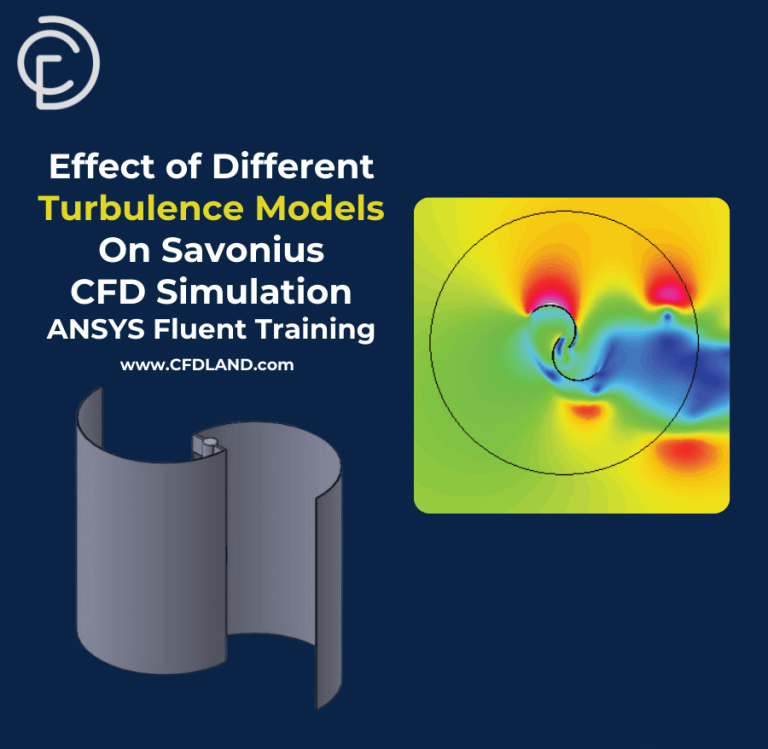
The Savonius wind turbine is a special type of Vertical Axis Wind Turbine (VAWT). Unlike traditional propeller-style turbines, its curved blades catch the wind like sails. Because of this, it is known as a drag-based turbine. These turbines are simple and can work well in changing wind conditions. Therefore, understanding how to improve their design is very important for renewable energy. A Savonius Vertical Axis Wind Turbine CFD simulation is a powerful tool that helps engineers see how the air flows around the blades and predict the turbine’s performance.
In this project, we perform a detailed simulation of a Savonius VAWT. Our goal is to model its rotation and analyze its power output. To guide our work, we will use the methods and setup from the reference paper “PERFORMANCE CHARACTERISTICS OF VERTICAL-AXIS OFF-SHORE SAVONIUS WIND AND SAVONIUS HYDROKINETIC TURBINES” by Talukdar, et al. [1].
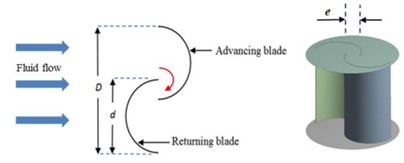
Figure 1: A schematic view showing the basic design of the Savonius turbine blades [1].
Simulation Process: CFD Modeling of Rotation with Sliding Mesh in Fluent
The first step in our Savonius wind turbine cfd simulation was to build the geometry. Using ANSYS Design Modeler, we created the 3D model of the turbine blades. The model was then placed inside two different fluid zones: a small rotating circle around the turbine and a large stationary box representing the surrounding air. Next, a high-quality mesh was generated. A very fine mesh, called a boundary layer mesh, was created on the blade surfaces to accurately capture the air flow.
Then, the physics of the simulation were set up in ANSYS Fluent. The key to simulating a rotating machine is the Sliding Mesh technique. This powerful feature allows the inner circular mesh zone to spin with the turbine, while the outer mesh stays still. The software then correctly calculates how the flow information passes across the moving interface. To model the effects of turbulence, the k-omega SST model was used. This model is excellent for VAWT CFD Simulation because it is very accurate at predicting flow close to walls, like the turbine blades.
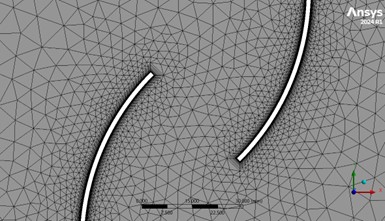
Figure 2: The boundary layer mesh on the Savonius VAWT Fluent blades, which is critical for accurate flow prediction.
Post-processing: Torque Performance and Complex Wake Structure
An in-depth look at the results gives us a full understanding of the turbine’s performance. The torque coefficient, shown in the plot in Figure 3, tells us how effectively the wind’s force is converted into rotational power. At the beginning of the simulation, the torque values fluctuate up and down. This is because the turbine is just starting to spin and the airflow around it is still developing. However, after a few rotations, the pattern becomes stable and periodic. For this reason, the plot shows the data starting from the fourth revolution. This stable performance is the most important result, and the simulation predicts an average torque coefficient of approximately 0.18 in this steady, periodic phase. The torque coefficient is computed, by the way, using the equation:

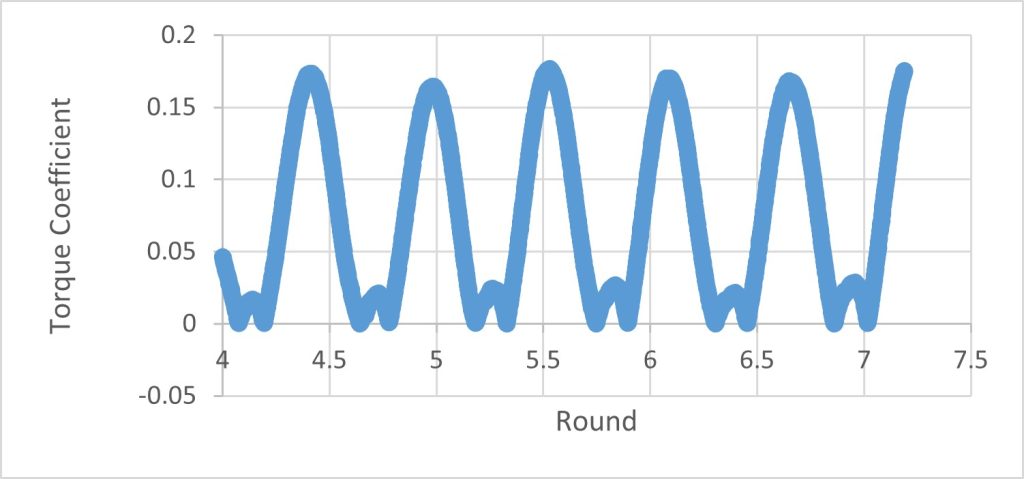
Figure 3:The torque coefficient plot, showing the turbine reaching a stable, periodic performance after the initial startup.
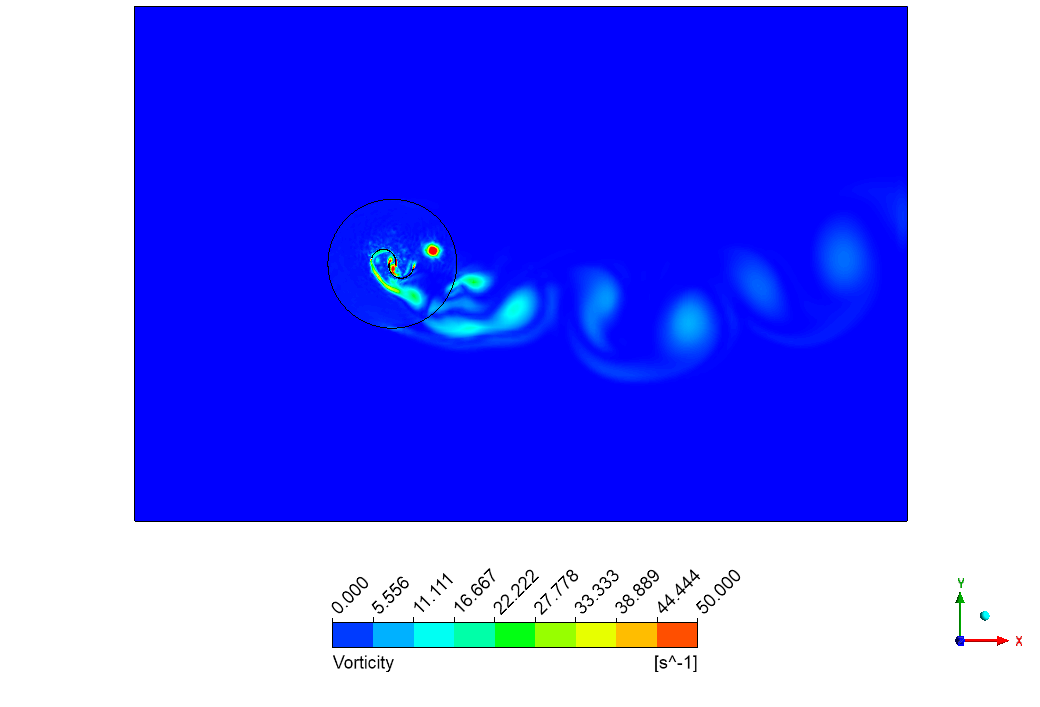
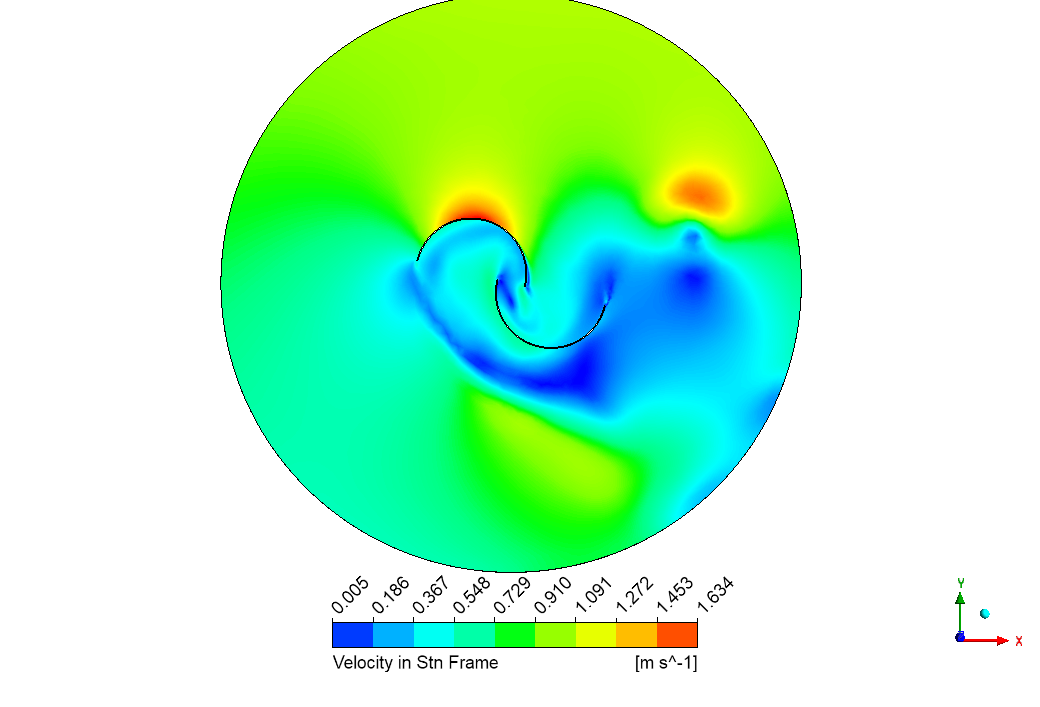
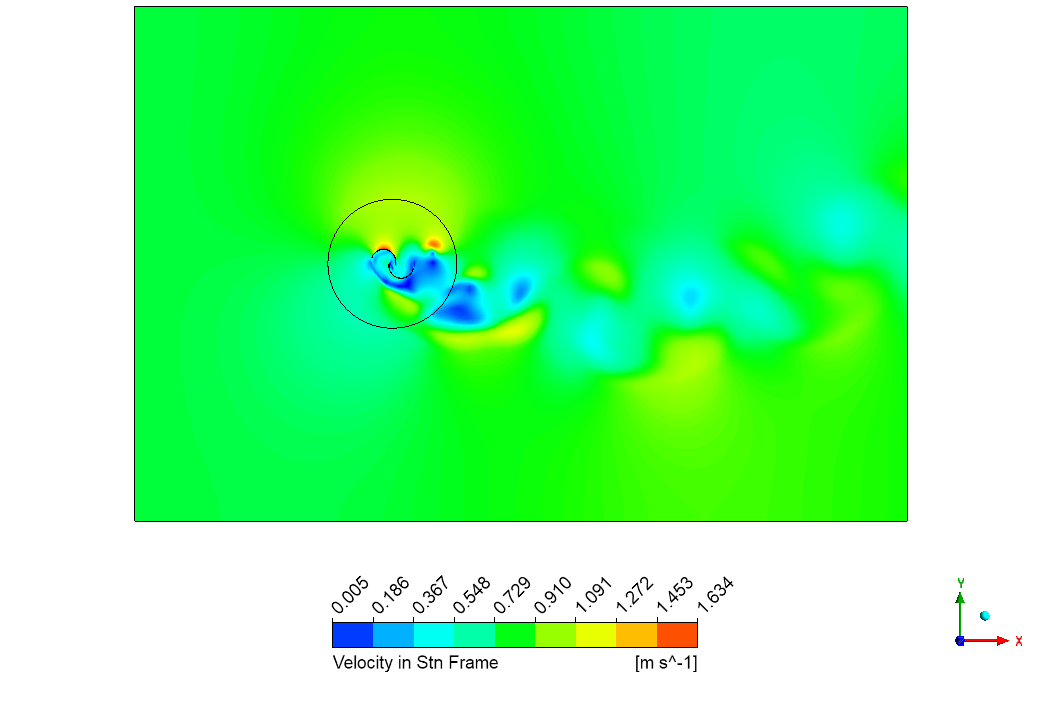
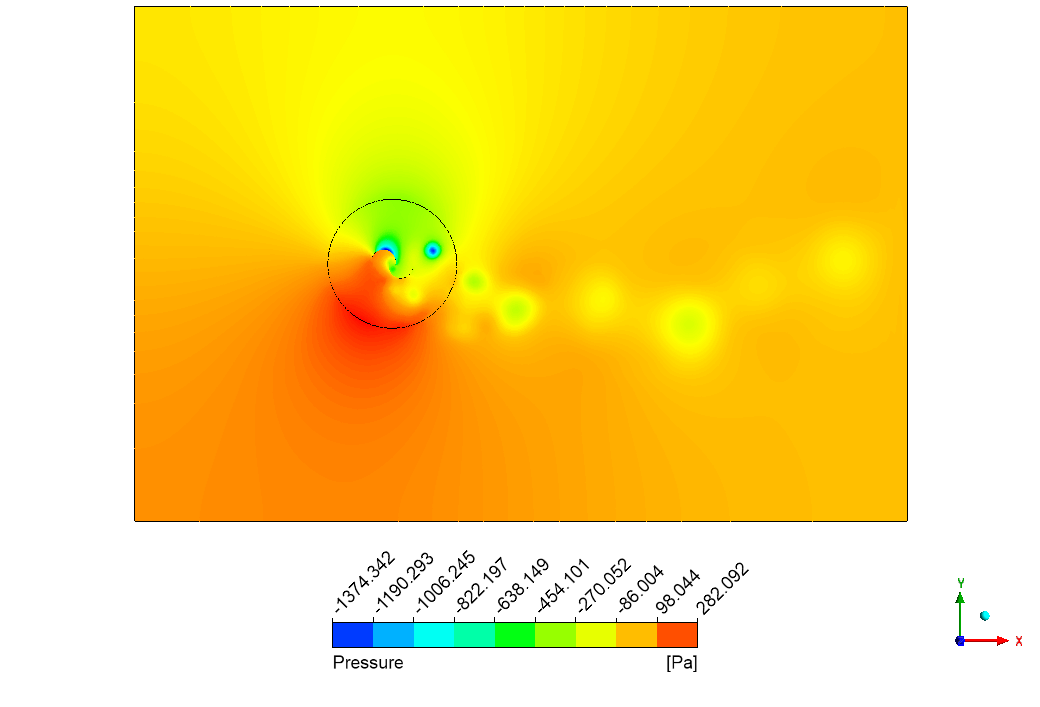
The velocity contour in Figure 4 gives us a clear picture of the airflow after it passes the turbine. This area of slower, disturbed air is called the wake. The analysis shows a large wake region directly behind the rotor, where the velocity is much lower than the incoming wind. Inside this wake, we can see complex patterns called vortices, which are created as the air swirls off the moving blades. This detailed Wake Analysis Wind Turbine simulation is very important for real-world applications. For example, engineers use this information to decide how far apart to place turbines in a wind farm so that the wake from one turbine does not reduce the power of the next one. This powerful insight is a major achievement of our Savonius Vertical Axis Wind Turbine Fluent simulation.

Figure 4: The velocity contour showing the complex wake structure and vortex patterns behind the rotating Savonius wind turbine.


Reviews
There are no reviews yet.