

In many industries, it is crucial to measure the speed of a fluid moving through a pipe. A Venturi tube is a clever and efficient device that does this by using a simple change in pipe shape. The pipe gets narrow in the middle (the throat) and then wide again. This design uses a fundamental rule of fluid physics, Bernoulli’s principle, to work. A Venturi Effect CFD simulation is the best way for engineers to visualize and precisely measure what happens inside. Using ANSYS Fluent, we can see exactly how velocity and pressure change, which is essential for designing accurate Venturi meter CFD models. This report details the simulation of a Venturi tube connected to a U-tube manometer to show this principle in action.

Figure 1: A schematic showing the basic geometry of a Venturi tube with a U-tube manometer.
Simulation Process: Modeling the Venturi Tube Fluent Simulation
The simulation process began with creating a 2D model of the Venturi tube geometry. A high-quality structured mesh was used, which gives very accurate results for this kind of straight, defined shape. The mesh was made much finer near the walls and inside the narrow throat section to correctly capture the high velocity and pressure changes in these critical areas.
The core of this Venturi tube fluent simulation is the Volume of Fluid (VOF) multiphase model. This model is perfect for tracking the clear interface between two fluids that do not mix, in this case, air and water. We also enabled the wall adhesion effect to realistically model the meniscus, which is the curve that forms where the water touches the walls of the U-tube. The simulation was run as transient, allowing us to see how the water level in the manometer changes over time in response to the flow.
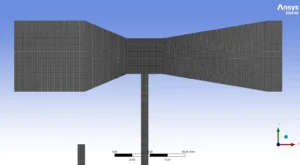
Figure 2: The structured mesh used for the Venturi Effect CFD simulation, with refinement in the throat
Post-processing: CFD Analysis of the Venturi Effect Mechanism
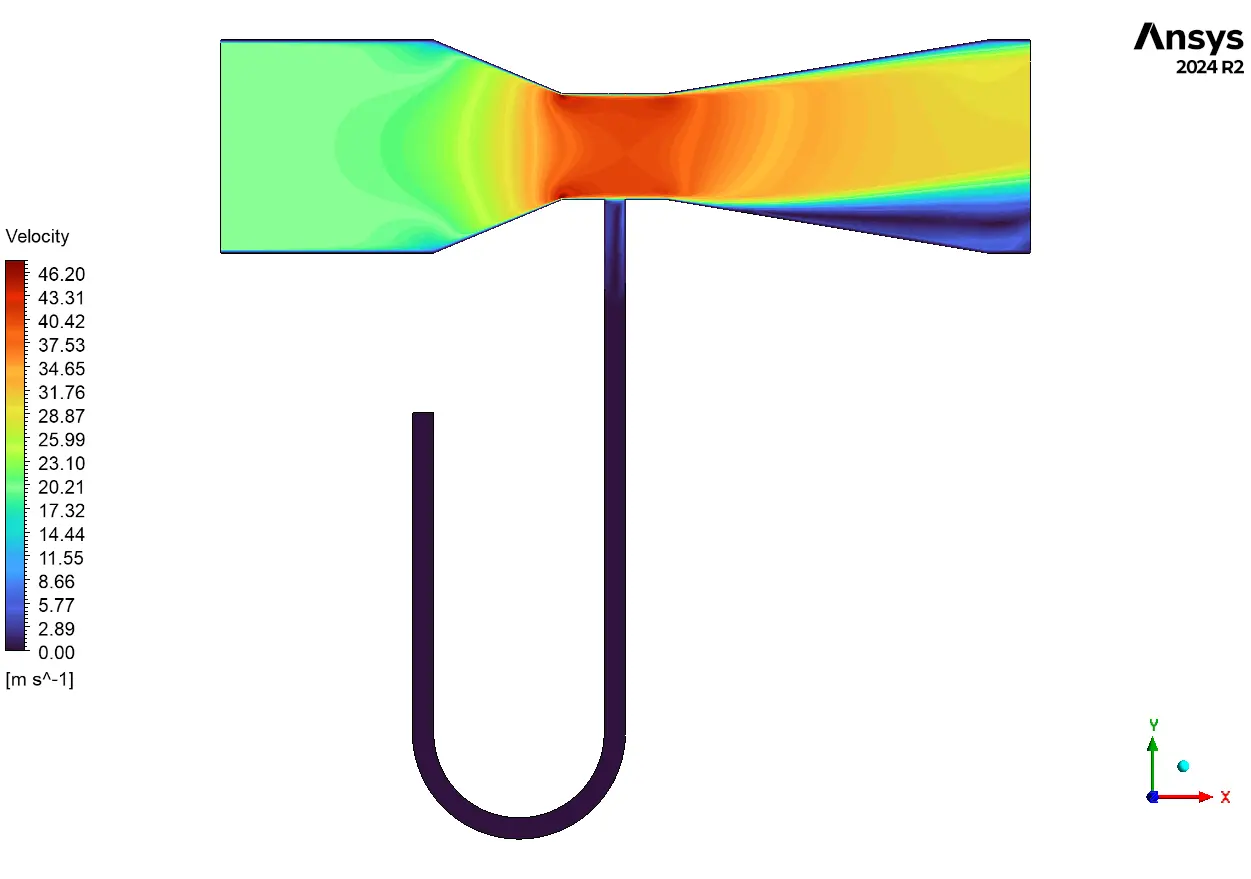
The simulation results provide a clear and fully substantiated story that begins with the pressure changes inside the Venturi tube, which is the core cause of the entire effect. The pressure contour in Figure 4 shows that the pressure is highest (red/orange) at the wide inlet of the tube. As the tube’s geometry forces the fluid to squeeze into the narrow throat, the fluid must speed up. According to Bernoulli’s principle, this increase in velocity must be accompanied by a significant drop in pressure. The simulation proves this perfectly, showing a distinct area of low pressure (blue), dropping to -1309 Pa, precisely in the throat. As the fluid enters the expanding section (the diffuser), it slows down, and the pressure begins to recover. This geometry-induced pressure drop is the engine that drives the Venturi meter.
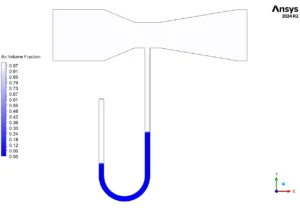
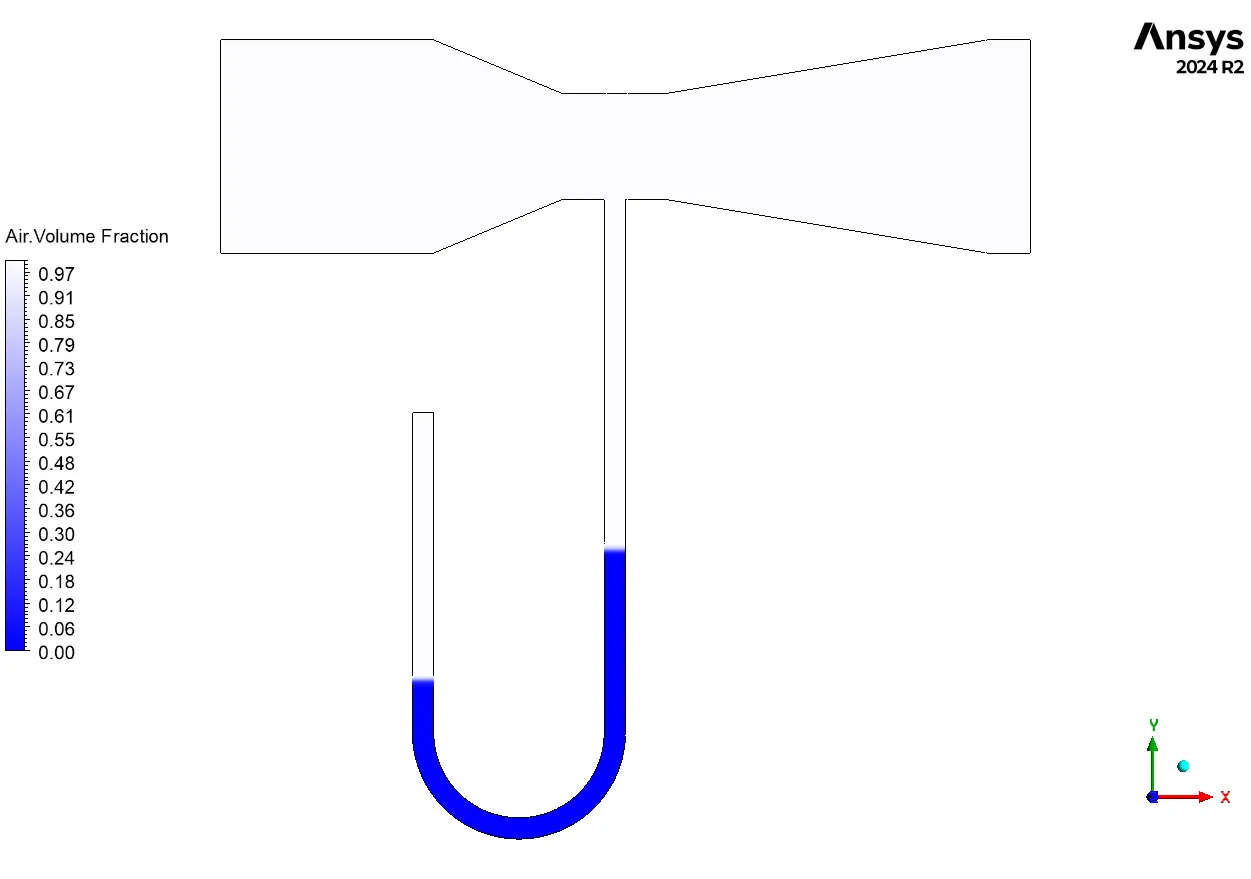
Figure 3 Air volume fraction showing the difference in water levels in the U-tube, a direct result of the Venturi Effect CFD
This predictable pressure drop has a direct and measurable effect on the U-tube manometer, which is visualized in Figure 3. The high pressure from the inlet pushes down on the left side of the manometer, while the low pressure from the throat is connected to the right side. This pressure difference creates an unbalanced force on the water in the U-tube. As a direct result, the water level on the left side is pushed down, and the level on the right side is pulled up, creating a clear difference in height. The simulation perfectly captures this fluid displacement, showing the interface between the blue water and white air. This height difference is not random; it is directly proportional to the pressure drop, which in turn is related to the flow rate of the fluid. The most significant achievement of this Venturi meter Fluent simulation is the direct visual validation it provides, linking the pressure drop caused by fluid acceleration in the throat directly to the measurable displacement of the manometer fluid, proving the Venturi tube’s fundamental principle as a reliable flow measurement device.
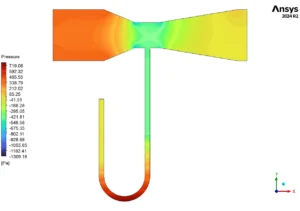
Figure 4: Pressure contour from the Venturi Tube CFD analysis, clearly showing the pressure drop in the throat section


Reviews
There are no reviews yet.