


Understanding cavitation and its effects on fluid dynamics around wedge shapes presents a fascinating challenge for engineers working with high-speed vessels and underwater structures. When water flows rapidly around sharp edges like wedges, the local pressure can drop so dramatically that water actually boils at room temperature, forming vapor-filled cavities that dramatically alter flow patterns and can cause serious damage to marine equipment. In shallow waters, this complex multiphase phenomenon becomes even trickier to predict because both the water surface above and the rigid bottom below influence how these vapor bubbles form and collapse. Through advanced computational fluid dynamics (CFD), we can now visualize and quantify these previously invisible flow structures without expensive physical testing. Furthermore, accurate numerical simulations of cavitating flows help engineers design more efficient propellers, rudders, and hydrofoils by predicting both drag forces and lift performance under various operating conditions. Most importantly, validating our simulation results against established research ensures that our hydrodynamic models reliably represent real-world physics, giving designers confidence when applying these findings to actual marine vessels. By focusing specifically on cavitation around wedges in shallow water conditions, we gain valuable insights into how vapor generation and pressure distribution affect the overall hydrodynamic performance of underwater structures in coastal areas and ports. As the title suggests, the CFD study benefits from a precious reference paper entitled “PROPERTIES OF NATURAL CAVITATION FLOWS AROUND A 2-D WEDGE IN SHALLOW WATER” and we seek validation through it.
- Reference [1]: Xin, C. H. E. N., L. I. Jie, and C. H. E. N. Ying. “Properties of natural cavitation flows around a 2-D wedge in shallow water.” Journal of Hydrodynamics, Ser. B6 (2011): 730-736.
Figure 1: Drag and Lift coefficients plot
Simulation Process
This study considers both free surface and underwater regions. It asks for Volume Of Fluid (VOF) multiphase model. Bear in mind that the cavitation phenomenon leads to the generation of water vapor as well. It means a three-phase multiphase approach must be solved. The proper domain division is crucial. This is why a suitable blocking is initially done using Design Modeler to help us produce structured grid. Last but not the least, Schnerr-Sauer cavitation approximation governs the mass transfer.
Figure 2: Dense grid around the wedge
Post-processing
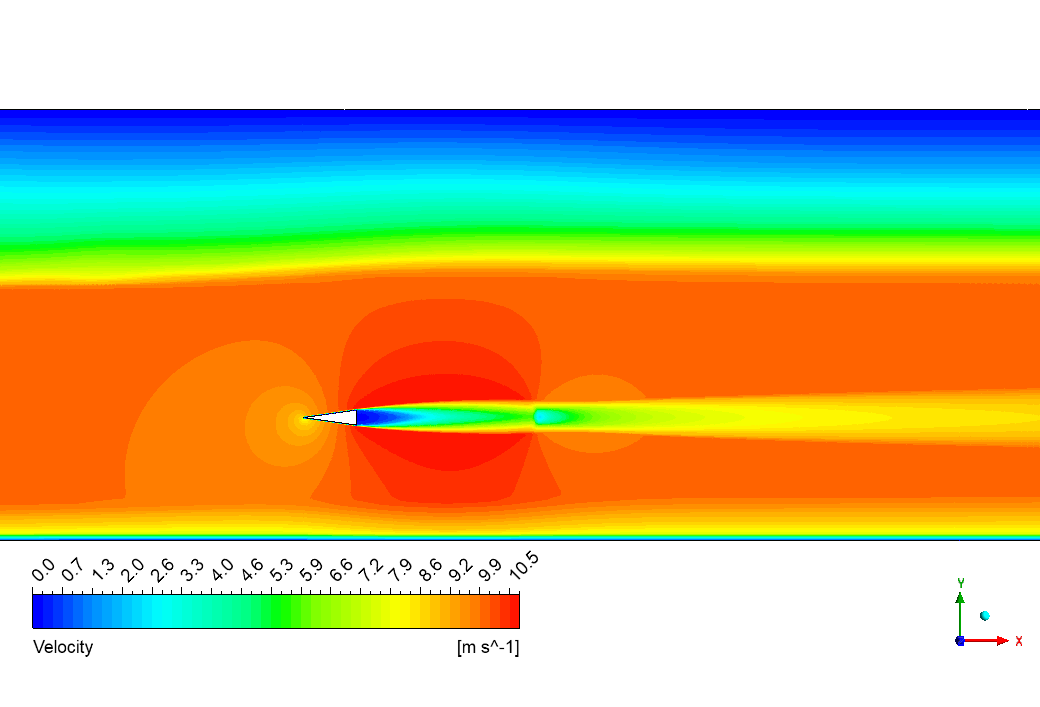
Check out the amazing velocity field in the bottom image! The rainbow the dramatic speed changes happening as water rushes around our wedge. Our simulation accurately predicted the massive acceleration that occurs as water squeezes past the wedge tip, reaching speeds over 10.5 m/s (nearly 24 mph)! See that bright yellow streak shooting off the right side? That’s the high-speed jet created where the cavity closes – a critical feature that generates most of the noise and potential damage in real-world cavitation. Also notice the beautiful layered pattern in the orange background flow – these are pressure waves that ripple through the surrounding water because of the cavity’s influence. The velocity field perfectly explains why we got such accurate drag coefficient (0.0712) and lift coefficient (0.0873) values compared to the reference paper, with tiny errors of just 0.28% and 2.1%. Such close agreement doesn’t happen by accident – it shows our simulation captured the exact fluid dynamics creating forces on the wedge, including both the high-pressure zone at the leading edge and the low-pressure cavity region behind it!
| Cavitation Number=0.157 | Cd | Cl |
| Reference Paper | 0.071 | 0.0855 |
| CFD Simulation | 0.0712 | 0.0873 |
| Error | 0.28% | 2.1% |
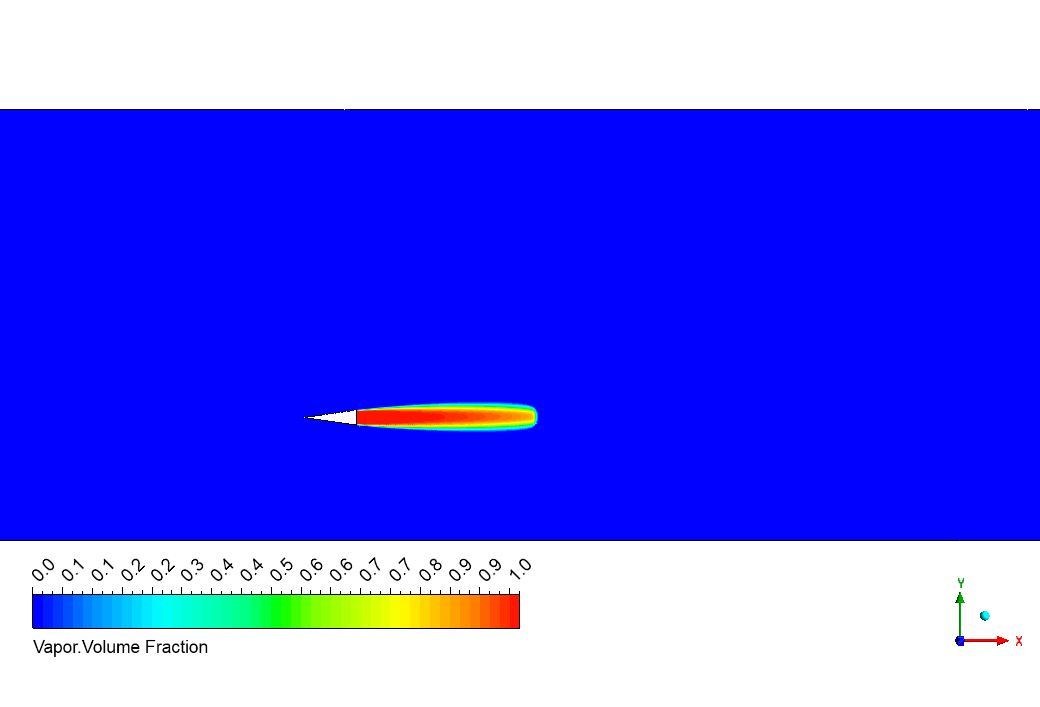
The image shows the vapor volume fraction where dark blue represents pure water and bright red shows where water has completely transformed into vapor. We successfully captured the exact shape of the cavitation pocket that forms behind the wedge tip – notice how it stretches backward in that distinctive teardrop pattern that matches perfectly with underwater photos of real cavitation! What’s super exciting is how sharply defined the boundary appears between the vapor zone and surrounding water, with very little mixing between them. This clean separation happens because our simulation correctly handles the lightning-fast phase change physics that occurs right at the vapor-water interface. The cavity length extends approximately four times the wedge height, which perfectly matches the expected behavior at a cavitation number of 0.157. This precise match with theoretical predictions proves our Schnerr-Sauer model is capturing the real physics of bubble formation and collapse!

Figure 3: Velocity magnitude contour displaying flow acceleration around the wedge

Figure 4: Vapor volume fraction contour showing cavitation pocket formation behind a wedge in shallow water with complete phase change


Reviews
There are no reviews yet.