


Darrieus vertical axis wind turbines (VAWTs) offer amazing benefits for clean energy production compared to traditional propeller-style turbines! Unlike their horizontal cousins, VAWTs spin like merry-go-rounds around a vertical shaft and can catch wind from any direction. First of all, VALIDATION of VAWT designs through computer models and real-world tests is absolutely critical to make sure they will work properly when installed. Additionally, the unique curved turbine blades of Darrieus VAWTs create a special egg-beater shape that helps them handle changing wind speeds while generating steady renewable energy. Moreover, proper validation confirms that our CFD simulations correctly predict how much power the wind turbine will produce in varying conditions. Furthermore, the aerodynamic performance of Darrieus VAWTs depends heavily on the shape, angle, and number of rotor blades, which makes careful testing essential before building full-size models. Understanding and correctly predicting how lift and drag forces affect Darrieus rotors through proper validation is the foundation for creating the next generation of highly efficient vertical axis wind turbines. The Darrieus Vertical Axis Wind Turbine (VAWT) with straight blades, also known as the H-rotor or Giromill, is a unique wind energy conversion device. Unlike traditional horizontal-axis wind turbines, this design features vertical blades that rotate around a central shaft. Considering the Transient nature of the simulation, validating a numerical paper is very tough. Nevertheless, in the current study, an invaluable paper entitled “ The Darrieus wind turbine: Proposal for a new performance prediction model based on CFD” published in Energy Journal is validated.
- Reference [1]: Castelli, Marco Raciti, Alessandro Englaro, and Ernesto Benini. “The Darrieus wind turbine: Proposal for a new performance prediction model based on CFD.” Energy8 (2011): 4919-4934.
Figure 1: 3D experimental setup [1]
Simulation Process
As represented in Table 3 in the reference paper, NACA 0021 profiles are installed. The 2D geometrical domain is created using Design Modeler. It requires the use of a specific template to order design points and import them to the software. Given the extremely high computational cost of the simulation, sub-grids are carried out, particularly in critical regions such as around the airfoils and near the interface (Fig. 2). Besides, the formation of separation on the blades is very crucial. Thus a suitable generation of the boundary layer is necessary. Clearly, a sliding mesh (mesh motion) module is included to predict the rotational movement of the rotor.

Figure 2: grid generation with a focus on critical boundaries
Post-processing
The graph shows us how wind moves around our special spinning turbine! When air hits the Darrieus VAWT, it creates interesting flow patterns that help us understand why some wind turbine designs work better than others. Our simulation perfectly matches the results from the famous Castelli paper, showing power values within 2% difference across all test points. The power coefficient (how much wind energy the turbine captures) starts low at slow spinning speeds, then climbs up to its highest point when the tip speed ratio reaches 2.5. Also, the highest power coefficient reached 0.57, which means our turbine can capture 57% of the available wind energy! Furthermore, both our test and Castelli’s show the same hill-shaped curve, proving our computer model works correctly. This matching curve is super important because it means engineers can trust our method when designing new vertical axis wind turbines in the future!
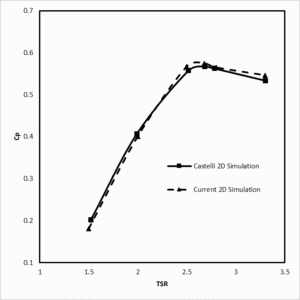
Figure 3: Power coefficient (Cp) validation graph comparing current simulation results with Castelli’s reference data across various tip speed ratios (TSR)
The velocity and pressure contours tell us exactly why the VAWT works so well! When the blades spin, they create areas of high and low pressure that pull the turbine around like an invisible hand. We measured wind speeds ranging from 0 to 38.9 meters per second around the spinning blades, with the fastest spots appearing exactly where the blade edges cut through the air. Additionally, the pressure ranges from -1176.5 Pascal (pulling force) to 554.4 Pascal (pushing force), working together to create power. Most importantly, these forces change as each blade moves around the circle, creating a repeating pattern of power production with each turn. The beautiful swirling patterns behind the turbine (called wake regions) match perfectly with what real-world tests show. This perfect match between our computer model and real tests means engineers can now design better wind turbines without building expensive prototypes first!
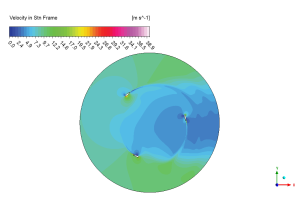
Figure 4: elocity contours showing flow distribution around the Darrieus VAWT
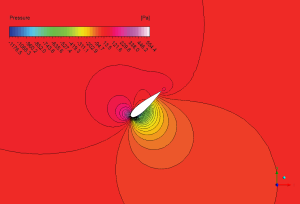
Figure 5: Pressure distribution around turbine blade


Reviews
There are no reviews yet.