
When fast-moving air flows over an open box or cavity, like a car’s sunroof or an airplane’s wheel well, it can create a strong, loud noise and powerful vibrations. This is called flow-induced oscillation. A Flow-Induced Oscillation In Rectangular Cavity CFD simulation is a key tool that helps engineers understand this problem. These oscillations are caused by an unstable layer of air, called a shear layer, which forms at the opening of the cavity. A Flow-Induced Oscillation In Rectangular Cavity Fluent simulation lets us see how this shear layer creates spinning air (vortices) that produce noise, a field known as aeroacoustics. This unsteady CFD analysis helps us design quieter and safer vehicles. Our study is based on the methods in the trusted research paper, “Numerical Identification of Flow-Induced Oscillation Modes in Rectangular Cavities using URANS” [1].
- Reference [1]: Mesbah, M., and S. Majidi. “Numerical identification of flow-induced oscillation modes in rectangular cavities using urans.” Journal of Applied Fluid Mechanics2 (2020): 703-713.
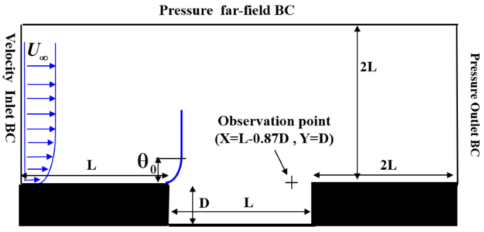
Figure 1: The computation domain for the Flow-Induced Oscillation CFD study, as shown in the reference paper [1].
Simulation Process: Fluent Setup, URANS Modeling for Cavity Flow Dynamics
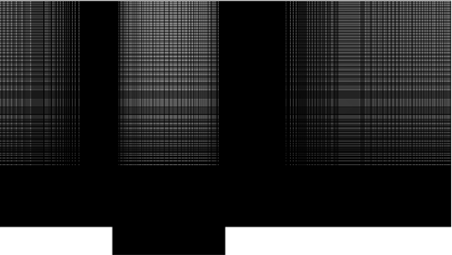
For our Flow-Induced Oscillation CFD study, we first created a 2D model of the rectangular cavity. The cavity has a length-to-depth ratio (L/D) of 4. Using ANSYS Meshing, we made a structured grid with 290,500 cells, adding more cells near the walls to get accurate results. Because this problem involves fast-moving air and changing flow, we performed an unsteady simulation using the URANS (Unsteady Reynolds-Averaged Navier-Stokes) approach. We also used the Transition SST 4-equation turbulence model, which is very good for this type of flow.
Figure 2: The structured grid for the Rectangular Cavity Fluent simulation, with a denser mesh near the critical regions.
Post-processing: CFD Analysis, Visualizing the Self-Sustaining Oscillation Mechanism
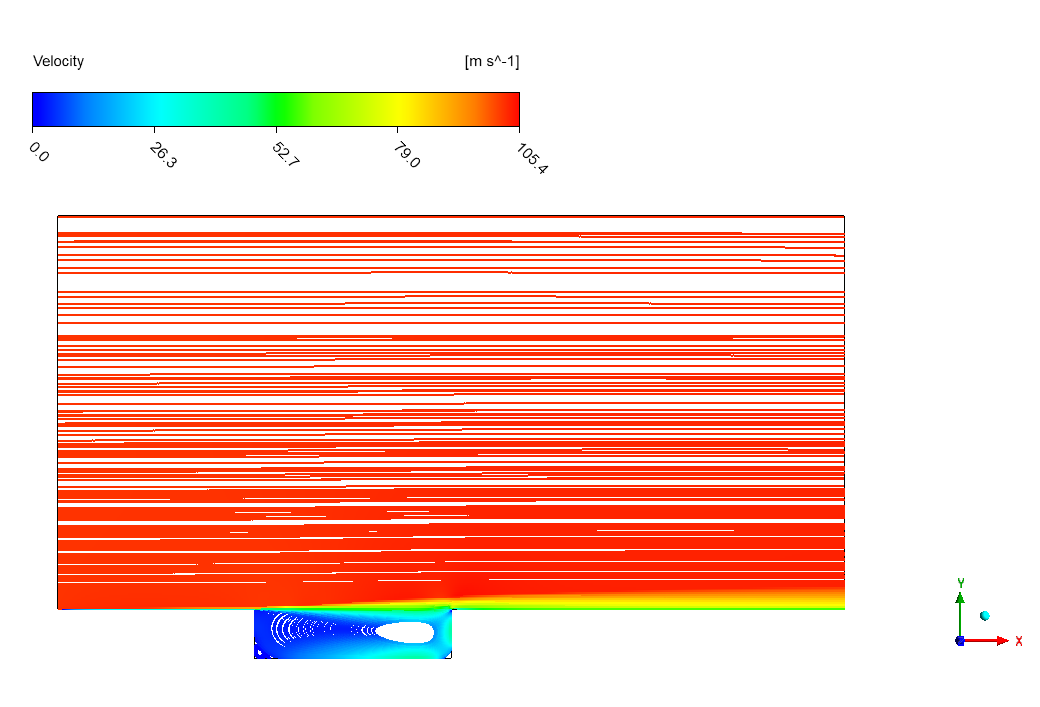
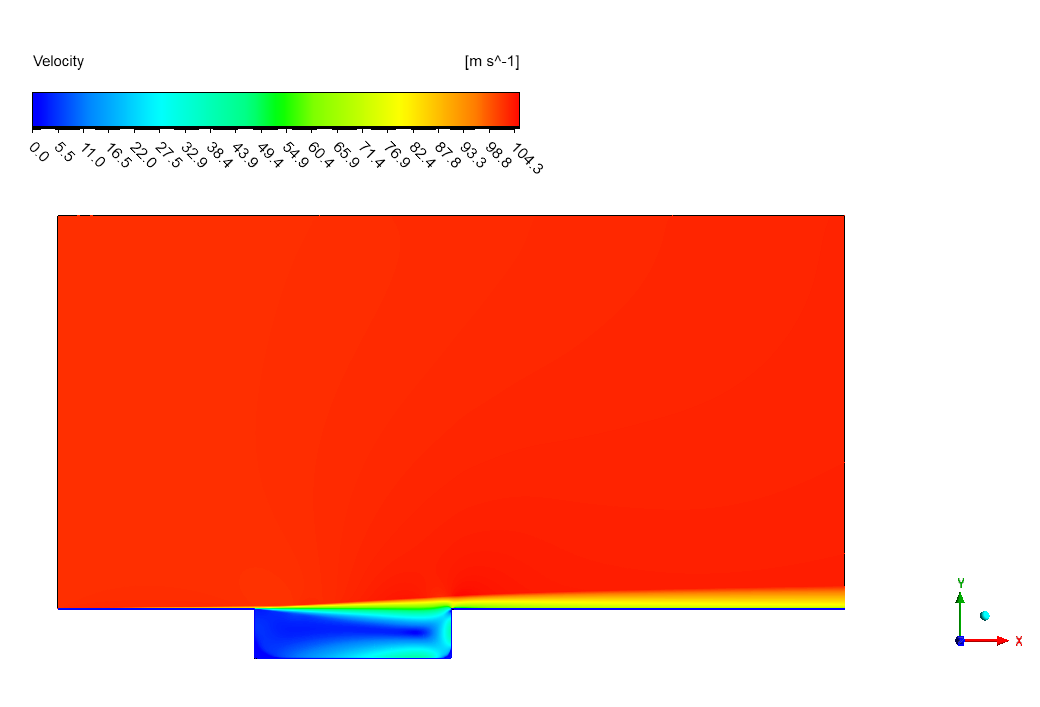
The velocity contour provides a professional visual that shows exactly how the spinning motion begins. When the fast air stream, moving at up to 105.4 m/s, flows over the cavity opening, it creates a very unstable shear layer. This layer rolls up into a large, spinning vortex inside the cavity. This professional visual clearly shows this main vortex, which drags the slower air inside the cavity into its circular motion. This spinning vortex is not still; it moves and grows as it travels across the cavity opening. When it hits the back wall of the cavity, it creates a pressure wave. This is the first part of the feedback loop that causes the loud noise.
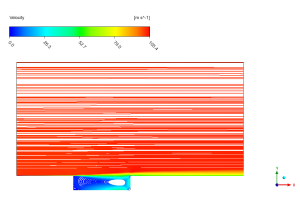
Figure 3: Velocity distribution from the Flow-Induced Oscillation CFD analysis, showing the main vortex and the shear layer.
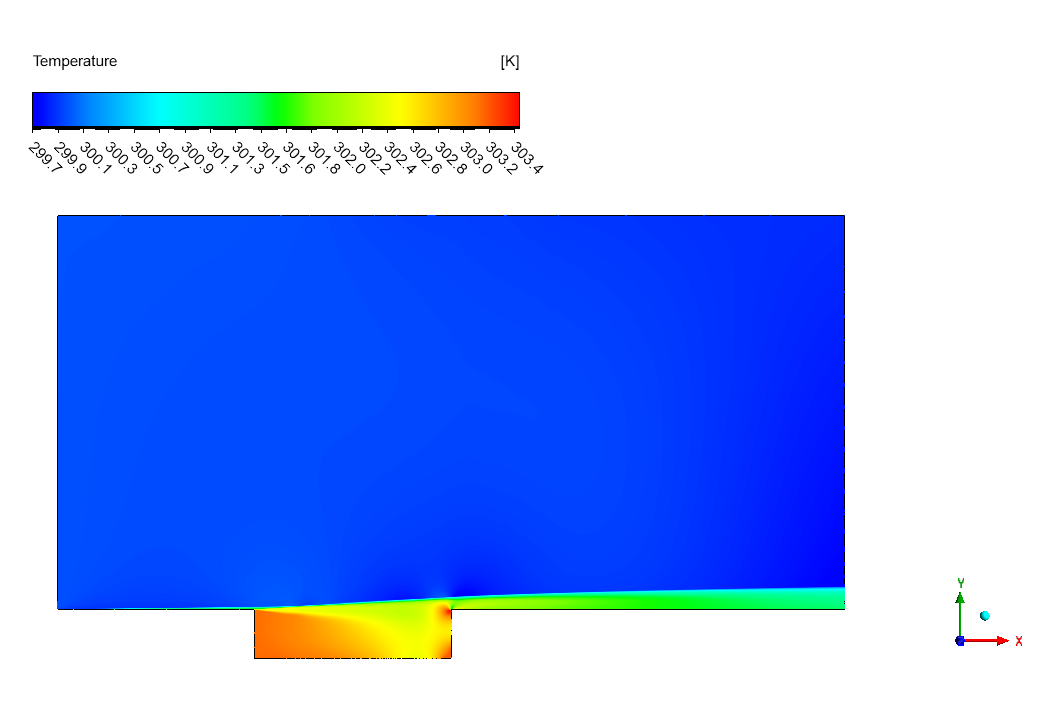
The temperature contour tells the rest of the story and confirms our understanding of the flow. The professional visual shows how the large vortex mixes the hot and cold air. We can see a temperature difference of 63 Kelvin, with temperatures ranging from 280 K to 343 K. The hot air from the main flow is pulled down into the cavity by the spinning vortex. This mixing, combined with the pressure wave created when the vortex hits the back wall, creates the strong and repeating oscillations. This pressure wave travels back to the front of the cavity and starts a new vortex, creating a cycle. The most important achievement of this simulation is the successful capture of this complete feedback loop—where the shear layer creates a vortex, the vortex creates a pressure wave, and the pressure wave creates a new vortex—which is the fundamental cause of self-sustaining oscillations and noise in rectangular cavities.

Figure 4: Temperature distribution from the Flow-Induced Oscillation Fluent simulation, confirming the mixing caused by the vortex.


Reviews
There are no reviews yet.