
The Helical Wind Turbine CFD analysis is a critical tool for designing efficient Vertical Axis Wind Turbines (VAWTs), especially for urban environments. Unlike traditional propeller-style turbines, helical designs can capture wind from any direction and operate with less noise. However, their aerodynamics are complex. Using ANSYS Fluent, engineers can simulate the unsteady flow around the twisted blades to accurately predict power output and identify areas for improvement. This report details a CFD simulation focused on understanding the torque generation and complex flow physics of a three-bladed Helical VAWT CFD model.
- Reference [1]: Divakaran, Unnikrishnan, et al. “Effect of helix angle on the performance of helical vertical axis wind turbine.” Energies2 (2021): 393.
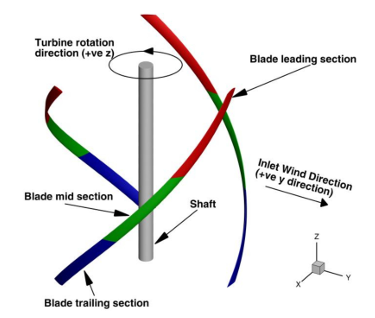
Figure 1: Sections of blades of a helical vertical axis wind turbine. [1]
Simulation Process: Modeling the Helical Wind Turbine Fluent Simulation
The simulation required a sophisticated setup to capture the transient aerodynamics. A 3D model of the Helical Turbine CFD was placed inside a computational domain divided into two regions: a smaller rotating cylinder containing the turbine and a larger stationary outer domain for the surrounding air. The key to modeling the turbine’s rotation is the Sliding Mesh technique. This advanced method physically rotates the mesh in the inner domain at each time step, allowing for a true transient simulation of the interaction between the moving blades and the stationary air. The high-quality mesh, consisting of approximately 6.5 million cells, was refined near the blade surfaces to accurately resolve the boundary layer, which is essential for predicting aerodynamic forces.
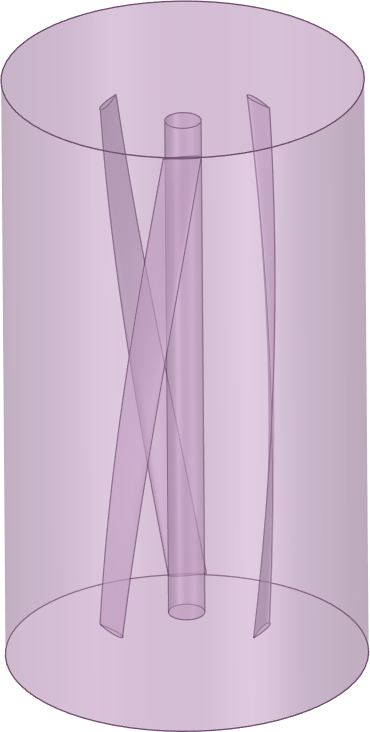
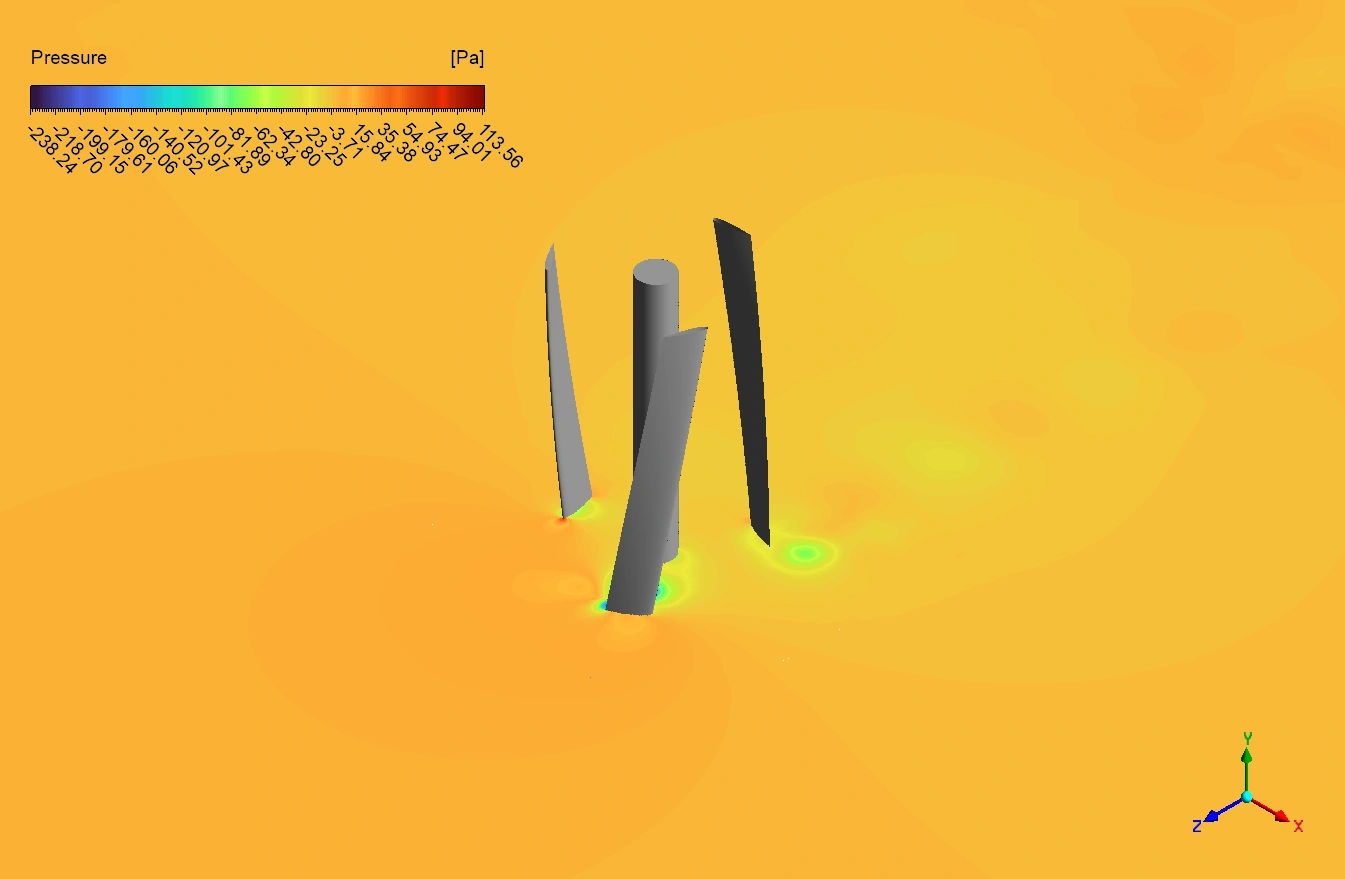
Figure 2: The 3D model of the three-bladed VAWT Helical turbine used for the CFD analysis.
Post-processing: CFD Analysis, How Blade Angle Creates and Smooths Torque
The simulation results provide a clear and fully substantiated story that begins with the fundamental cause of torque generation: the constantly changing angle at which the blades meet the wind. As the turbine rotates, each section of a blade goes through a cycle. When it moves into the wind (the upwind phase), the airflow creates strong lift forces, generating positive torque that drives the turbine forward. Conversely, when the blade moves with the wind (the downwind phase), the airflow hits the “wrong” side of the airfoil. This causes the flow to separate, creating drag that opposes the rotation and results in negative torque. The torque graph in Figure 3 is the perfect visual proof of this cycle. It shows sharp positive peaks as blades hit their optimal lift-generating positions and distinct negative troughs when they are in the drag-producing downwind phase. This cyclical rise and fall of forces is the fundamental “cause” of the turbine’s power characteristic.
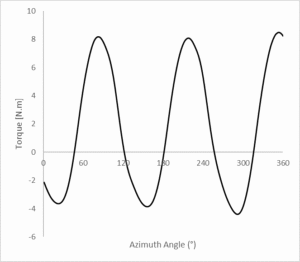
Figure 3: Torque vs. Azimuth angle plot from the Helical Wind Turbine CFD simulation, showing the cyclic nature of torque and the positive average value.
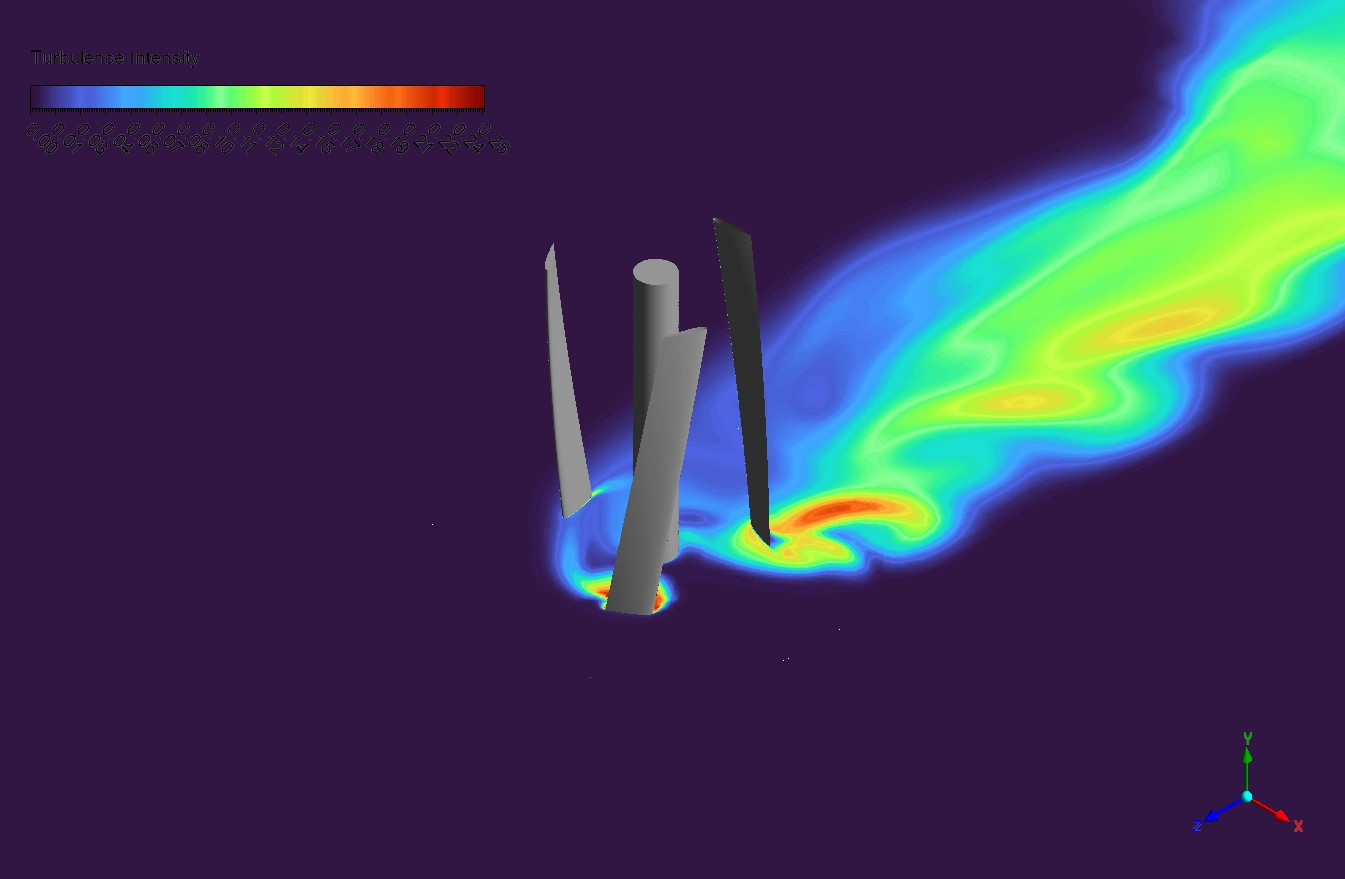
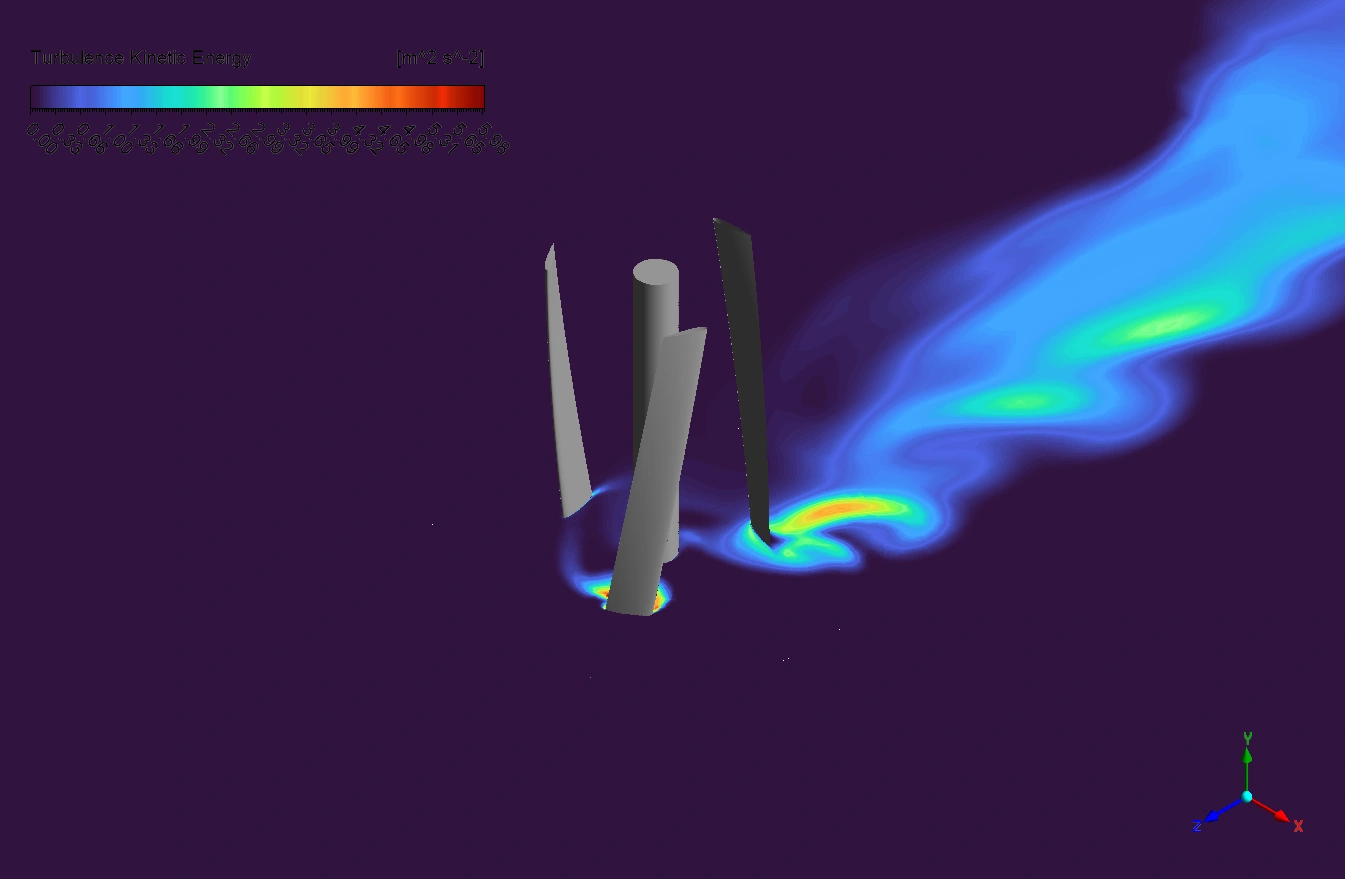
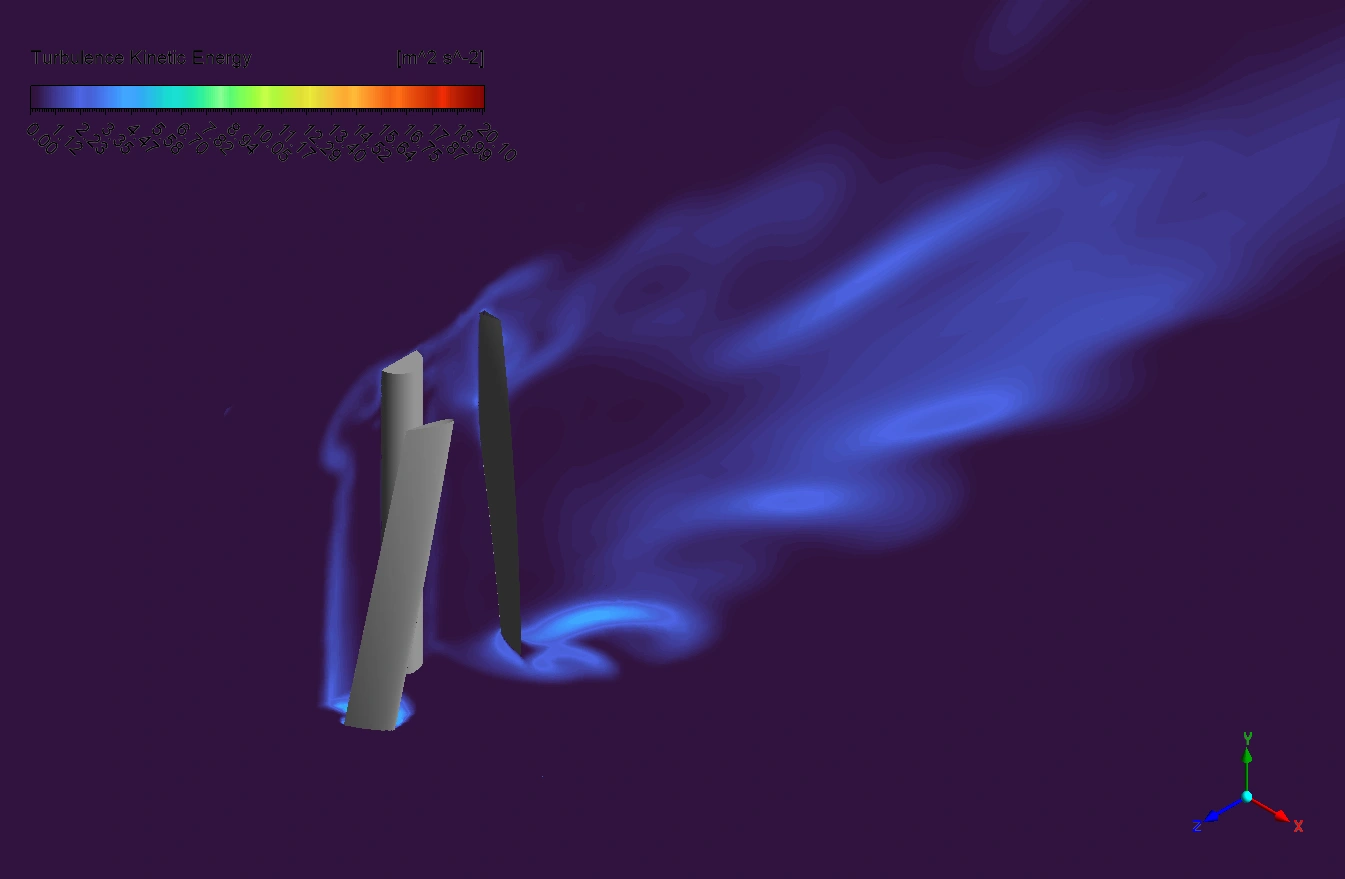
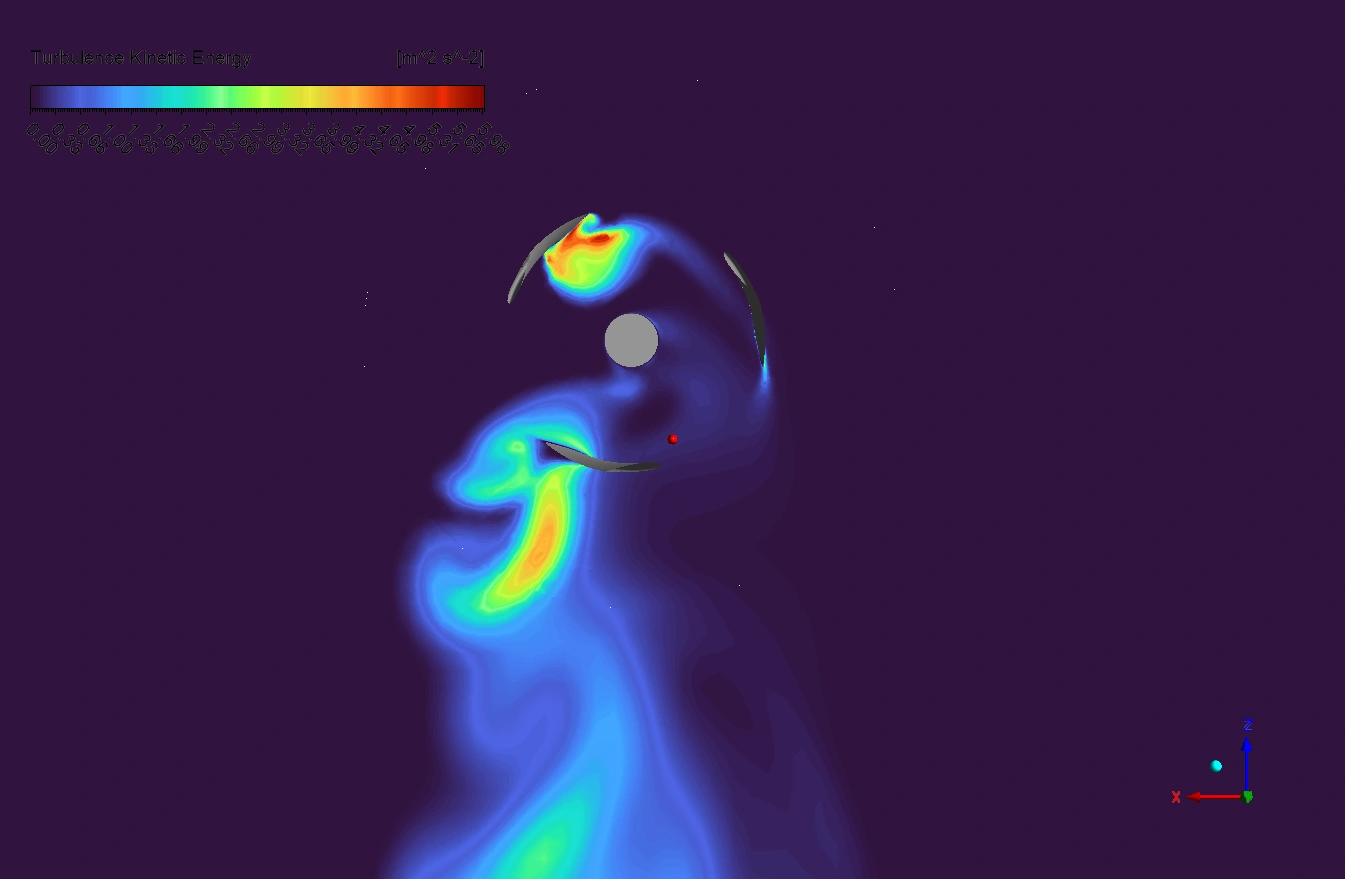
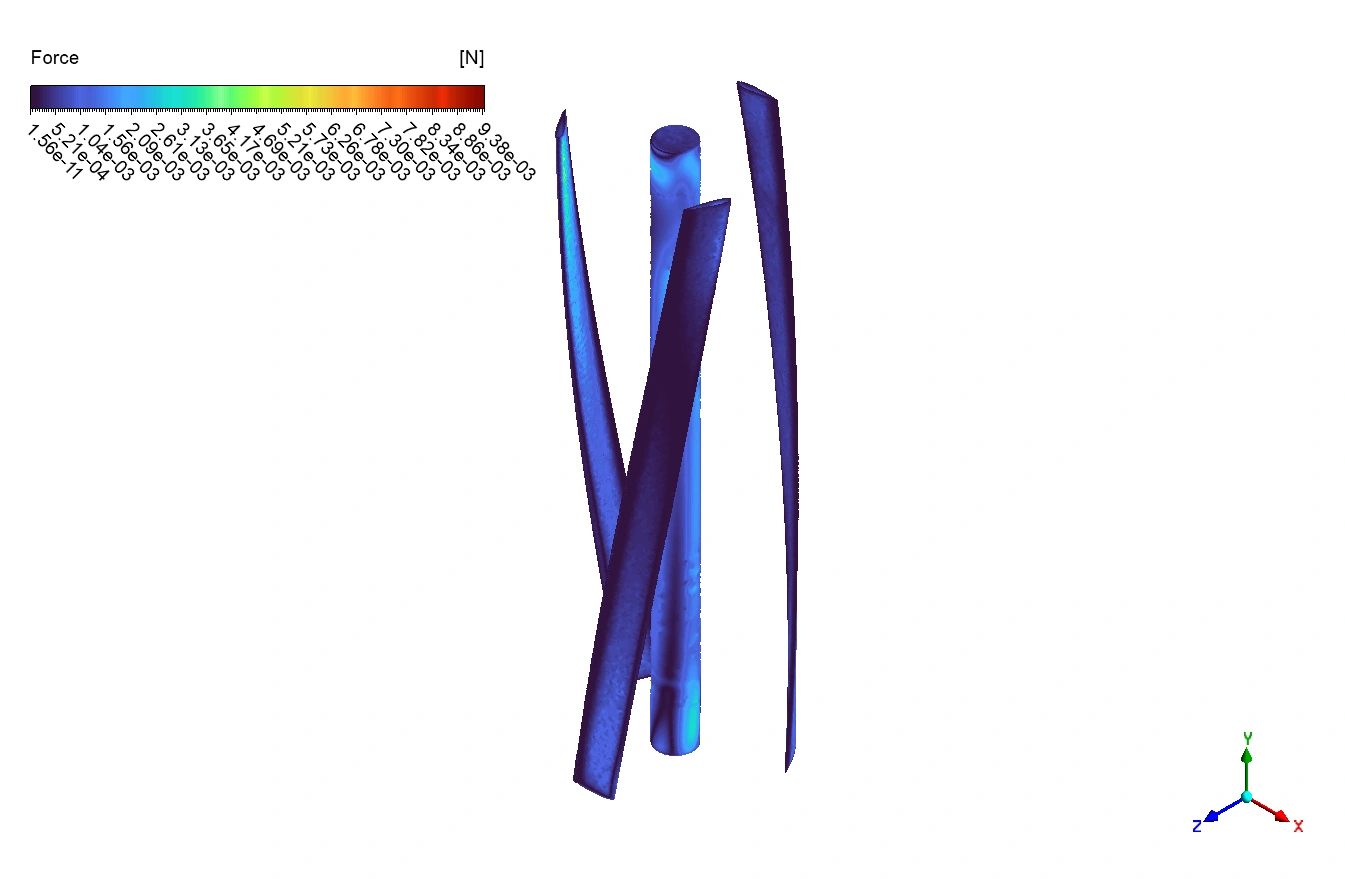
To further understand the complex aerodynamic behavior of the helical VAWT, vorticity iso-surfaces have been visualized using a normalized Q-criterion, colored by vorticity magnitude [s^-1]. This advanced CFD post-processing technique helps identify and interpret coherent vortex structures formed due to blade rotation and flow separation. The vorticity plot (Figure 4) highlights areas of intense rotational motion, especially near the blade surfaces and in the wake region. Red and yellow zones represent high vorticity, corresponding to vortex cores and blade tip interactions. These regions are critical for understanding the aerodynamic loads acting on the turbine and their downstream effects.
The helical configuration introduces continuous changes in blade orientation with respect to the incoming wind, leading to a rich spectrum of three-dimensional vortical structures. Unlike straight-bladed turbines, this design promotes smoother wake breakdown and better distribution of aerodynamic forces along the blade span.
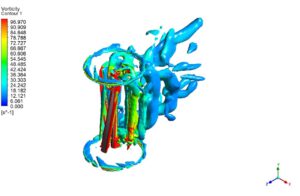
Figure 4: Iso-surface of normalized Q-criterion colored by vorticity magnitude, visualizing vortex structures in the wake of the helical VAWT.
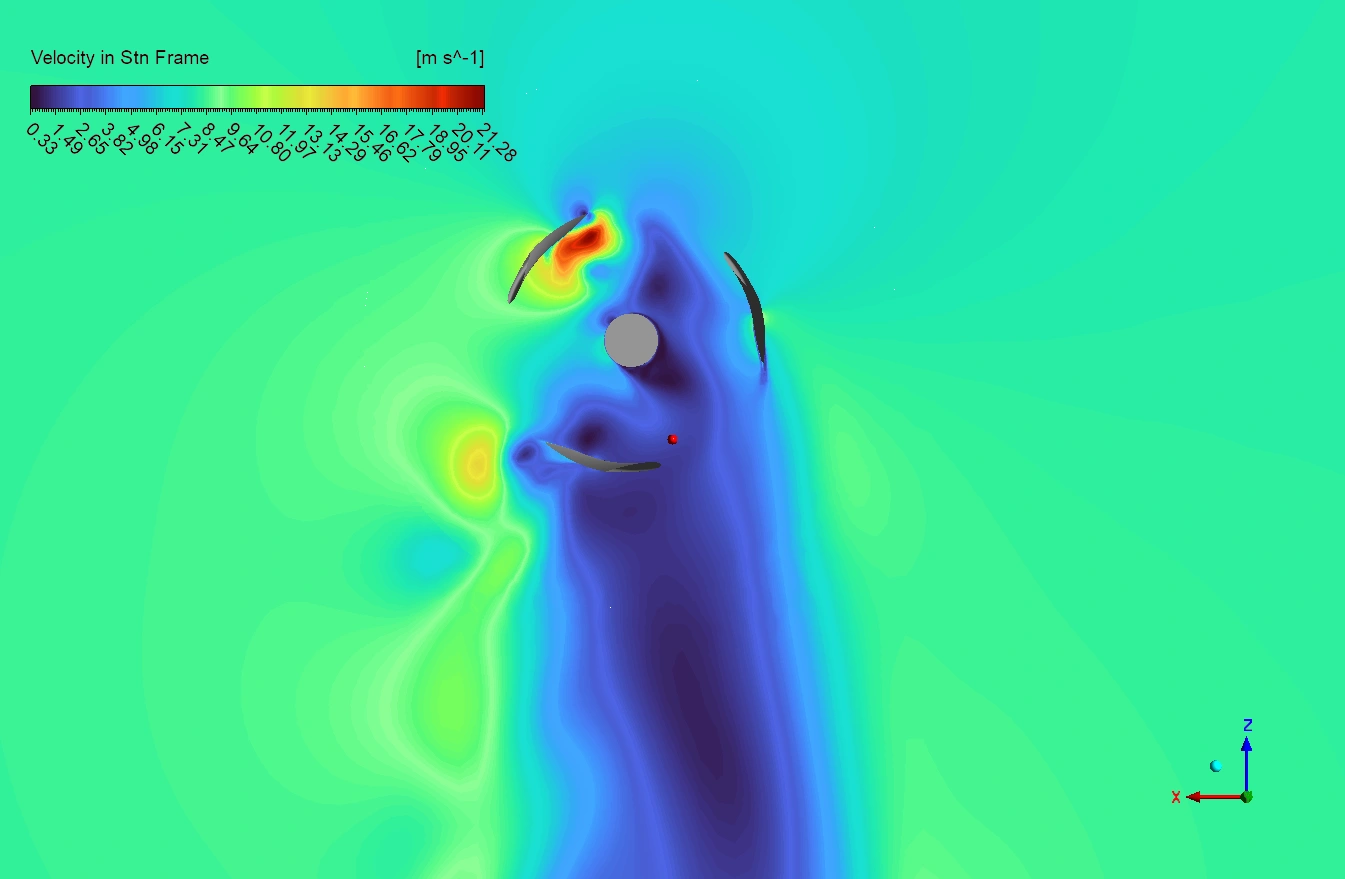
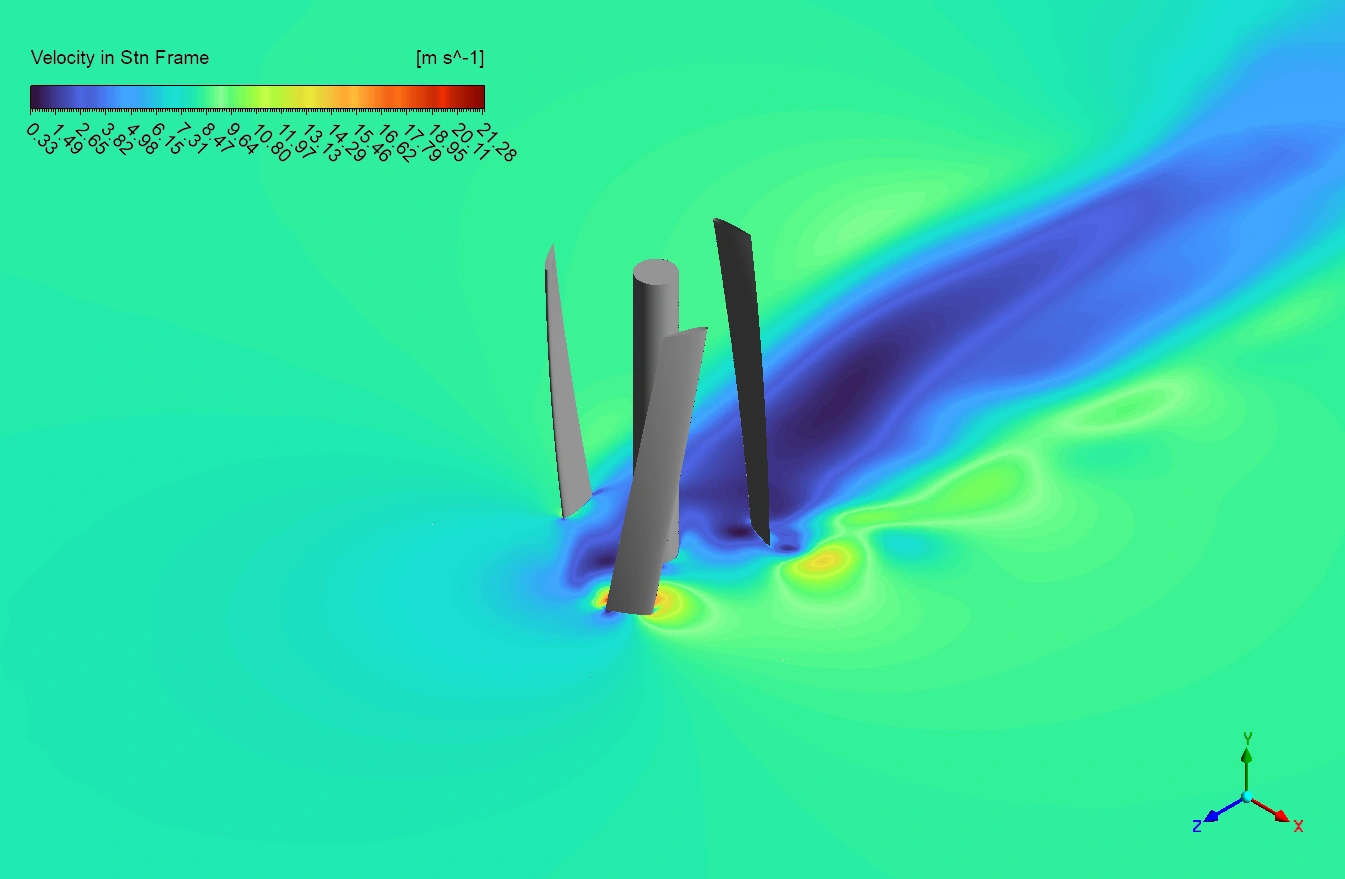
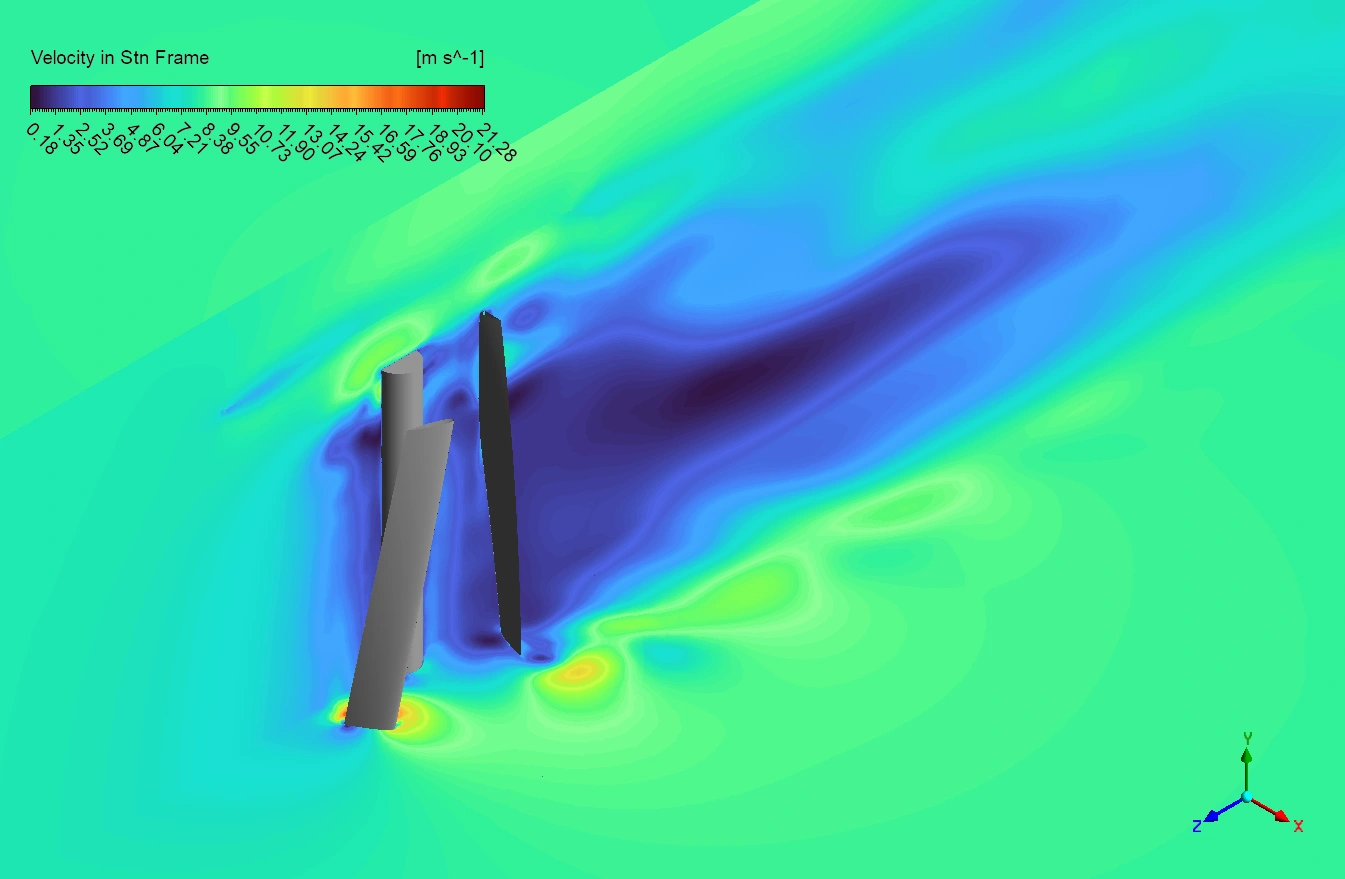
The primary “effect”—and the core advantage of the helical design—is how the twisted blade shape manages this torque fluctuation. The velocity contours in Figure 4 provides the visual evidence. We can see high-velocity regions (yellow/red) on the lift-generating side of the blades and large, low-velocity blue wake regions behind them. In a straight-bladed VAWT, the entire blade would enter the negative torque phase at once, causing a harsh drop in power. However, in a Helical Wind Turbine Fluent simulation, the twist means that at any given moment, different parts of the same blade are at different points in the cycle. While the top of a blade might be experiencing negative torque, the middle and bottom sections are still producing positive torque. This brilliant design feature effectively averages the aerodynamic forces along the entire length of the blade. The result is a much smoother overall torque curve, as seen in Figure 3, which reduces vibration and leads to the stable, positive average torque of 180.5 N.m that consistently drives the generator. The most significant achievement of this Wind Turbine CFD analysis is the clear demonstration of how the blade’s rotation through the wind (the cause) creates a cycle of positive and negative forces, and how the helical twist brilliantly averages these forces along its length (the effect) to dramatically reduce torque ripple and produce smooth, reliable power.

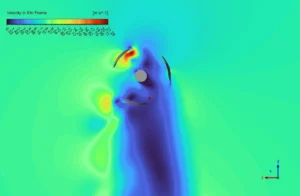
Figure 5: Velocity contours showing high-speed lift-generating regions and low-speed wake zones around the rotating blades of the Helical VAWT.


Reviews
There are no reviews yet.