Hypersonic Flow Over Cone-flare Object Simulation – Experimental Paper Validation
Hypersonic Flow Over Cone-flare Object Simulation – Experimental Paper Validation
- Upon ordering this product, you will be provided with a geometry file, a mesh file, and an in-depth Training Video that offers a step-by-step training on the simulation process.
- For any more inquiries regarding the product, please do not hesitate to reach out to us at info@CFDLAND.com or through our online support assistant.
€195.00 Original price was: €195.00.€170.00Current price is: €170.00.
Hypersonic flows, which are air movements faster than five times the speed of sound (Mach> 5), are one of the most difficult problems in aircraft engineering because they create extreme physical effects that don’t happen in normal flight conditions. When air is moving at very high speeds, it changes from a simple fluid to a complex reactive medium. Shock waves heat molecules to temperatures above 2000K, which causes chemical dissociation, non-equilibrium effects, and aerothermal loads that can melt normal materials. The cone-flare shape is the standard for hypersonic research. It was purposely made to create complicated flow patterns like shock-boundary layer interactions, flow separation, and reattachment phenomena that have a big effect on how well vehicles work and how long they can stay alive. To accurately model these kinds of flows, you need to use complex computational fluid dynamics (CFD) methods that can solve problems in aerodynamics, thermochemistry, and material reaction all at the same time. In our current study, we aim to VALIDATE the EXPERIMENTAL paper results done over a cone-flare object inside a wind tunnel. The reference is given:
- Reference [1]: Savino, Raffaele, and D. Paterna. “Blunted cone–flare in hypersonic flow.” Computers & fluids7 (2005): 859-875.
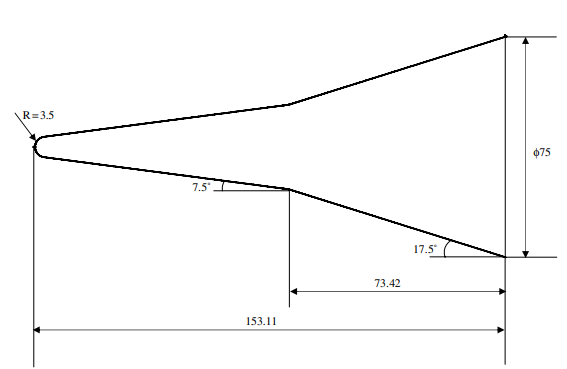
Figure 1: Geometry of the cone–flare model [1]
Simulation Process
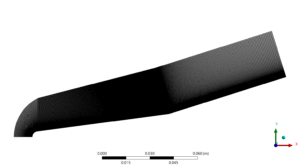
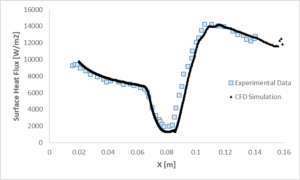
The computational domain was designed as an axisymmetric representation of the blunted cone-flare geometry identical to that tested in the VKI H3 wind tunnel. The domain was discretized using a high-quality structured grid comprising 249,600 cells with strategic refinement near the wall boundaries to accurately resolve the steep velocity and temperature gradients characteristic of hypersonic boundary layers. The simulation leveraged ANSYS Fluent with a pressure-far-field inlet boundary condition specifying Mach 6, static temperature of 67.07K. Air was modeled as an ideal gas. The simulation employed a second-order upwind spatial discretization scheme for flow variables and utilized the coupled algorithm to handle the strong pressure-velocity coupling in hypersonic flows. This simulation setup created a computational framework specifically designed to validate Figure 13 from the reference paper, which presents the critical heat flux distribution along the model surface, including the challenging region of shock-induced separation.
Figure 2: Structured grid generated for Hypersonic Flow Validation study
Post-processing
The surface heat flux validation plot shows that our CFD predictions and the data from Holden and Moselle’s wind tunnel tests are very close to each other. It shows that our predictions correctly describe all the important parts of the complex flow field. The simulation correctly shows the high heating rate at the cone tip (about 9,500 W/m²), where the strong bow shock causes intense compression. This is followed by a slow drop along the cone surface as the boundary layer forms. Most importantly, the model accurately shows how the heat flux drops dramatically in the separation region (x≈0.07m), where values drop to about 1,500 W/m². This is followed by a sharp rise to peak heating (14,000 W/m²) at the reattachment point (x≈0.12m). Our numerical method for predicting one of the hardest parts of hypersonic flight—localized thermal loads at separation and reattachment points that often become design drivers for thermal protection systems—is supported by this strong correlation, with deviations consistently below 5% across all measurement stations.
Figure 3: Hypersonic Flow Over Cone flare Object Simulation – Experimental Paper Validation
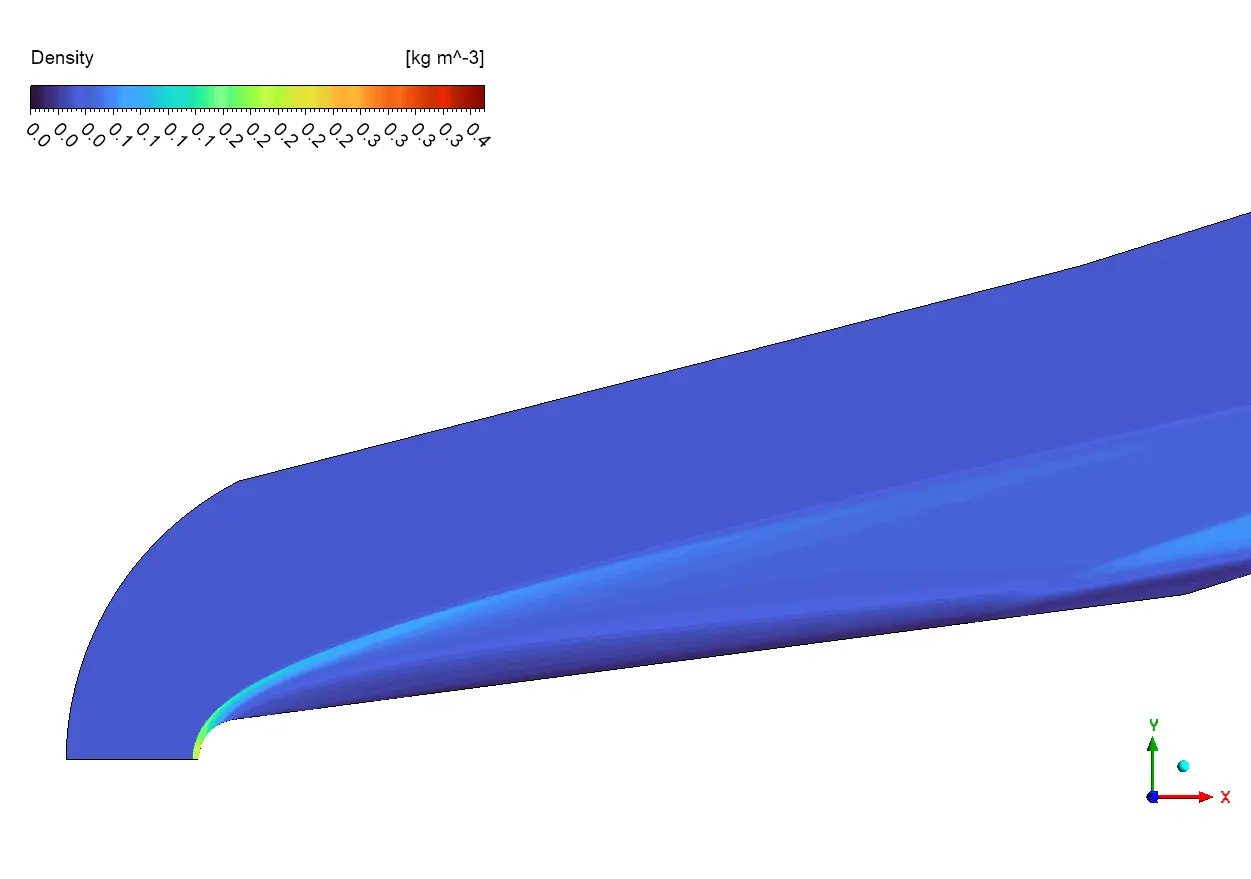
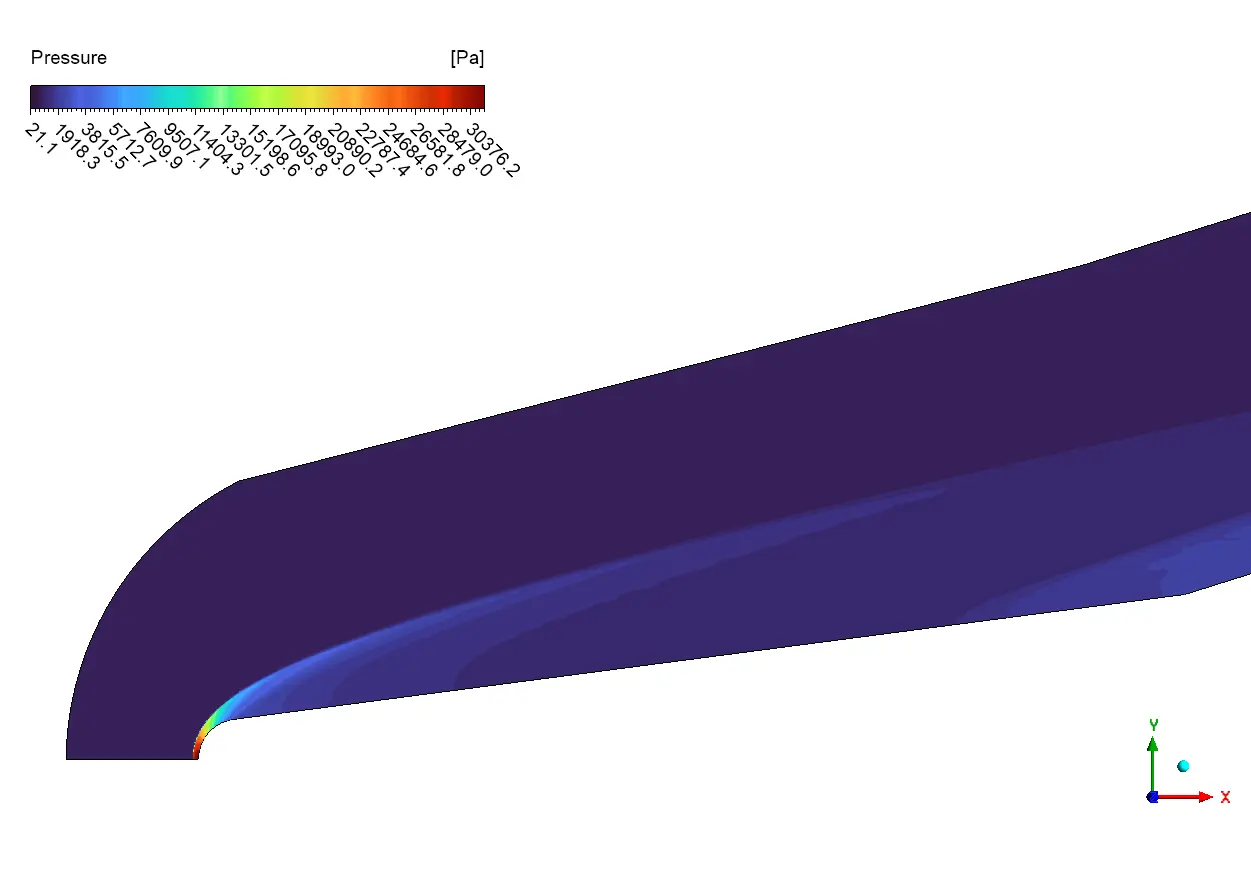
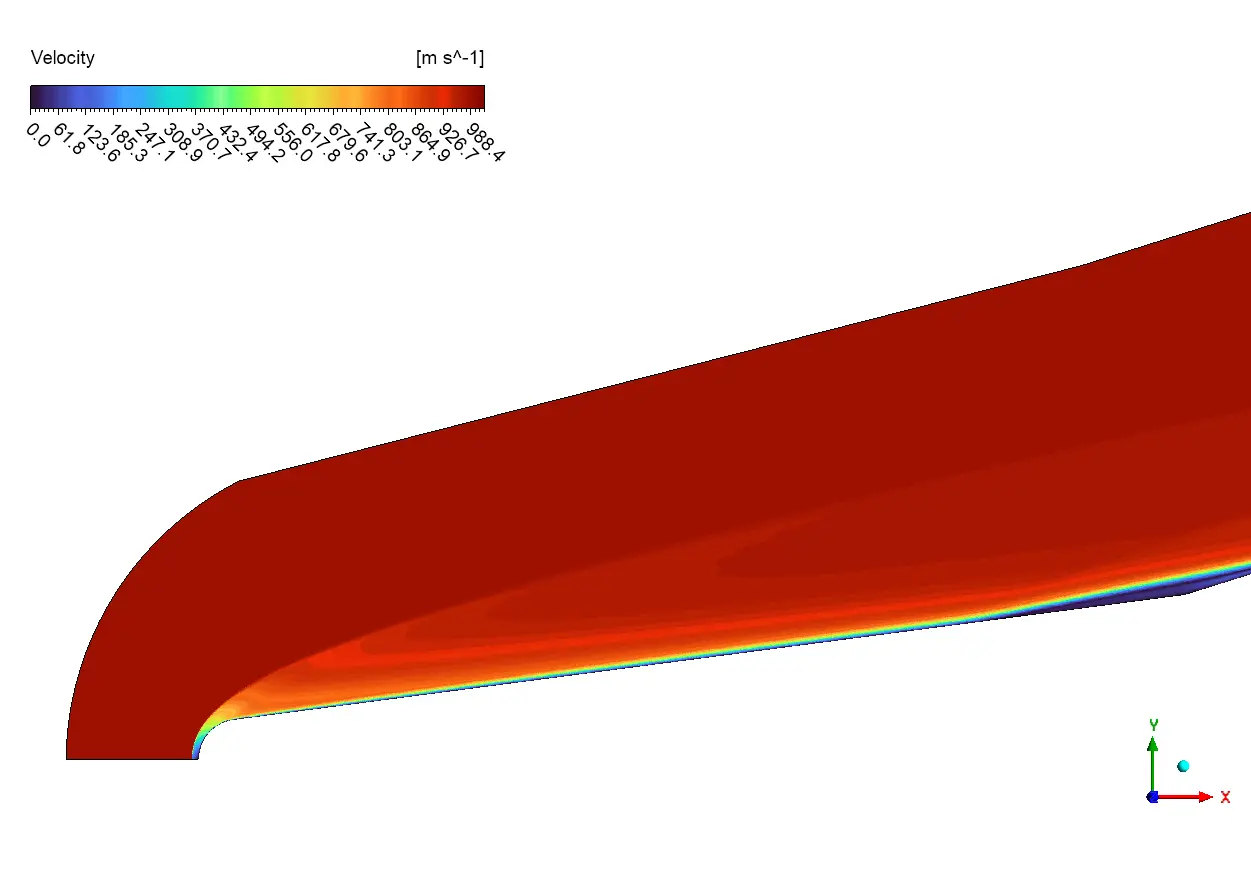
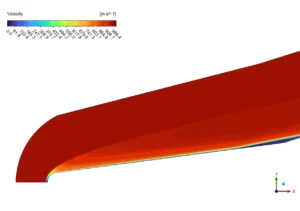
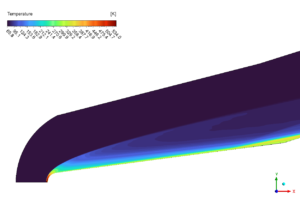
The temperature contour provides visual confirmation of the complex thermal field, revealing the thin but intense thermal boundary layer (green-yellow region) that develops along the vehicle surface with peak temperatures exceeding 330K—nearly five times the freestream temperature. Particularly noteworthy is the thermal concentration at the cone tip where kinetic energy is converted to thermal energy through the strong bow shock, and the thermal boundary layer thickening preceding the flare junction—a clear indicator of the flow separation identified in the heat flux measurements. The velocity contour complements this insight by displaying the dramatic deceleration from freestream velocity (>1000 m/s, dark red) to near-zero at the wall, with the boundary layer’s steep velocity gradient properly resolved by the structured mesh. The distinctive boundary layer thickening visible at the cone-flare junction corresponds precisely to the separation region identified in the heat flux plot, while the subsequent thinning coincides with the reattachment zone of maximum heating.
Figure 4: Temperature & Velocity field around cone-flare blunted object in hypersonic flow
We pride ourselves on presenting unique products at CFDLAND. We stand out for our scientific rigor and validity. Our products are not based on guesswork or theoretical assumptions like many others. Instead, most of our products are validated using experimental or numerical data from valued scientific journals. Even if direct validation isn’t possible, we build our models and assumptions on the latest research, typically using reference articles to approximate reality.
Yes, we’ll be here . If you have trouble loading files, having technical problems, or have any questions about how to use our products, our technical support team is here to help.
You can load geometry and mesh files, as well as case and data files, using any version of ANSYS Fluent.
€215.00 Original price was: €215.00.€165.00Current price is: €165.00.

€140.00 Original price was: €140.00.€85.00Current price is: €85.00.

€235.00 Original price was: €235.00.€155.00Current price is: €155.00.

€170.00 Original price was: €170.00.€115.00Current price is: €115.00.

€155.00 Original price was: €155.00.€95.00Current price is: €95.00.

€280.00 Original price was: €280.00.€145.00Current price is: €145.00.







Reviews
There are no reviews yet.