


A parabolic trough solar collector is a highly effective form of Concentrated Solar Power (CSP). The system uses a long, curved mirror shaped like a trough to reflect sunlight. It directs this light onto a specific receiver tube that runs along the focal line of the trough. Inside this tube, a fluid absorbs the concentrated heat. This heated fluid is then used to generate steam, which drives a turbine to produce electricity. These collectors are very popular in large-scale power plants because they are reliable and efficient.
In this Parabolic Trough Solar Collector CFD project, we focus specifically on the performance of the collector itself. To make the simulation realistic, we study the effect of “non-uniform heat flux.” This means the heat from the sun is not spread evenly but is concentrated in specific areas. We utilize the research paper by Wang et al. (2015) as a reference for our settings. For more advanced examples and resources on this topic, you can explore our Renewable Energy CFD Simulation category. This tutorial demonstrates how to model these complex thermal conditions using ANSYS Fluent.

Figure 1 – Schematic of the parabolic solar trough collector geometry.
- Reference [1]: Wang, Yanjuan, et al. “Performance analysis of a parabolic trough solar collector with non-uniform solar flux conditions.” International Journal of Heat and Mass Transfer82 (2015): 236-249.
- Reference [2]: Wang, Jinping, et al. “Performance simulation comparison for parabolic trough solar collectors in China.” International Journal of Photoenergy1 (2016): 9260943.
Simulation Process: UDF Implementation and Radiation Modeling
To start this CFD analysis, we must accurately represent the solar radiation. Since the focus is on the collector, we do not model the entire power plant. Instead, we need to apply a non-linear heat flux to the bottom surface of the absorber tube. Standard software settings cannot easily do this. Therefore, we use a User-Defined Function (UDF). This script mathematically defines the irradiation profile shown in Figure 2, ensuring the heat input matches the real reflection from a parabolic mirror.
Furthermore, accurately calculating how heat travels through the air and glass is essential. To achieve this, we activated the Discrete Ordinates (DO) radiation model in ANSYS Fluent. This model is specifically designed to solve the radiative transfer equation for solar applications, allowing us to predict the temperature distribution with high precision.
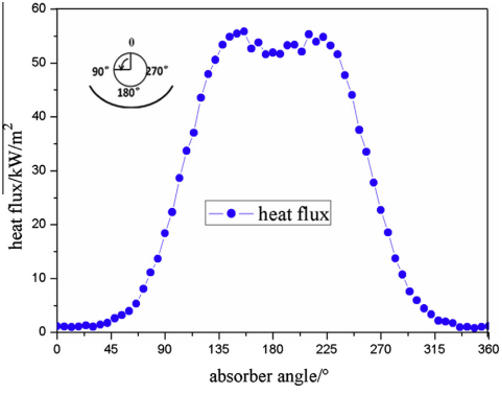
Figure 2- Irradiation profile showing the non-uniform heat flux on the absorber surface.
Post-processing: Thermal and Hydraulic Performance Analysis
In this section, we analyze the results of our Parabolic Trough Solar Collector CFD simulation. We examine the velocity and temperature contours to understand the complex interaction between fluid flow and heat transfer. First, let us analyze the velocity distribution in Figure 3. The flow field around the receiver tube is quite complex. We can observe maximum velocities reaching 22.9 m/s in the regions very close to the tube surface. This high speed is driven by the geometry and thermal effects. The flow shows a symmetrical pattern, but the highest velocities are found in the upper parts of the domain. This occurs because the fluid accelerates due to “thermal buoyancy” effects—hot fluid creates an upward force. Additionally, the circular shape of the receiver tube creates a distinct “wake region” directly behind it. In this wake, the velocities are much lower, ranging from 0 to 4.59 m/s. These low-speed zones indicate probable recirculation, which can trap heat and potentially decrease the overall transfer efficiency. The gradual change from high-speed areas to intermediate speeds clearly shows the formation of boundary layers around the collector.
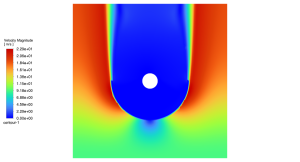
Figure 3: Velocity distribution contour showing the wake region and maximum velocity of 22.9 m/s.
Consequently, this flow behavior directly impacts the thermal results shown in Figure 4. The temperature distribution proves the success of the parabolic design. The UDF implementation has created discrete thermal gradients on the absorber wall. We can see peak temperatures exactly at the focal point where the trough concentrates the solar energy. The contours indicate that the heat is successfully transferring to the working fluid, especially in the areas where the velocity field promotes good mixing. The Discrete Ordinates (DO) model accurately captures the radiative exchange, as seen in the temperature patterns around the tube. This link between the fluid movement and the thermal distribution confirms that the collector is efficiently converting solar radiation into usable thermal energy.

Figure 4- Temperature distribution contour showing the effect of non-linear heat flux.
Key Takeaways & FAQ
- Q: Why is a Non-Uniform Heat Flux used in this simulation?
- A: In a real parabolic trough, the mirror focuses sunlight onto a thin line. This creates a very high heat intensity in one spot and lower intensity elsewhere. A non-uniform heat flux model (via UDF) is required to simulate this reality accurately, as a constant heat input would yield incorrect results.
- Q: What is the role of the Discrete Ordinates (DO) model?
- A: The DO model is crucial for solar CFD simulations. It calculates how radiation travels through the domain, including shadowing and absorption effects, which are the primary drivers of heat in a solar collector.
- Q: Why does the velocity increase in the top part of the domain?
- A: The fluid near the hot receiver tube becomes lighter and rises due to buoyancy. This natural convection, combined with the forced flow, causes the fluid to accelerate in the upper regions, reaching speeds up to 22.9 m/s.


Reviews
There are no reviews yet.