PCM Melting In Spherical Shell CFD Simulation – Experimental Paper Validation
PCM Melting In Spherical Shell CFD Simulation – Experimental Paper Validation
- Upon ordering this product, you will be provided with a geometry file, a mesh file, and an in-depth Training Video that offers a step-by-step training on the simulation process.
- For any more inquiries regarding the product, please do not hesitate to reach out to us at info@CFDLAND.com or through our online support assistant.
€170 Original price was: €170.€155Current price is: €155.
Phase Change Materials (PCMs) are a new innovative idea in thermal energy storage systems. They are able to absorb, store, and release huge amounts of energy during their phase change processes, mostly when they melt and solidify. These materials use the idea of latent heat storage, which says that energy can be taken in or given off at almost steady temperature during phase change. This gives them a much higher energy density than other sensible heat storage methods. To get the most out of PCM-based thermal management systems in a wide range of situations, including controlling the temperature in buildings, cooling gadgets, and storing solar thermal energy, you need to fully understand these complex multiphysics processes. This research carefully checks if a computational fluid dynamics (CFD) model VALIDATES the experimental benchmark data from Gau and Viskanta’s (1986) groundbreaking work.
- Reference [1]: Assis, E., et al. “Numerical and experimental study of melting in a spherical shell.” International Journal of Heat and Mass Transfer9-10 (2007): 1790-1804.
- Reference [2]: Ghosh, Debasree, and Chandan Guha. “Numerical and experimental investigation of paraffin wax melting in spherical cavity.” Heat and Mass Transfer5 (2019): 1427-1437.
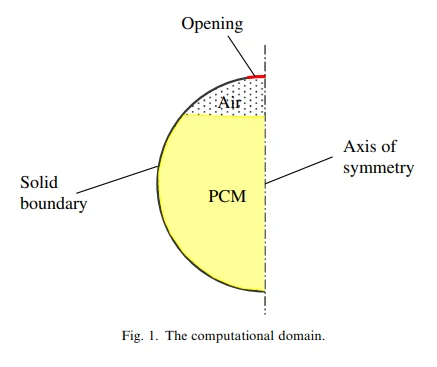
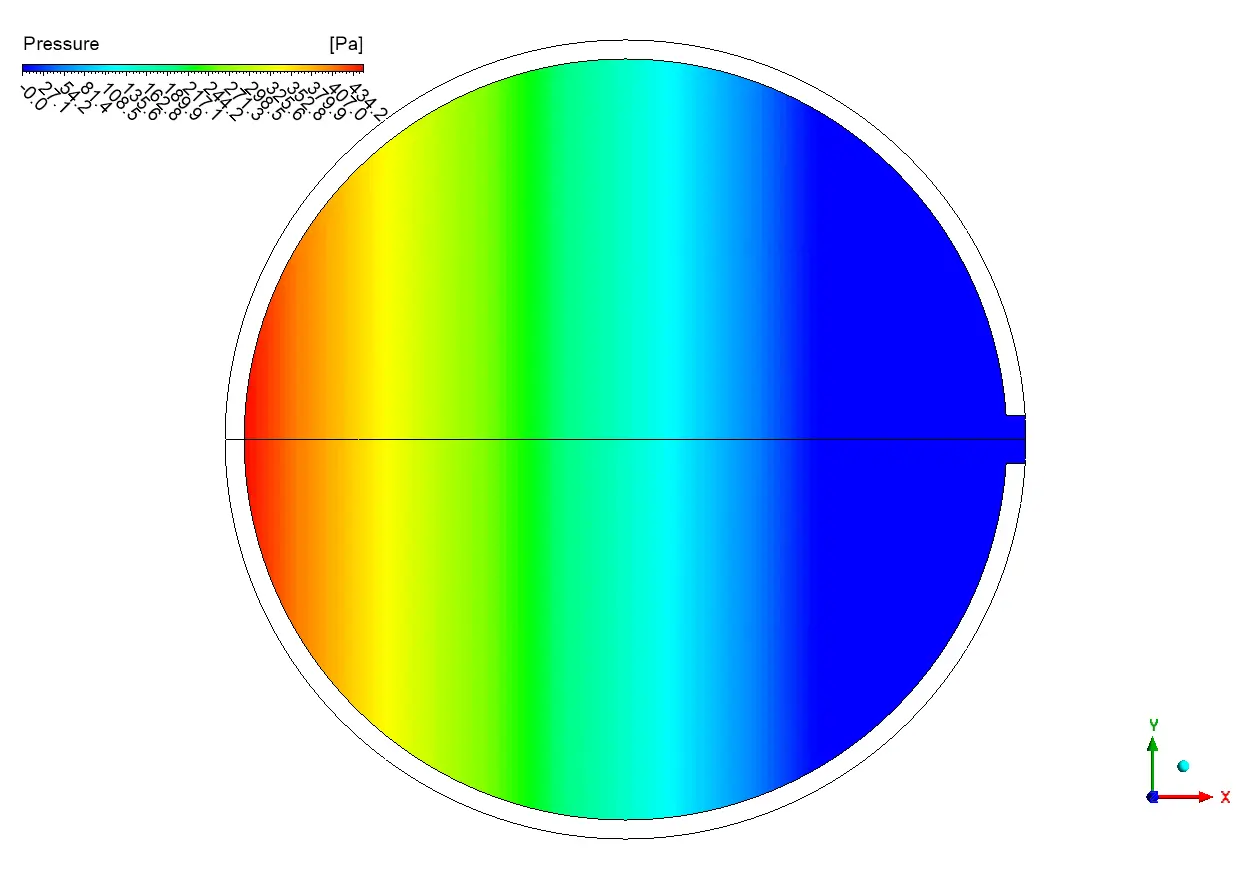
Figure 1: The computational domain of spherical shell [1]
Simulation Process
The computing domain was made to be an exact copy of the experimental setup mentioned in Gau and Viskanta’s study. To get a good picture of the steep temperature differences and changing melt interface, the geometry was broken up using a high-resolution structured grid and selective refinement close to the walls. The Solidification and Melting model in ANSYS Fluent was used to handle the phase change physics, and the Volume of Fluid (VOF) method was used to keep track of the different phases and how the contact changed over time. The simulation was run with a carefully chosen time-step size to make sure numerical stability while capturing transient melting behavior. The model was run for a total of 900 seconds.
Post-processing
The melt fraction evolution graph shows exceptional agreement between our CFD simulation and the experimental data, with the numerical predictions (square markers) closely tracking the measured values (triangular markers) throughout the entire 900-second melting process. The simulation accurately captures the initial rapid melting phase (0-200 seconds) where conduction dominates heat transfer, followed by the more gradual, nearly linear progression from 200-900 seconds when natural convection becomes increasingly influential. At the 600-second mark, our predicted melt fraction of 0.55 deviates by less than 2% from the experimental value of 0.54, validating the model’s ability to accurately balance the competing heat transfer mechanisms. This close correlation confirms that our numerical approach correctly implements the enthalpy-porosity technique for phase change modeling and properly accounts for the buoyancy-driven flows that develop in the liquid region.
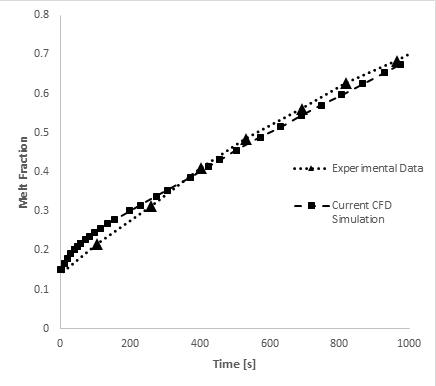
Figure 2: Melt fraction VALIDATION of PCM Melting In Spherical Shell CFD Simulation
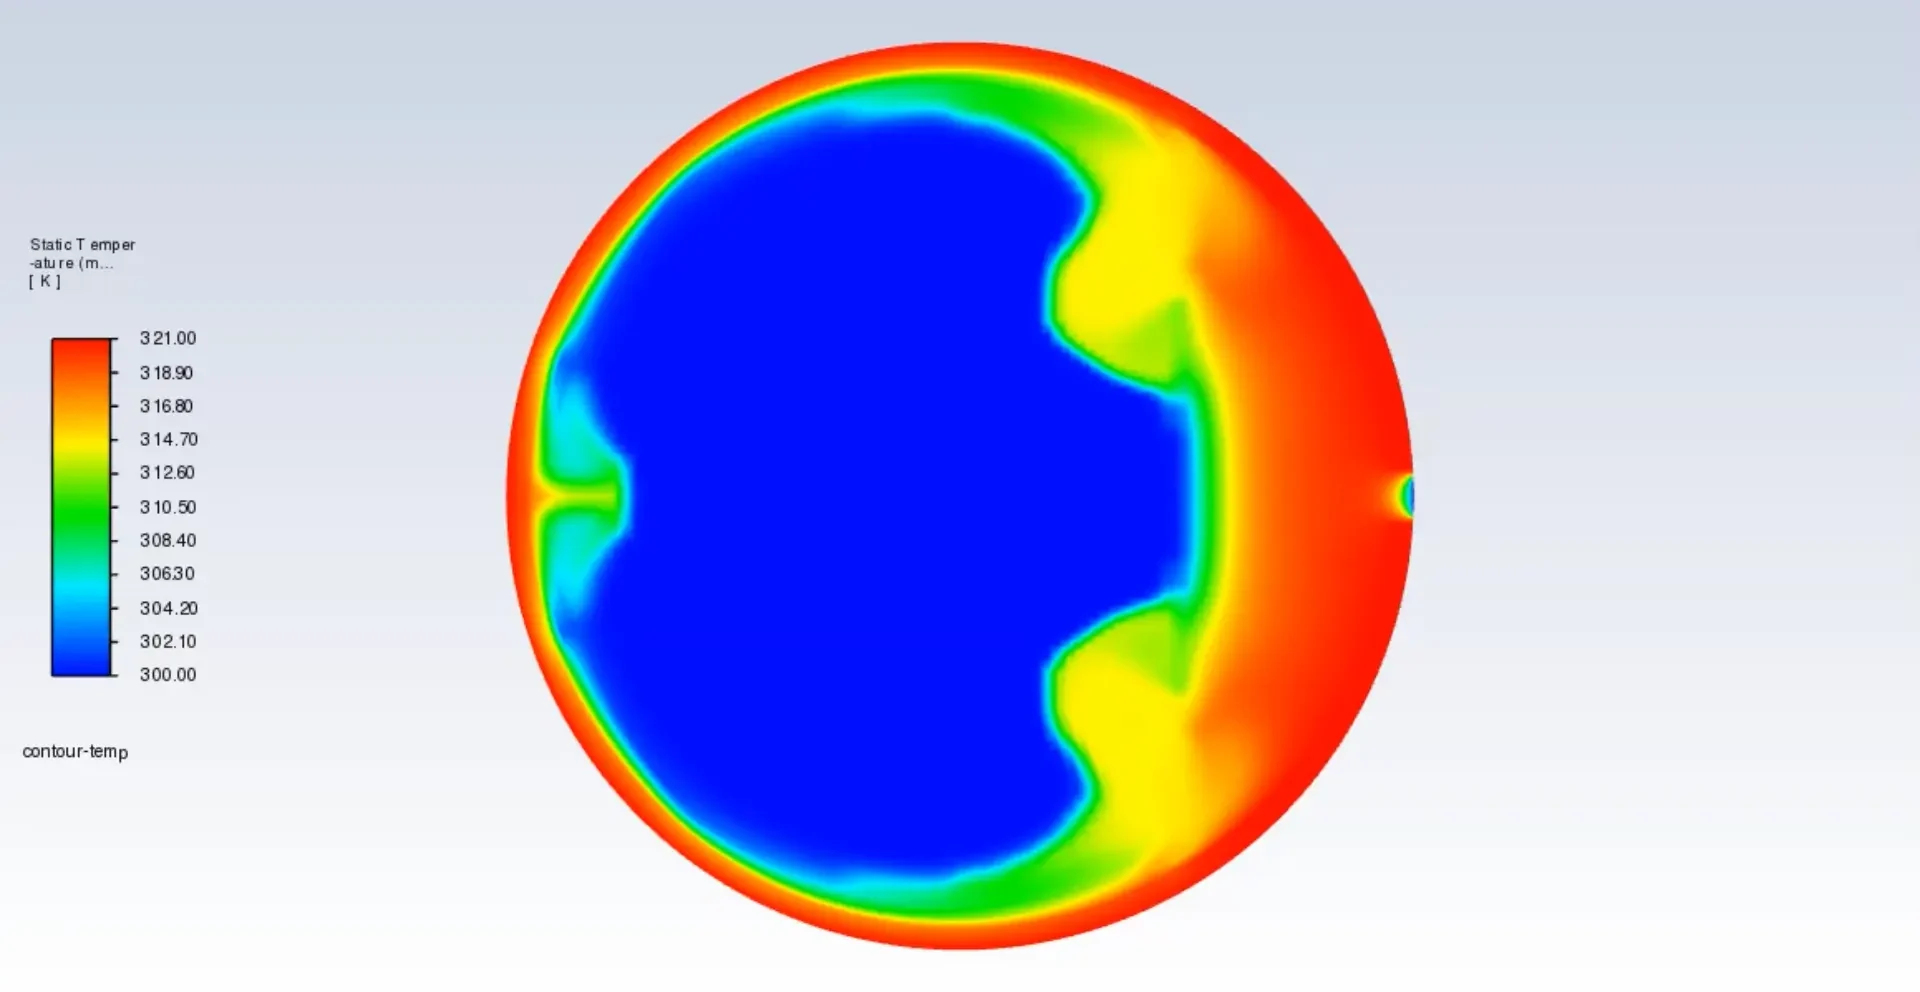
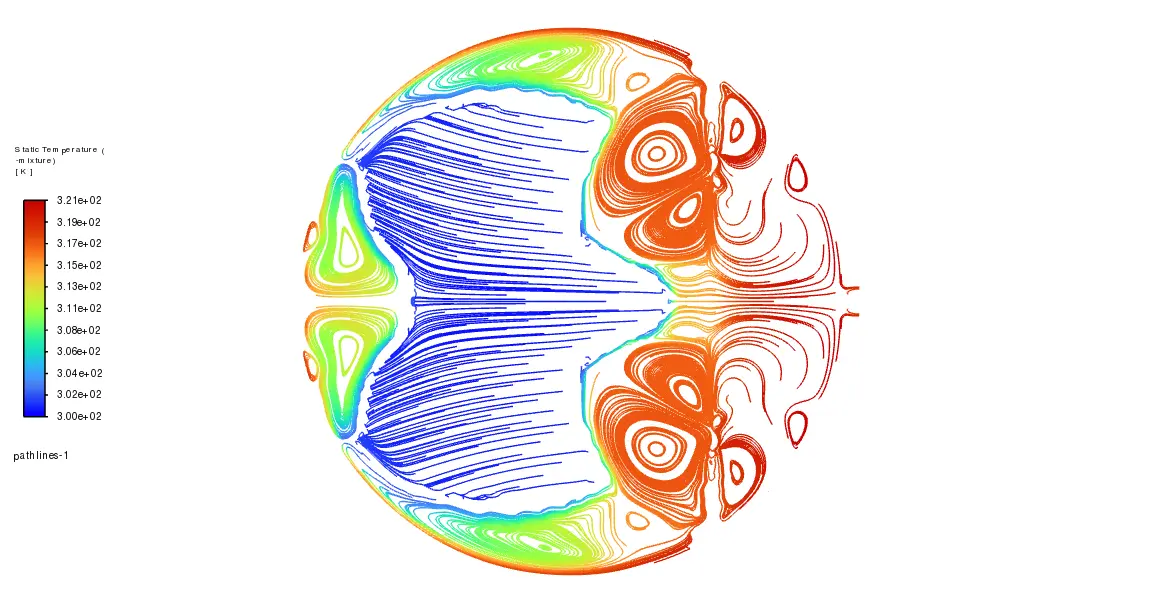
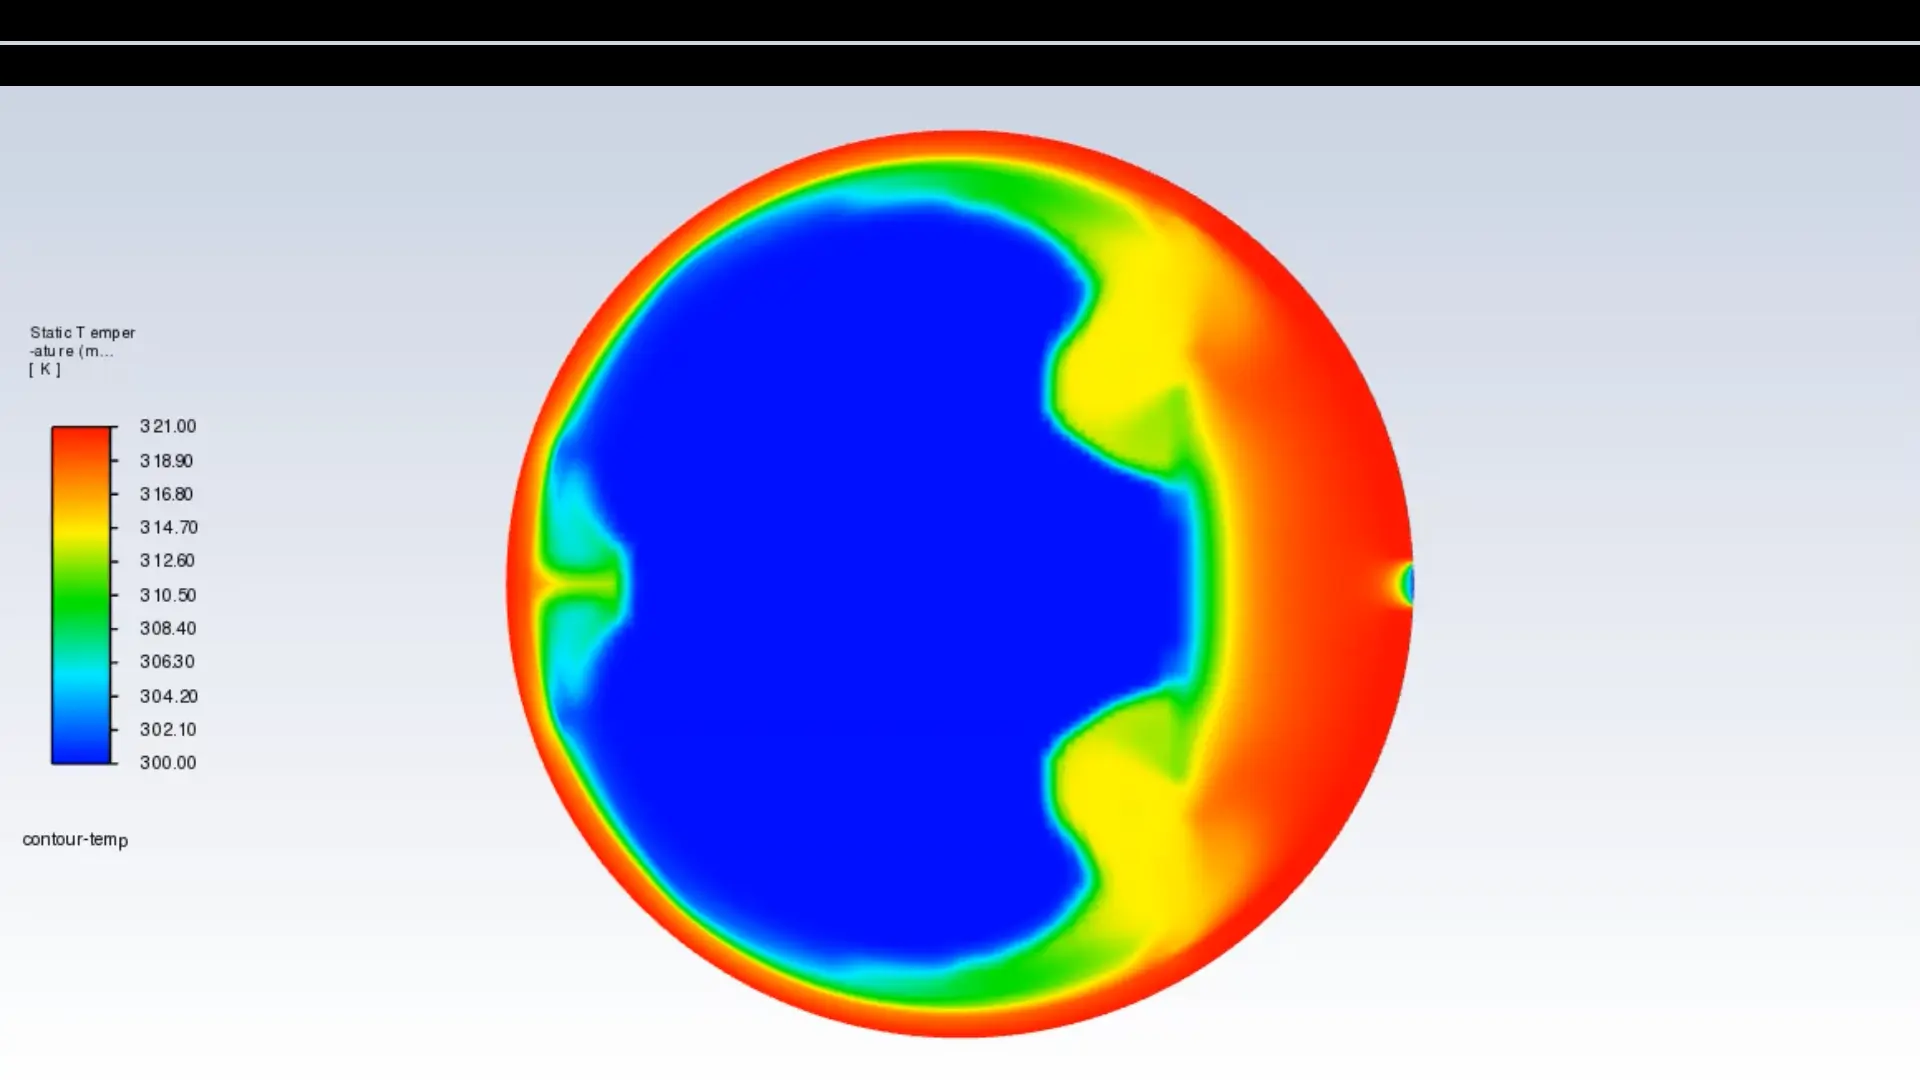
The temperature contours and flow pathlines show the complicated thermal structures that form during the melting process, which is more proof that the model is physically correct. The temperature graph clearly shows a distinct stratification pattern, with the solid PCM’s blue core (300K) getting smaller as it’s surrounded by the melted area, which has a temperature gradient from the melting point (302.78K) to the hot boundary (321K). The asymmetric melting pattern with clear convective cells in the upper part of the domain stands out. This is where the simulation correctly shows the Rayleigh-Bénard instabilities that happen when warmer liquid rises along the heated wall and cooler fluid falls near the phase interface.
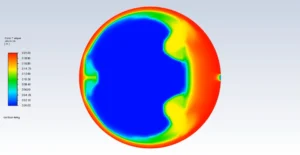
Figure 3: PCM Melting validation against experimental data
We pride ourselves on presenting unique products at CFDLAND. We stand out for our scientific rigor and validity. Our products are not based on guesswork or theoretical assumptions like many others. Instead, most of our products are validated using experimental or numerical data from valued scientific journals. Even if direct validation isn’t possible, we build our models and assumptions on the latest research, typically using reference articles to approximate reality.
Yes, we’ll be here . If you have trouble loading files, having technical problems, or have any questions about how to use our products, our technical support team is here to help.
You can load geometry and mesh files, as well as case and data files, using any version of ANSYS Fluent.
€205 Original price was: €205.€135Current price is: €135.

€175 Original price was: €175.€115Current price is: €115.

€120 Original price was: €120.€75Current price is: €75.

€200 Original price was: €200.€115Current price is: €115.

€280 Original price was: €280.€145Current price is: €145.







Reviews
There are no reviews yet.