
A Thickener CFD simulation is a computer model of a large tank used to separate solid particles from a liquid. These are essential in industries like mining and wastewater treatment. This Solid-Liquid Separation CFD analysis helps engineers see how well the thickener is working. To do this, we use a very powerful tool in ANSYS Fluent called the Population Balance Model (PBM). A Thickener PBM CFD simulation is special because it can track the size of particles as they join together (aggregation) or break apart. This Particle Size Distribution CFD is critical for understanding the settling process. Using a PBM Fluent model, engineers can predict how fast particles will settle and how clear the water will be at the top. This type of Flocculation CFD Fluent analysis helps to optimize the thickener’s design and operation for better performance.

Figure 1: A thickener schematic showing different components of the system
Simulation process: Fluent PBM Setup: Multiphase Modeling with the Discrete Method
To perform this Thickener PBM Fluent study, we first designed a 3D model of an industrial thickener based on real-world geometry. This model includes a cylindrical tank with a conical bottom, a central feedwell where the slurry enters, and outlets for the clarified water and thickened sludge. We used ANSYS Fluent Meshing to create a high-quality computational mesh. The mesh was made much finer in the feedwell, the main settling zone, and near the underflow outlet, as these are the areas where the complex particle physics occur.
In ANSYS Fluent, we used the Eulerian multiphase model with two phases. The primary phase was the liquid slurry, and the secondary phase was the flocculated solid particles ( a granular phase). The most important physics model we enabled was the Population Balance Model (PBM). We used the Discrete Method, which solves the PBM by dividing the full range of particle sizes into 9 discrete bins. Each bin represents a specific particle size, from the smallest at 4.5e-5 m (Bin-8) to the largest at 0.0018 m (Bin-0). We also activated a breakage kernel to model how large particle flocs can be broken into smaller pieces by the turbulent flow.

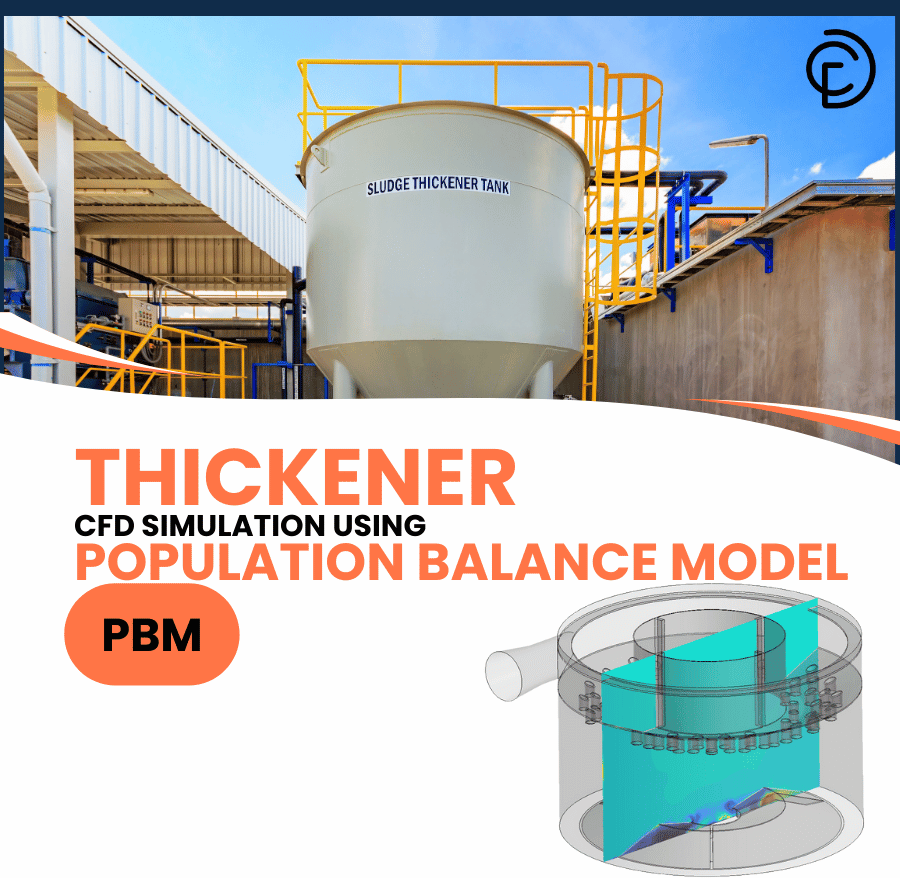
Figure 2: The 3D CAD model of the industrial thickener used for the Thickener PBM CFD simulation, showing the central feedwell and conical bottom.
Post-processing: CFD Analysis, Particle Settling Dynamics and PBM Distribution
The simulation results give us a complete picture of the thickener’s performance. The overall particle statistics are summarized in the table below.
| Population Balance Parameter | Result | Unit | Engineering Meaning |
| Moment 0 (Total Number) | 2.63 x 10¹¹ | particles/m³ | Represents the huge total number of particles. |
| Moment 1 (Total Length) | 2.21 x 10⁷ | m/m³ | Related to the total length of all particles combined. |
| Moment 2 (Total Area) | 2,402 | m²/m³ | Represents the total surface area of all particles. |
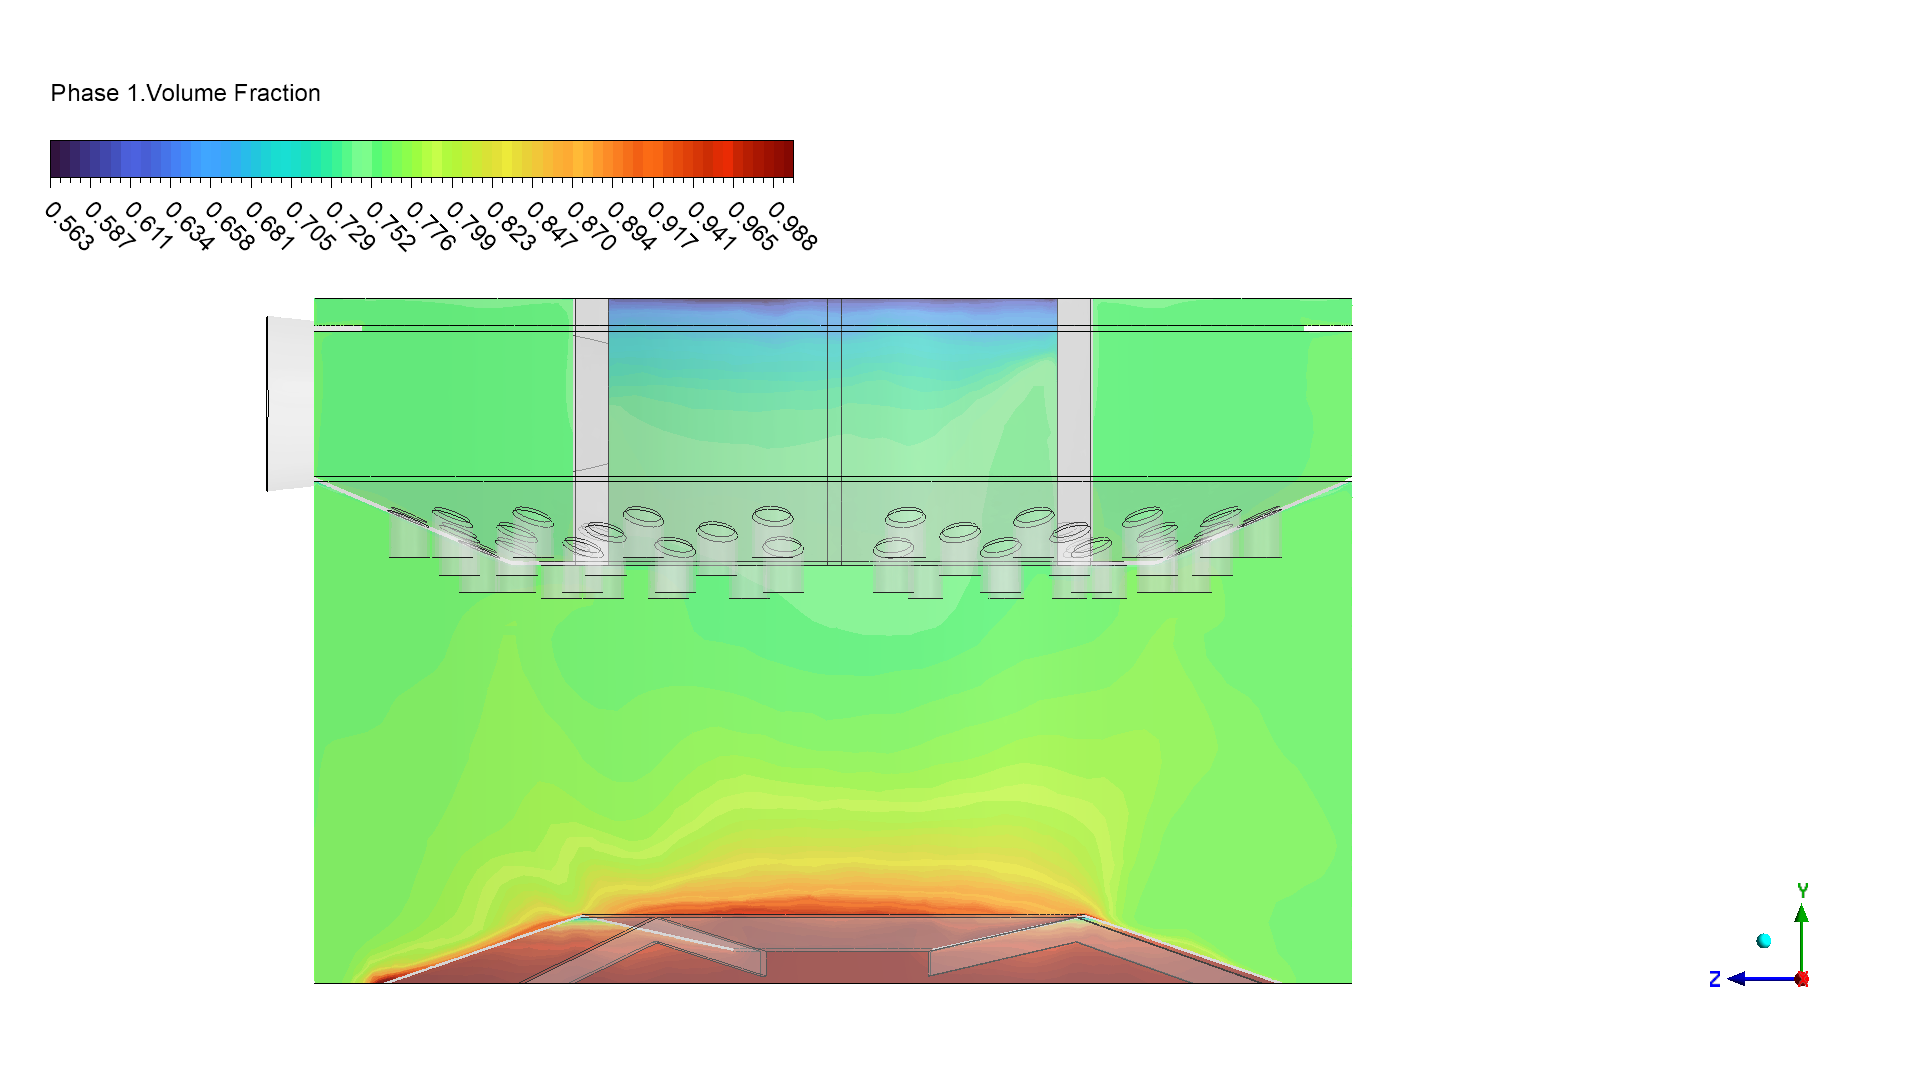
| Moment 3 (Total Volume) | 0.435 | m³/m³ | Represents the total volume fraction of the solids. |
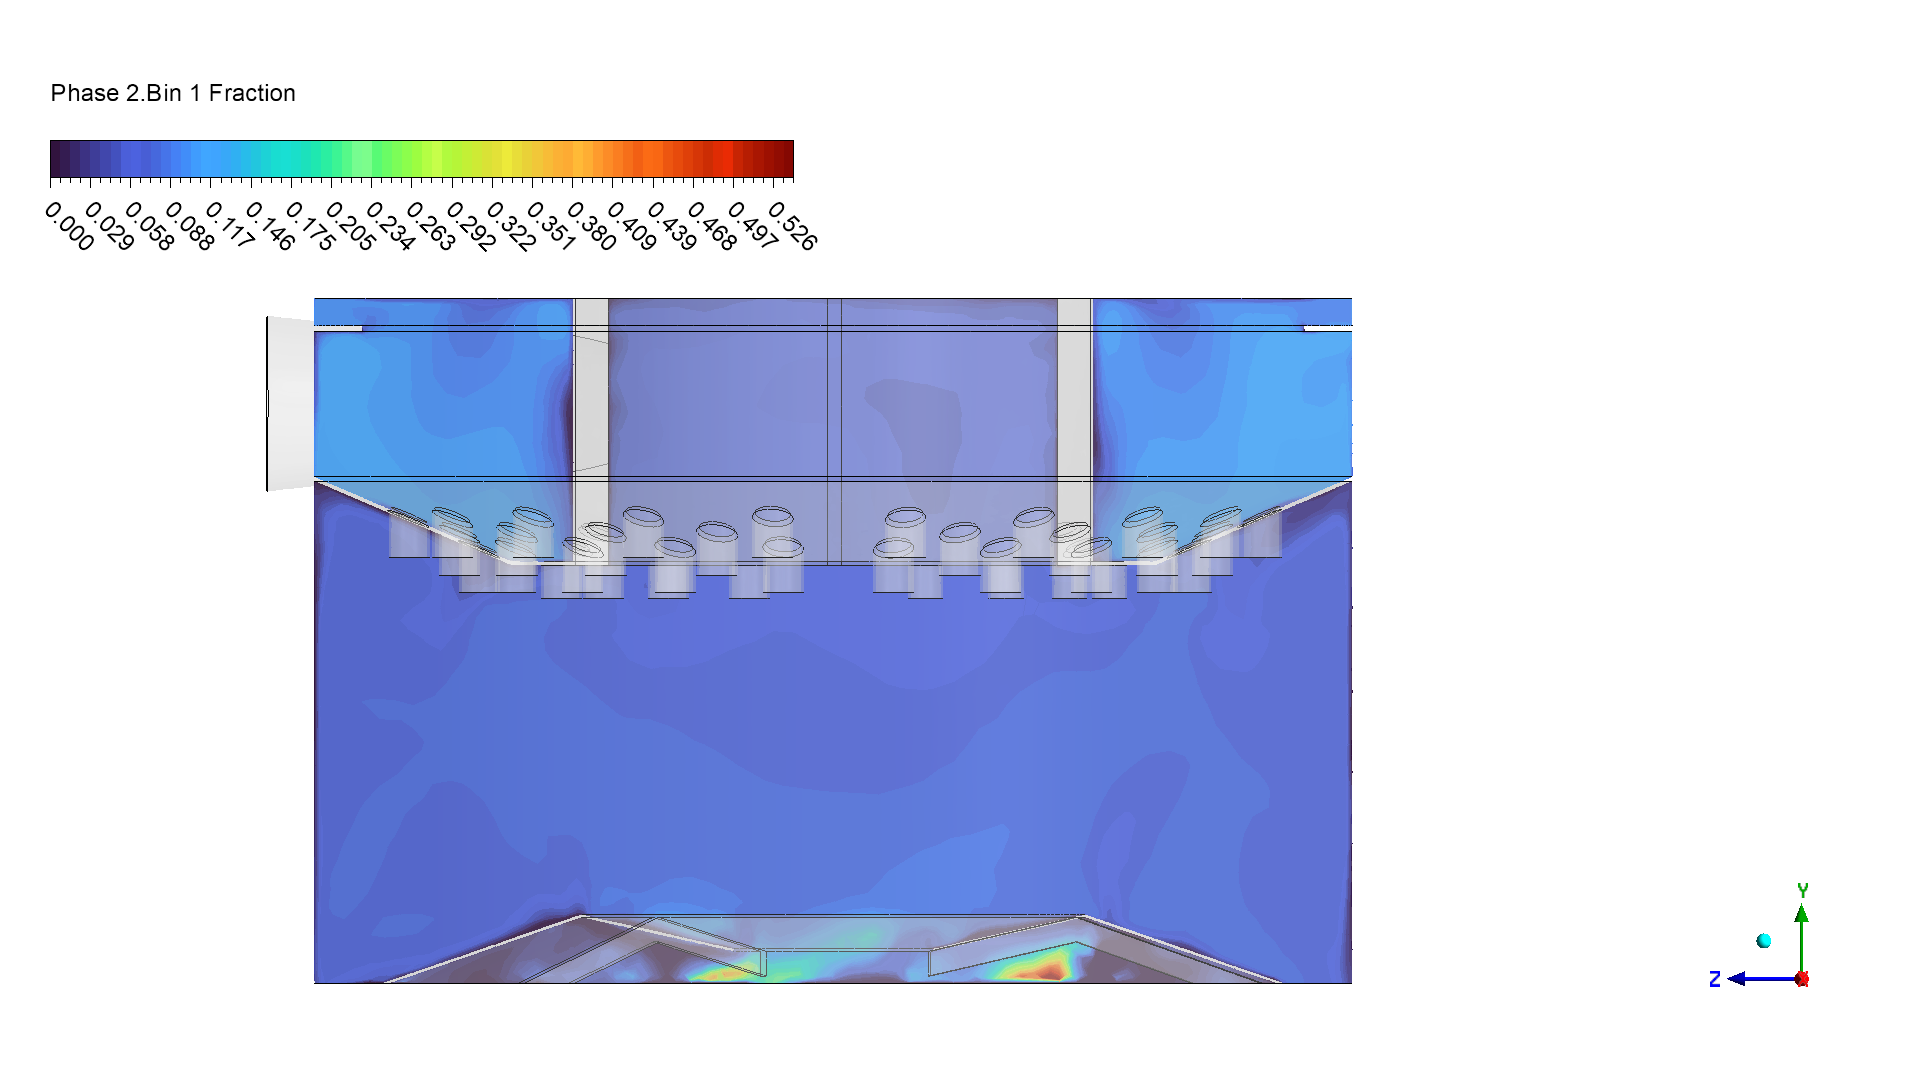
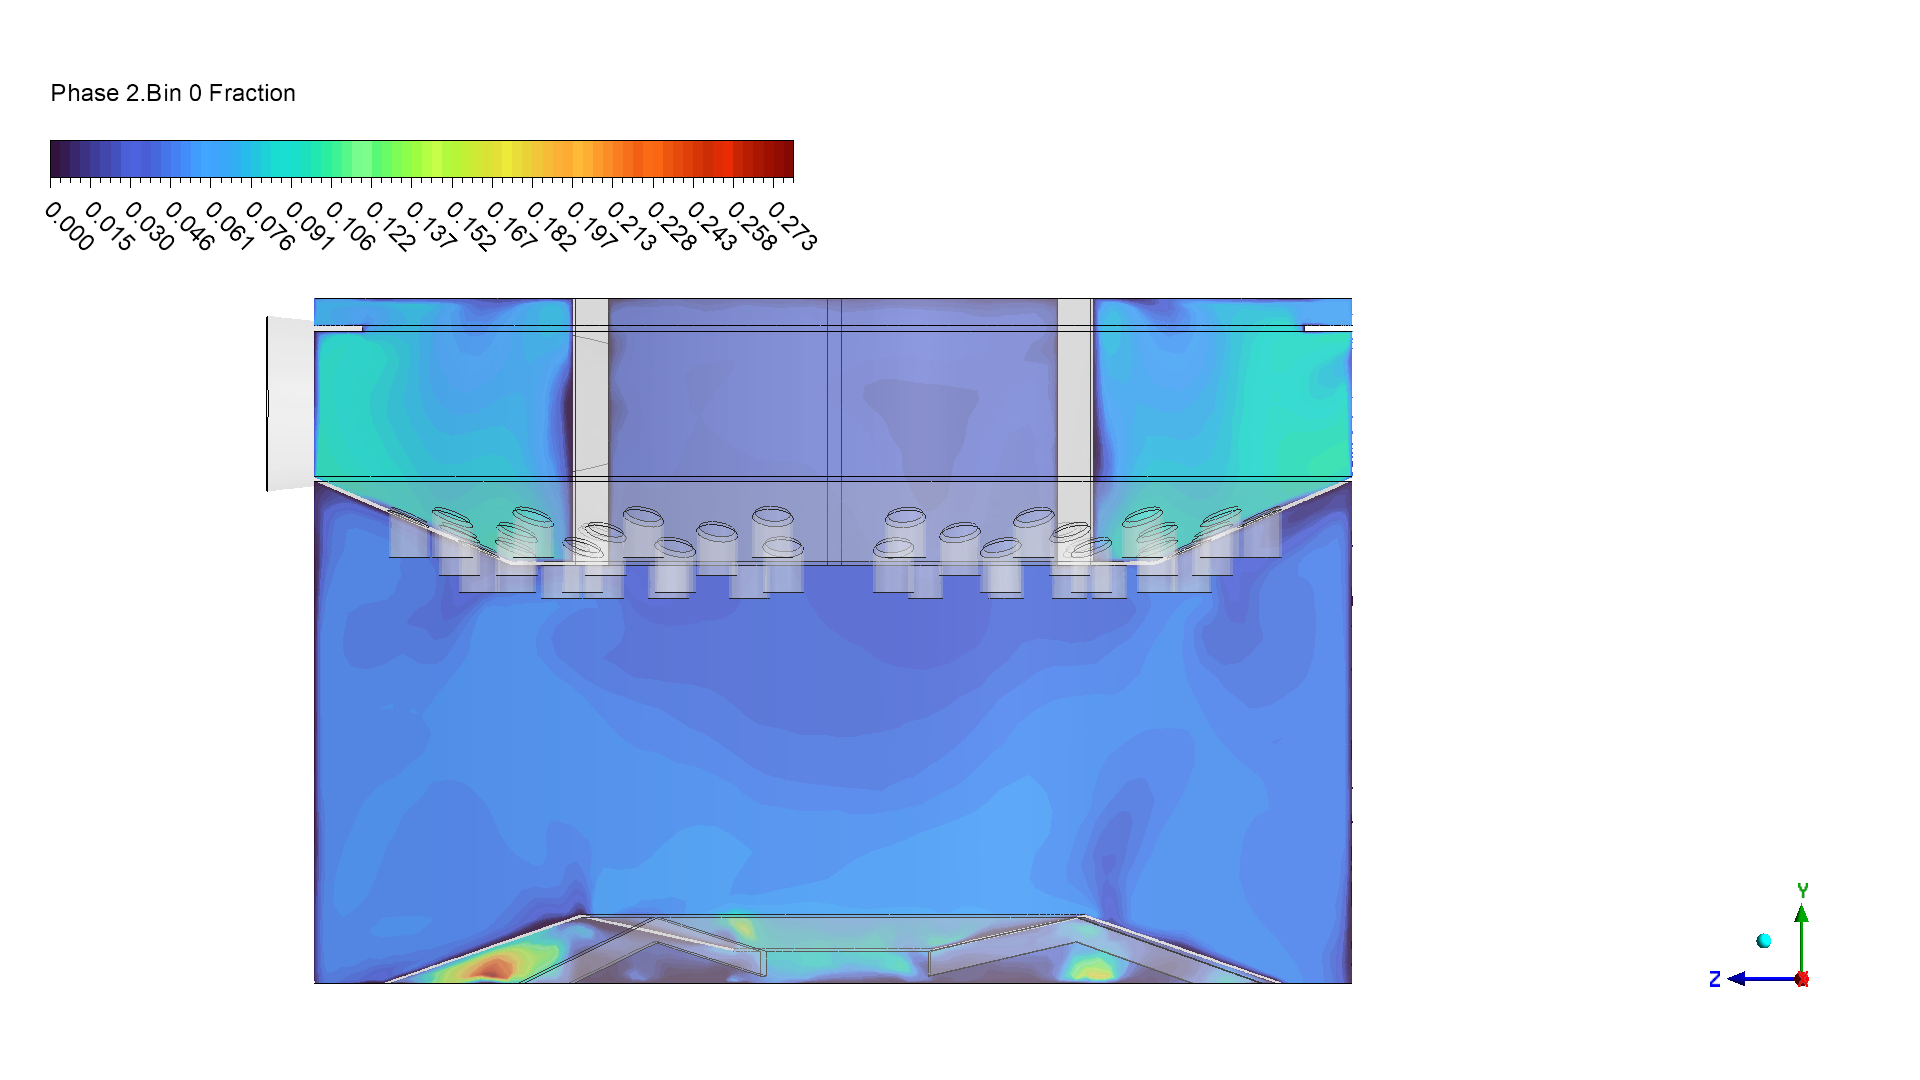
The direct result of this flow pattern is seen in the particle fraction contours in Figure 4. This contour shows the location of only the largest particles (Bin-0). There is a high concentration (up to 0.27 fraction) of these large particles at the bottom of the thickener, near the underflow outlet. This is perfect performance. It is direct proof that the large flocs formed in the feedwell are successfully settling through the calm zone. At the same time, the top of the thickener is blue, meaning there are almost no large particles there, which results in clear water at the overflow. The Number Density Distribution in Figure 3 supports this analysis. The plot shows a very high number of small particles and very few large ones. This “exponential decay” shape proves that the breakage process is dominant in the turbulent feedwell, which is a realistic outcome captured by our PBM model.

Figure 3: The particle Number Density Distribution plot, showing the quantity of particles across the different size bins as predicted by the Discrete Method in Fluent.
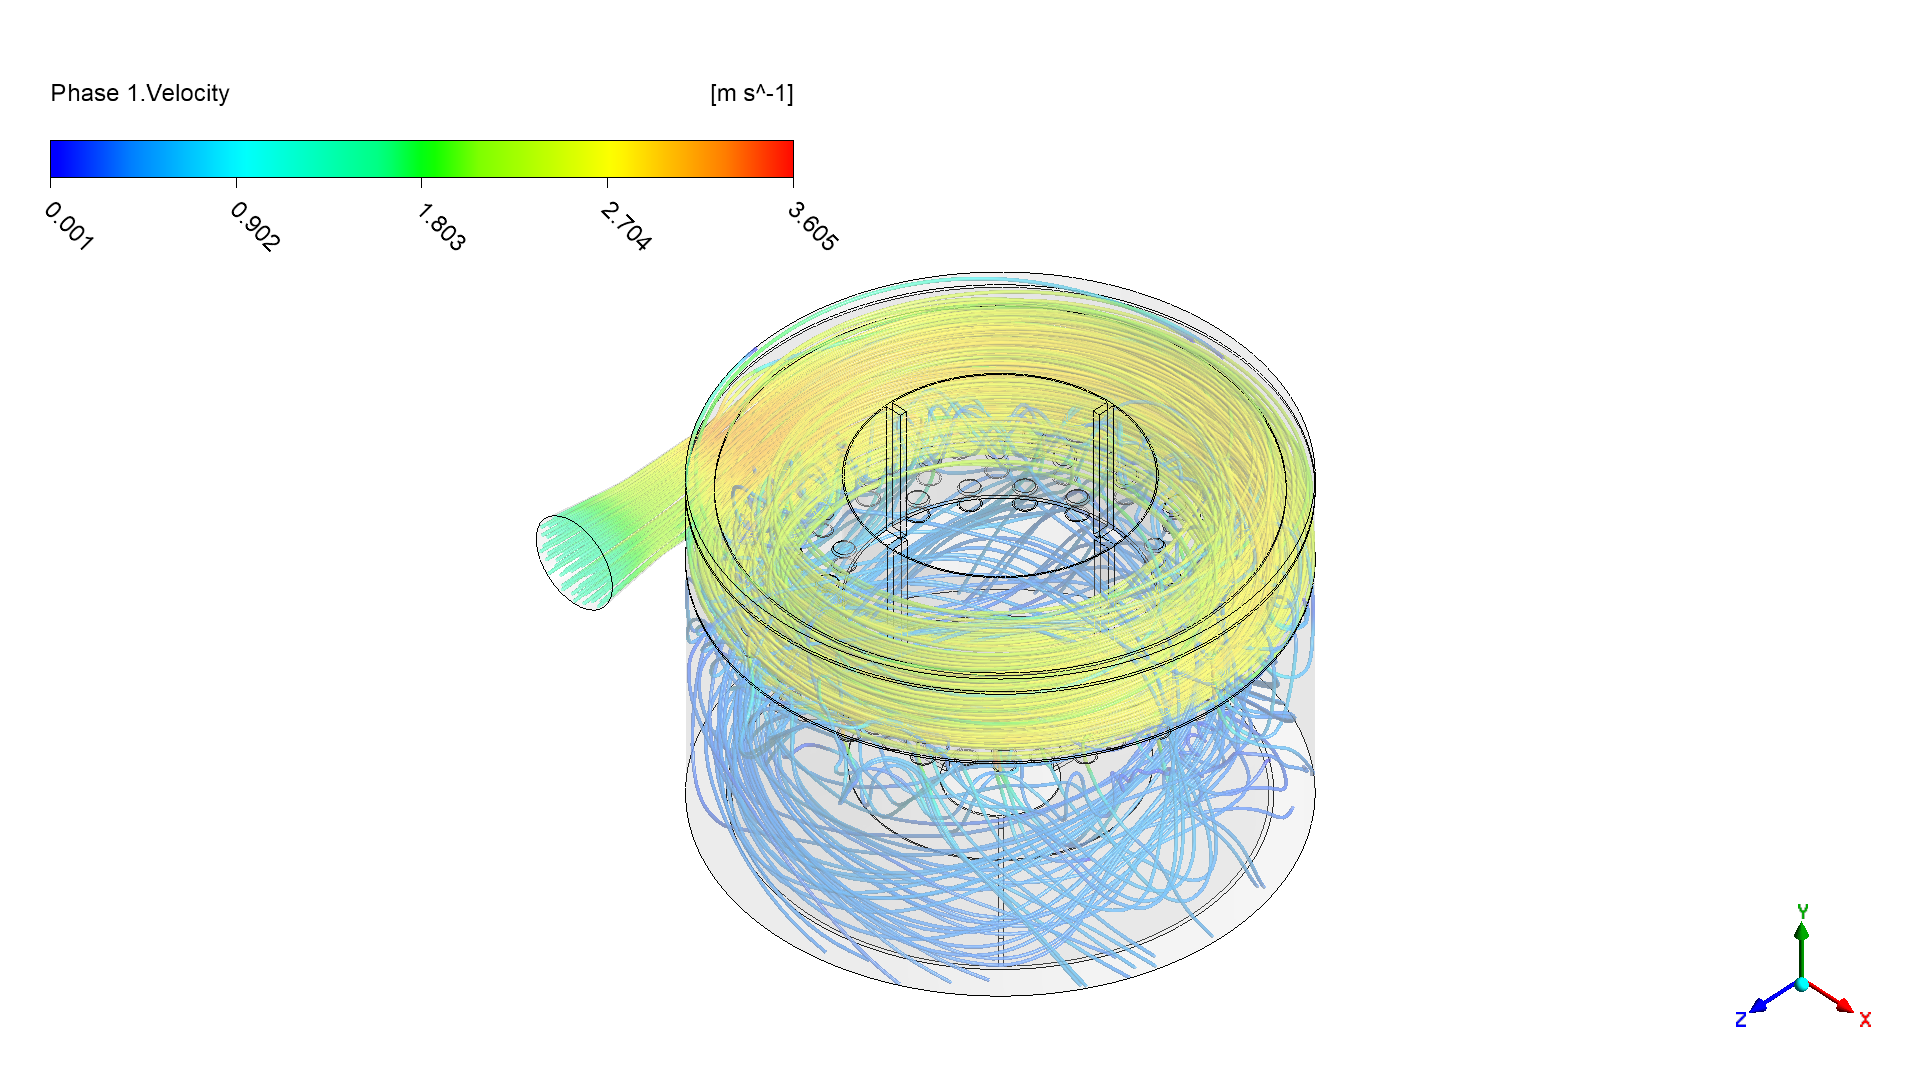
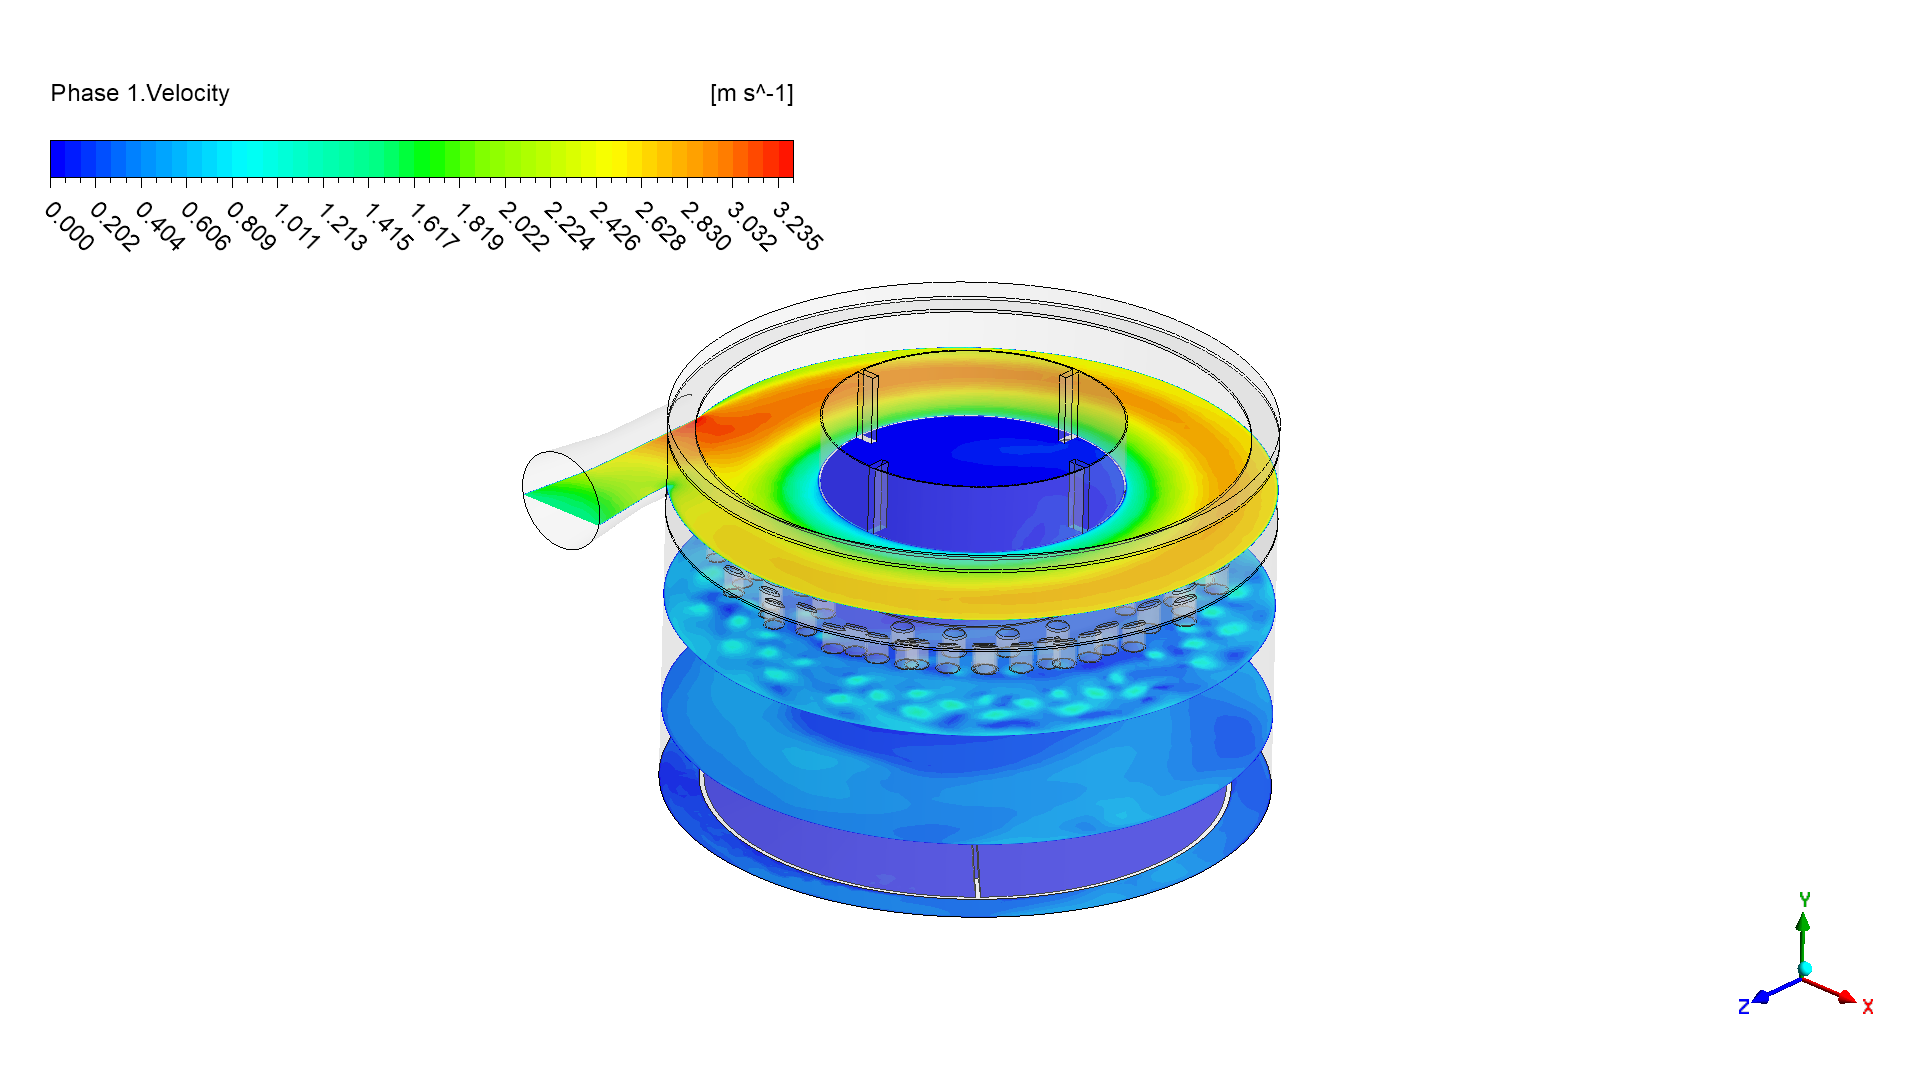
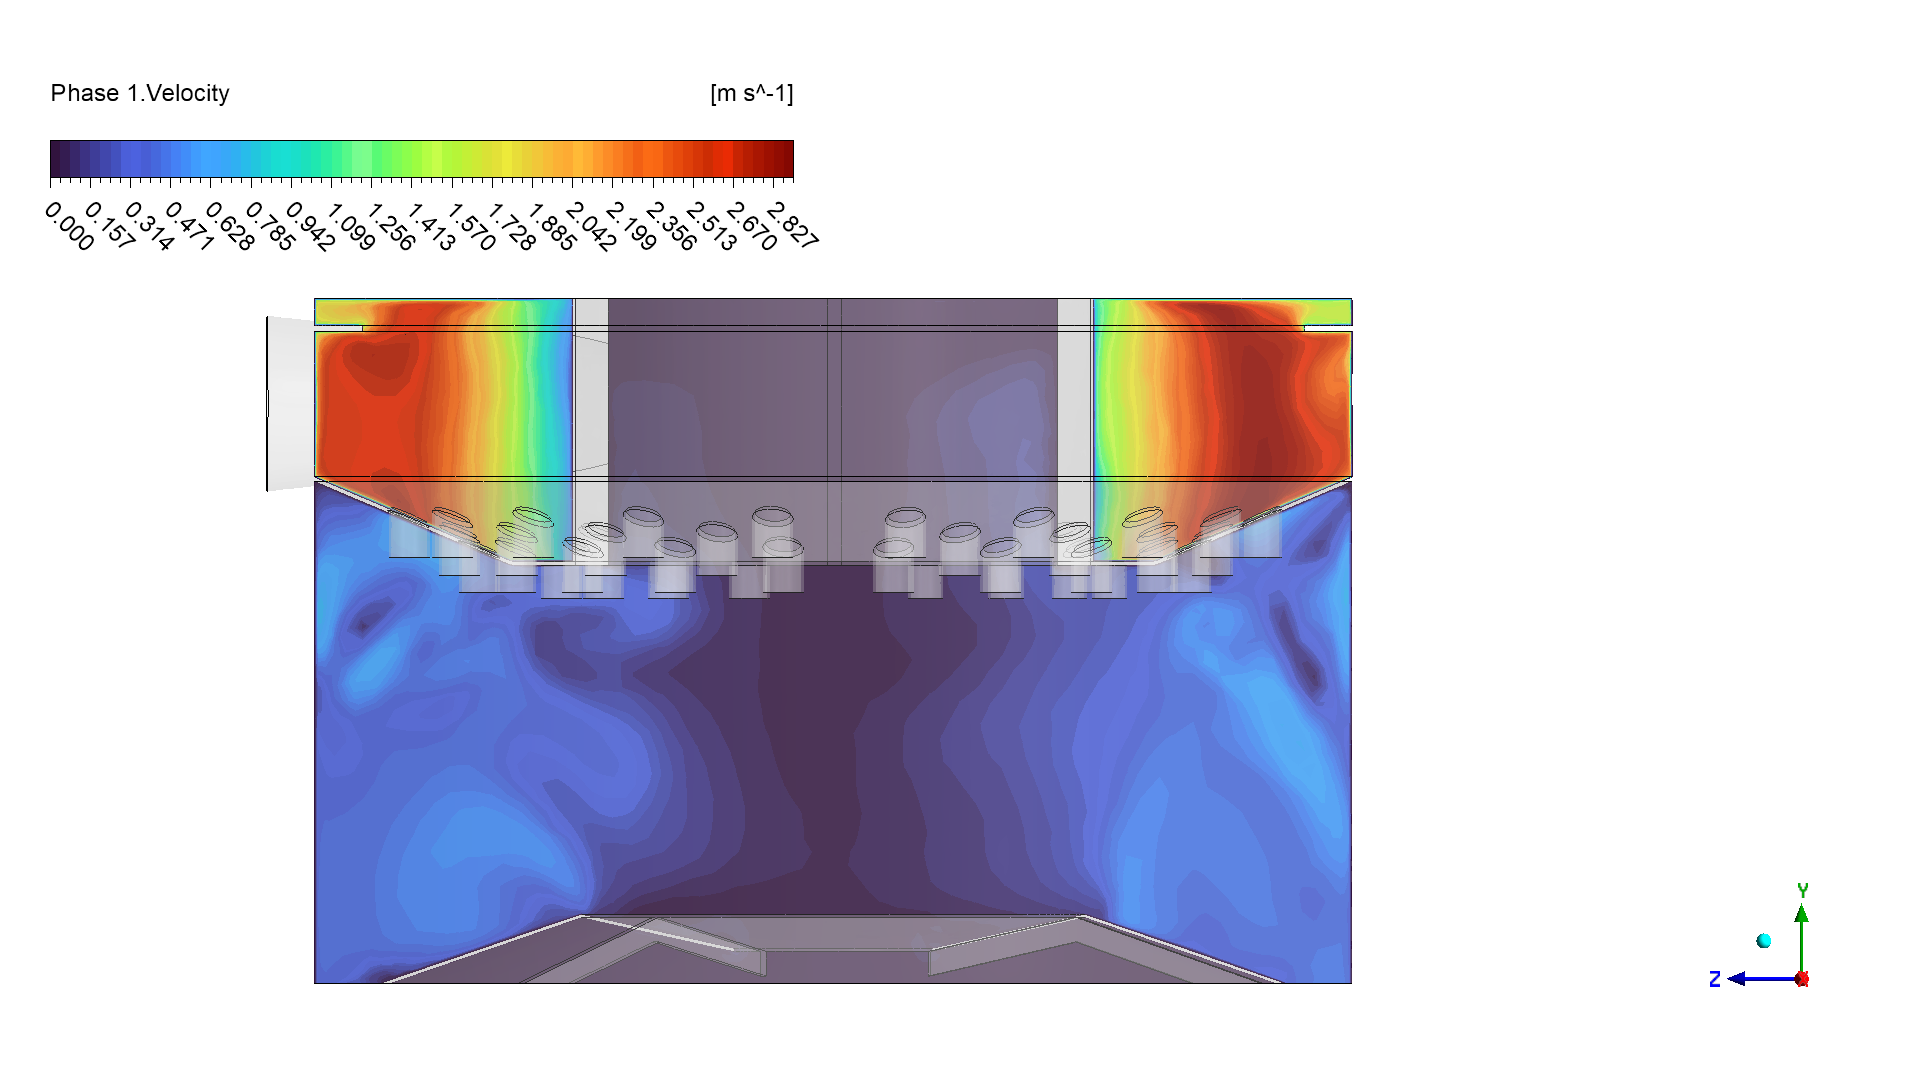
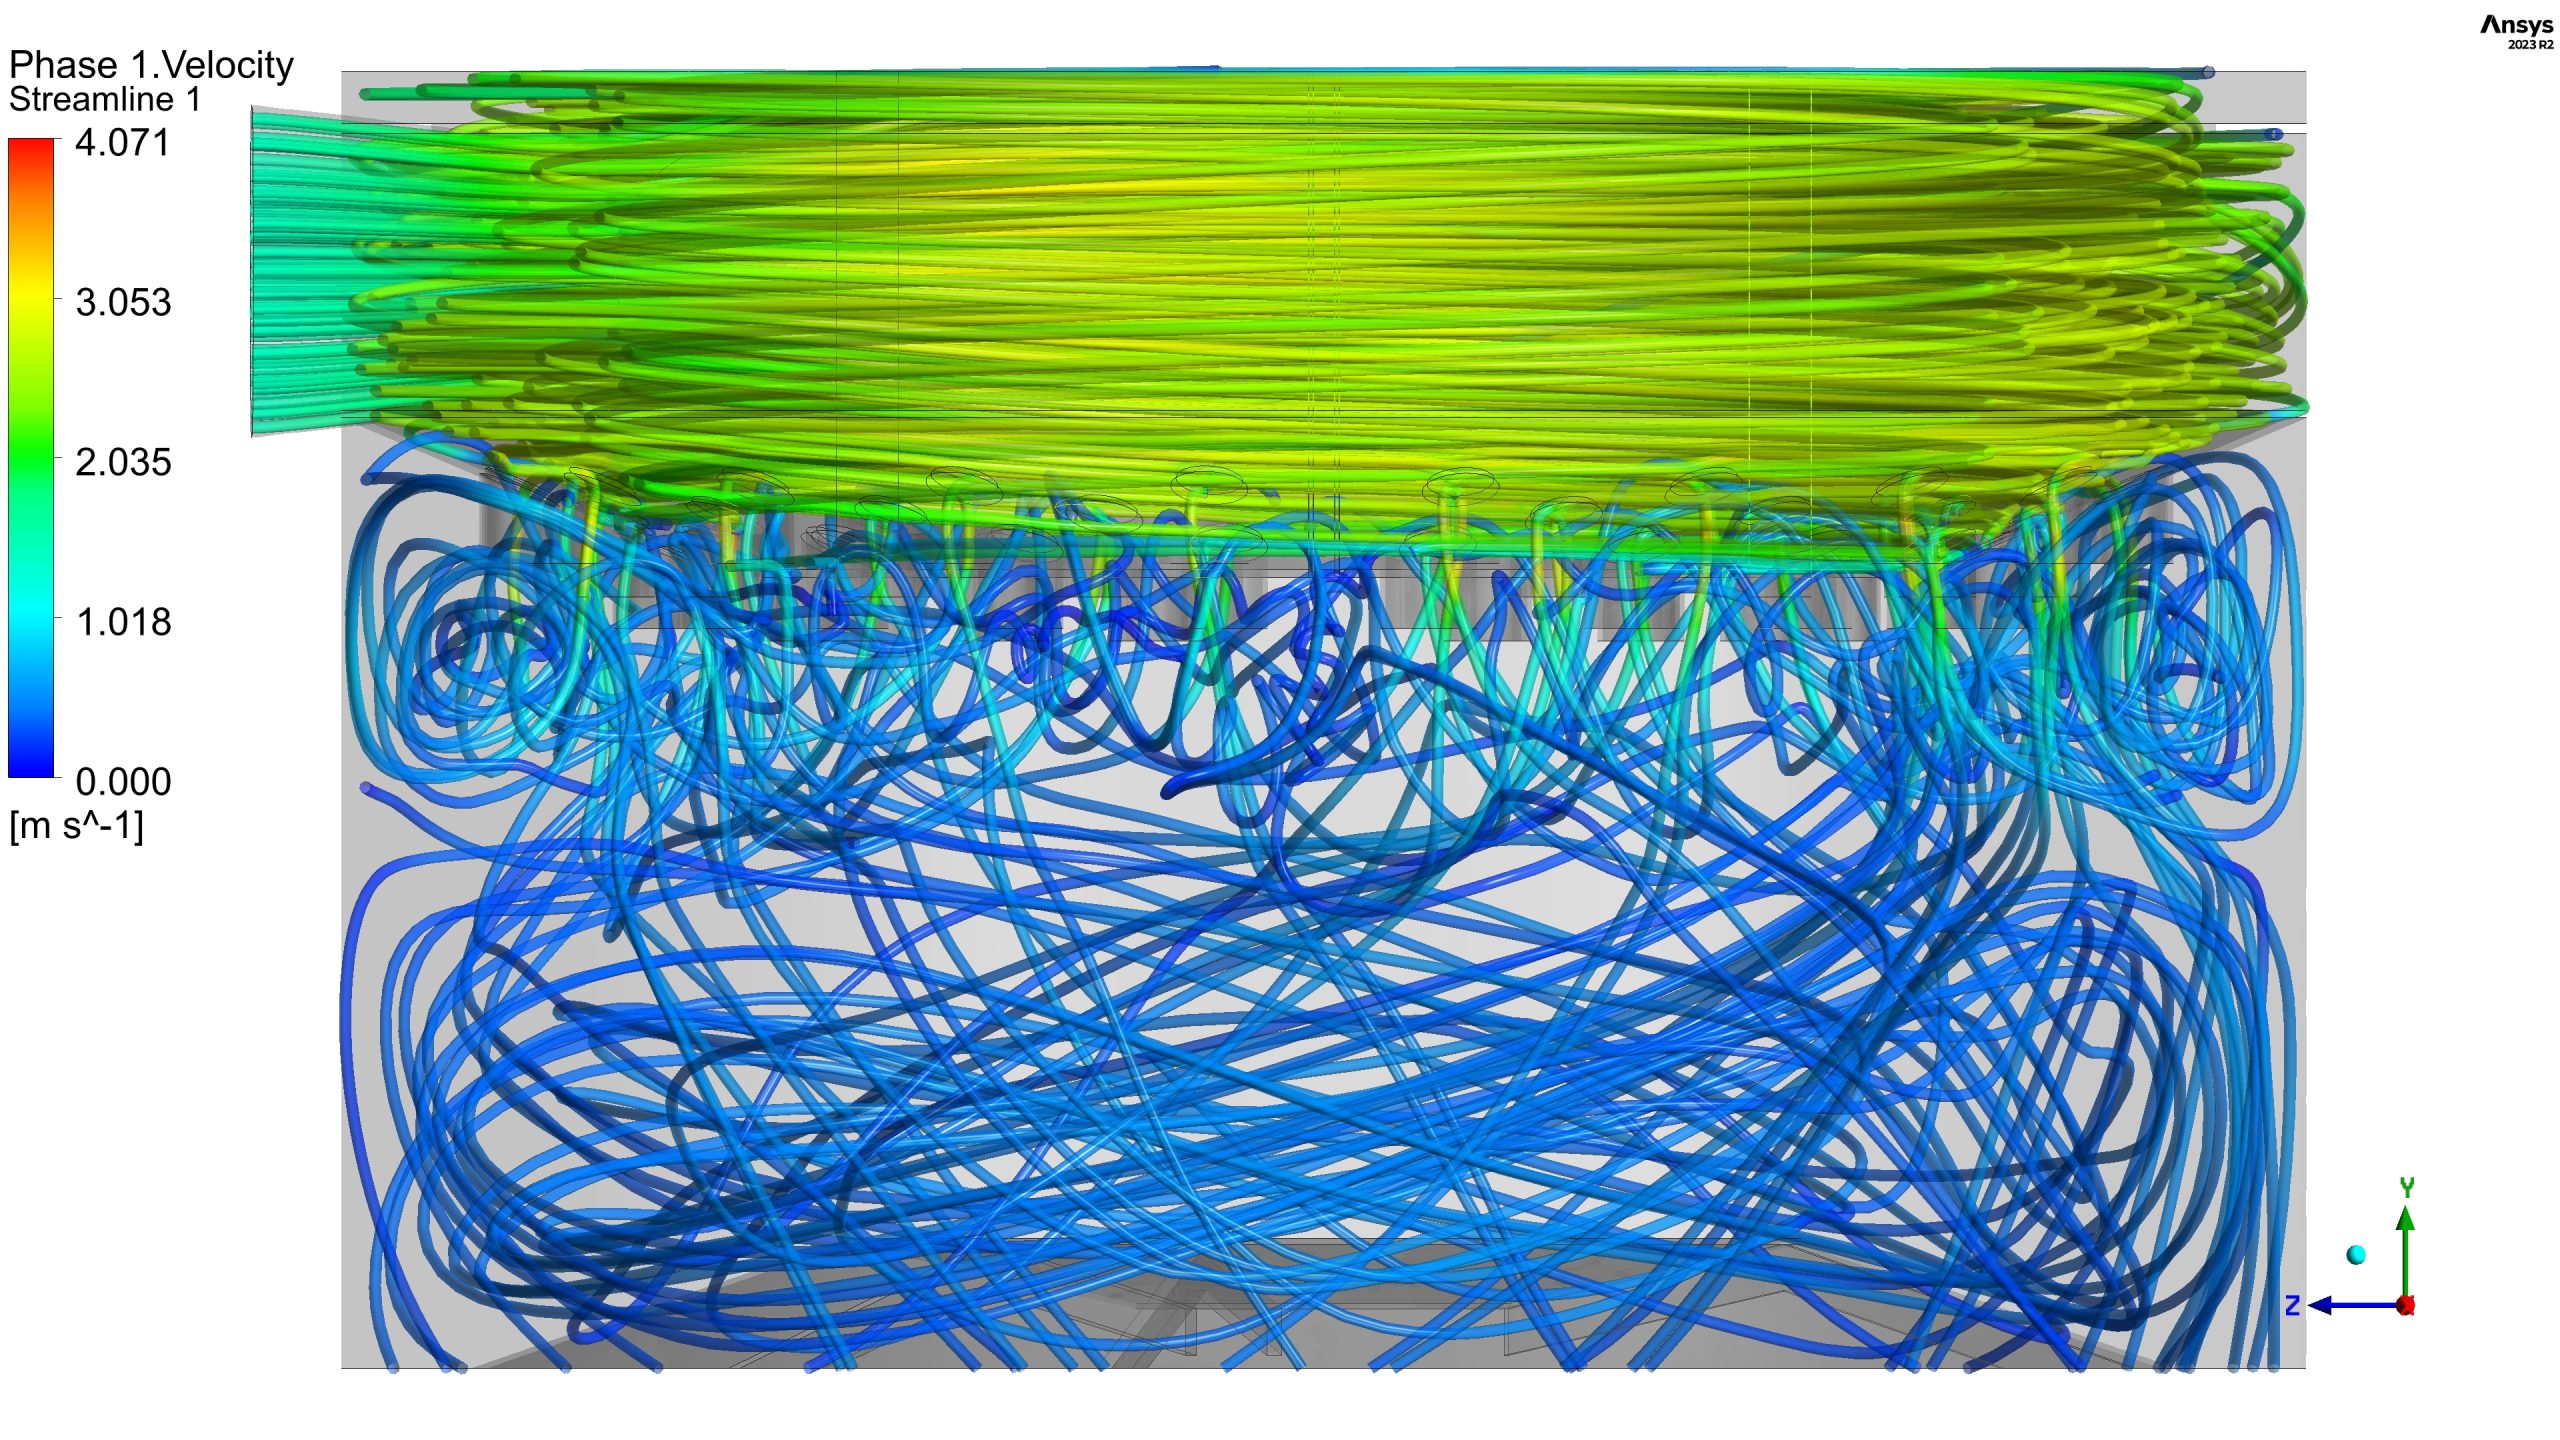
From an engineering perspective, the velocity contours in Figure 5 are the most important factor driving the entire process. We see a zone of high velocity and turbulence (up to 3.2 m/s) inside the central feedwell. This high energy is necessary to mix the incoming feed with the flocculant chemicals. However, this turbulence also causes particle breakage. Crucially, outside the feedwell, the velocity drops significantly, creating a large, calm settling zone with very low velocity (blue areas). This calm zone is essential for the separation to work; it gives the large flocs time to settle downwards due to gravity without being disturbed.
The most important achievement of this simulation is the successful use of the PBM to model the two competing physical processes inside the thickener: 1) the high-turbulence mixing and particle breakage in the feedwell, and 2) the effective gravitational settling of large flocs in the calm zone. This dual analysis confirms the thickener design is working correctly and provides a validated tool for future optimization.

Figure 4: Phase fraction contours of the largest particles (Bin-0) from the PBM CFD analysis, showing their concentration and settling pattern.

Figure 4: Phase 1 Velocity Contours Revealing Flow Patterns and Circulation in Thickener


Reviews
There are no reviews yet.