

In marine engineering, the propeller is a very important machine that moves a ship forward. However, when a heavy ship propeller spins very fast in the ocean, it creates severe changes in the water flow. If the water travels too quickly over the curved metal blades, the local fluid pressure drops deeply. If this pressure drops below the natural vapor limit of water, the cold liquid water instantly boils into vapor gas. This complex physical event is called cavitation. Cavitation causes massive problems for marine engineers. When the vapor bubbles collapse, they create shockwaves that slowly destroy the solid metal blades, generate loud underwater noise, and reduce the thrust power of the ship. Today, engineers use computers to study this problem safely. They perform a Ship Propeller Cavitation CFD study to see the exact vapor bubbles digitally. A complete CFD Analysis of Ship Propeller Cavitation is highly valuable for the maritime industry. By running a Ship Propeller Cavitation fluent simulation, a designer can test different blade shapes before the factory cuts the expensive metal. Inside the Ship Propeller Cavitation ANSYS Fluent software, engineers use advanced mathematical models to track the phase change from liquid to gas. These computer tools use Reynolds-Averaged Navier-Stokes (RANS) equations and specific cavitation models, such as the famous Schnerr-Sauer (SS) or Zwart-Gerber-Belamri (ZGB) models. To completely understand the mathematical physics of how liquid transforms into a gas under low pressure, please study our detailed Mass Transfer tutorials.
- Reference: Sezen, S., and S. Bal. “Cavitation analyses of DTMB 4119 propeller with LSM and URANS approach.” Ocean Engineering142 (2017): 361-370.
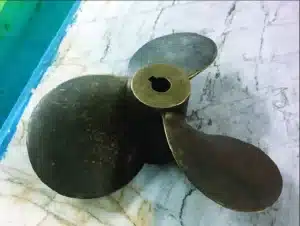
Figure 1: A 3D digital representation of the famous DTMB 4119 ship propeller, showing the four metal blades designed for marine travel.
Simulation Process: VOF Multiphase and Polyhedral Meshing Setup
To begin this Ship Propeller Cavitation fluent project, we built an exact 3D model of the DTMB 4119 propeller. This specific digital model has a total diameter of exactly 0.3 meters. We placed this propeller inside a large cylinder of virtual sea water. Next, we used the Fluent meshing tool to cut the water volume into exactly 5,862,460 small polyhedral and hexahedral cells.
To simulate the physical boiling of the water, we activated the Volume of Fluid (VOF) multiphase model combined with specific cavitation modeling tools inside the software. We instructed the computer solver that the liquid water will evaporate into vapor gas exactly when the local pressure drops below 2000.7 Pa. To simulate the spinning movement, we applied the Multiple Reference Frame (MRF) method. We set the rotational speed of the mathematical zone to exactly 2146 revolutions per minute (RPM). This perfect setup allows the computer to calculate the pressure changes and locate the exact bubbles safely.
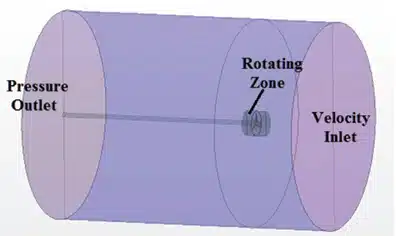
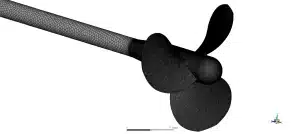
Figure 2: The 3D computer mesh grid, displaying the millions of polyhedral cells wrapping tightly around the propeller shaft and blades.
Post-processing: Analysis of Hydrodynamic Pressure and Vapor Volume
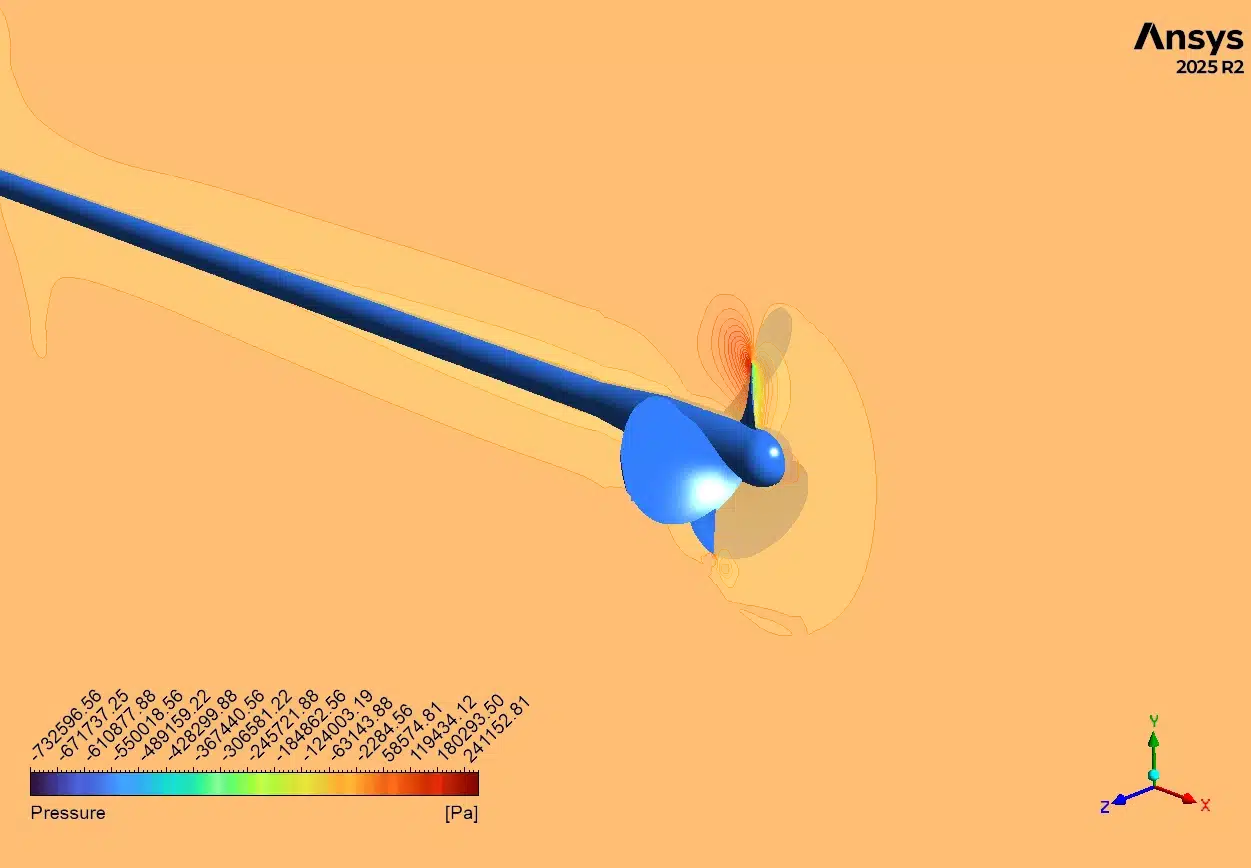
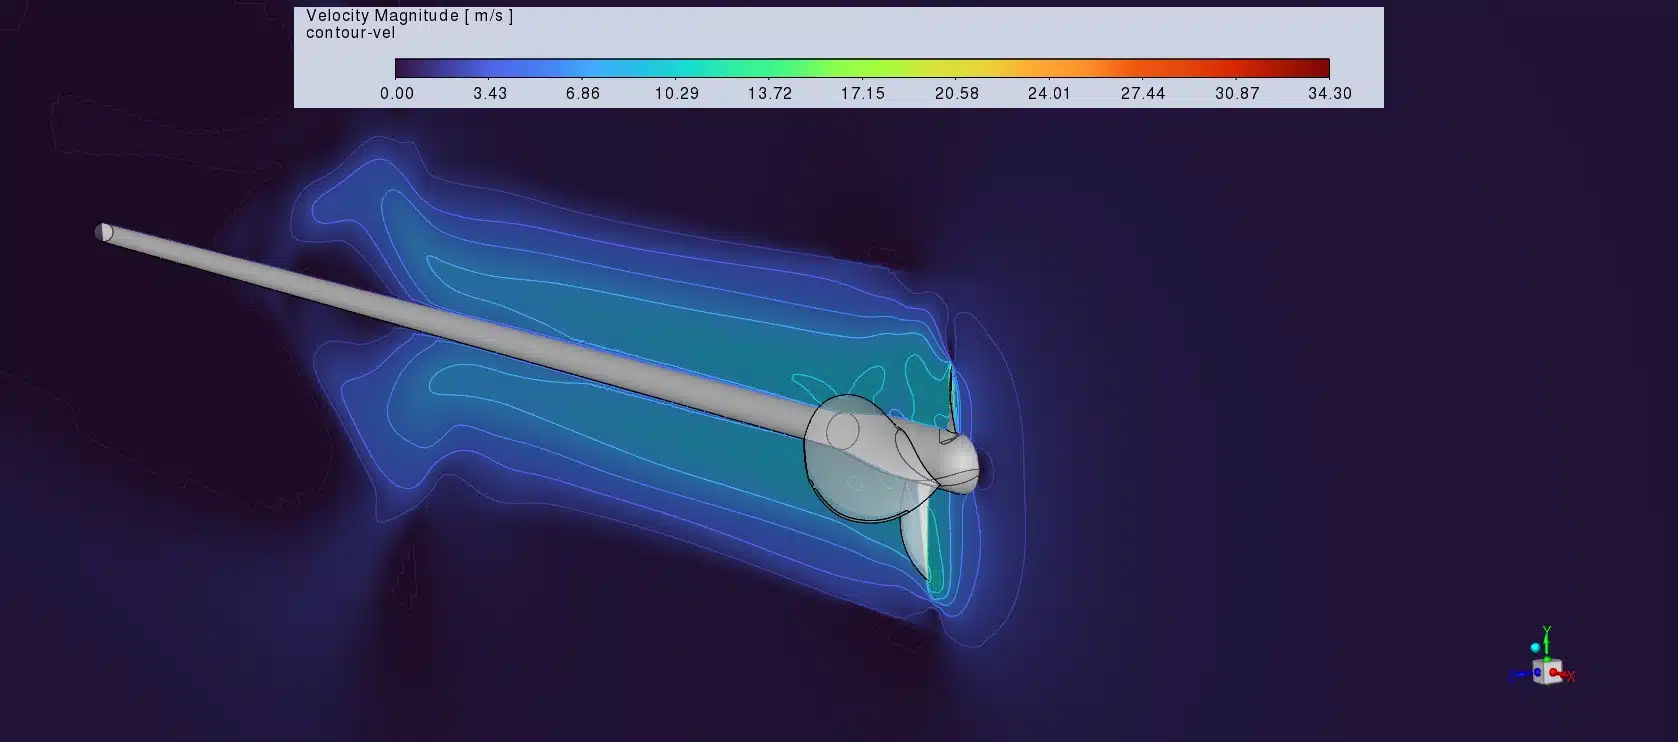
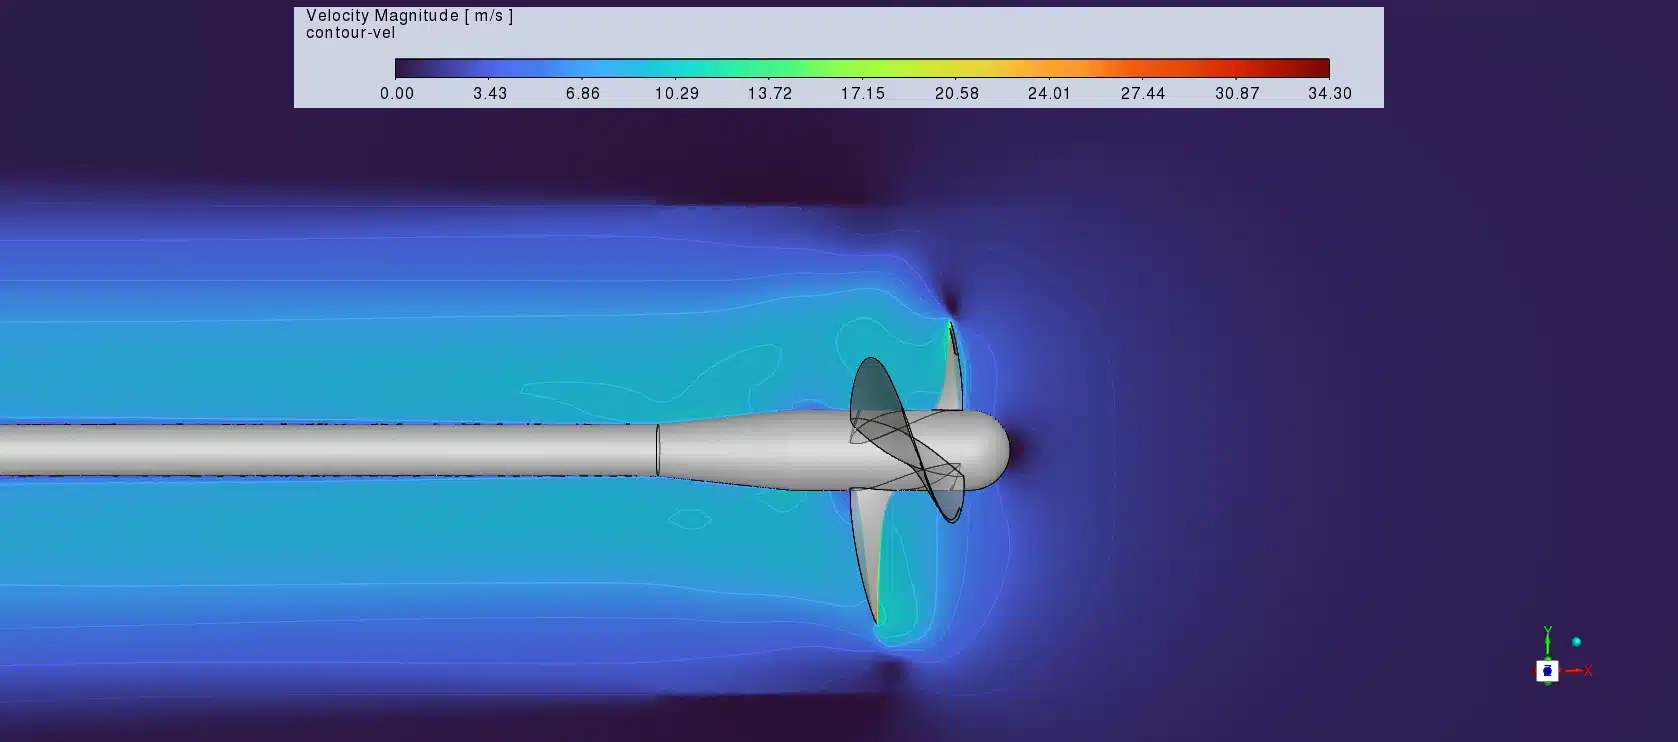
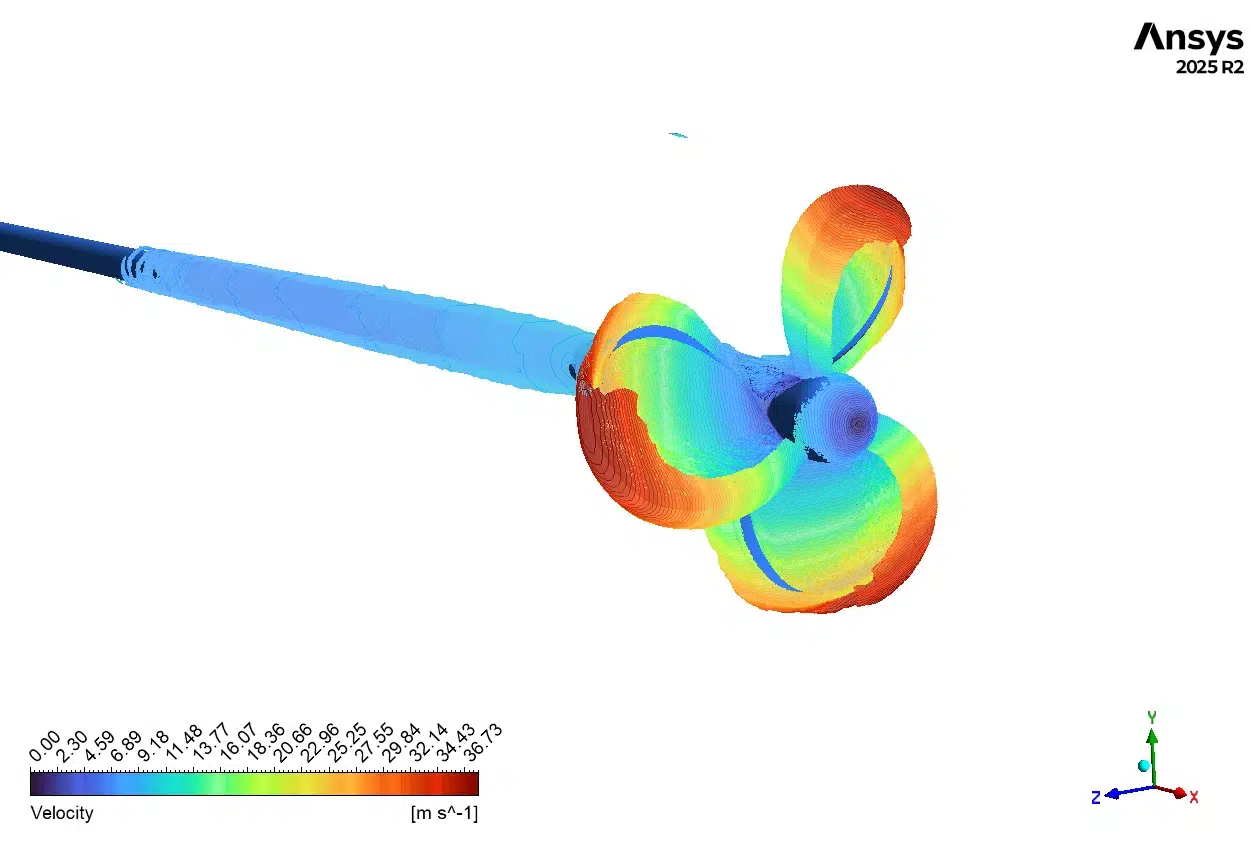
To completely understand the propeller design, we must carefully analyze the exact computer numbers and the fluid contours. This continuous scientific analysis explains exactly how the spinning blades drop the water pressure and why the vapor bubbles form. We begin by examining the velocity and pressure contours. As the propeller spins at 2146 RPM, the water hits the front of the blades and accelerates over the curved back surface. Engineers call this back surface the suction side. The visual computer contours show dark blue zones exactly on the suction side, specifically near the sharp leading edges and the blade tips. In fluid mechanics, high water speed creates very low static pressure. The dark blue color proves that the local pressure in these specific zones drops violently below the natural boiling limit of 2000.7 Pa.
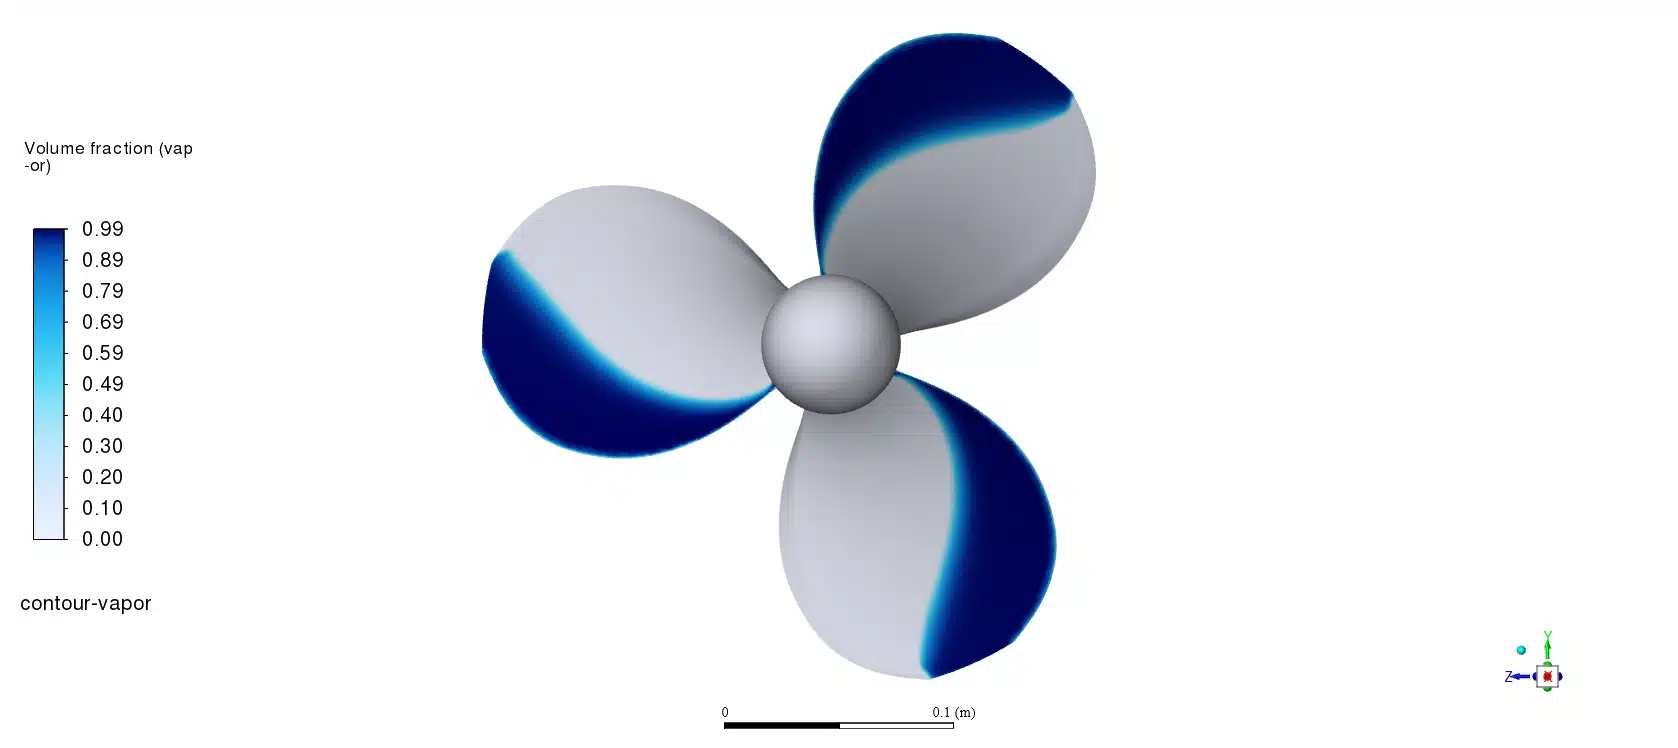
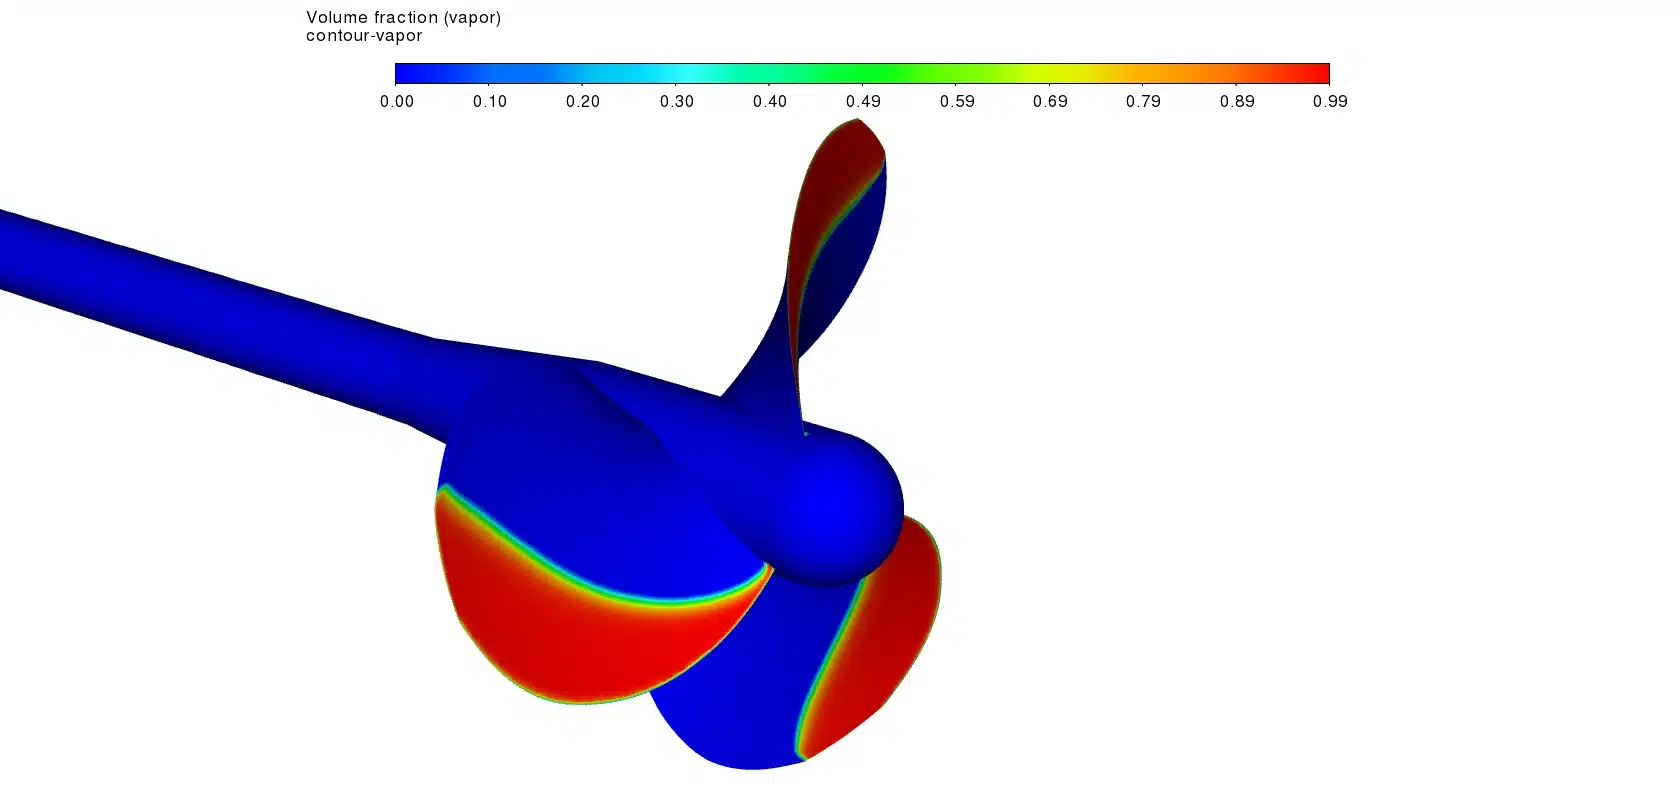
Because the pressure falls below 2000.7 Pa, the physics of phase change begins. The liquid water tears apart and transforms into vapor gas. To measure this damage exactly, the software calculates the precise vapor volume fraction. The solver output provides a highly specific average-vapor value of 0.11682379. In numerical simulation of propeller cavitation, this exact number is a critical discovery. The value 0.11682379 means that, on average, 11.68% of the measured fluid space around the active blade surfaces has turned entirely into vapor gas. This is a moderate but highly significant level of cavitation. We must correlate this exact 11.68% value directly to the visual contours to understand its root cause. The physical geometry of the blade forces this specific result.
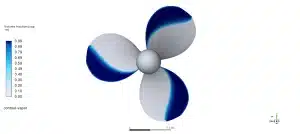
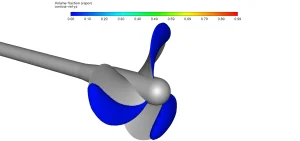
Figure 3: Vapor volume fraction contour, visualizing the exact locations of the sheet cavitation on the blade faces and vortex cavitation near the tips.

Figure 4: Static pressure contour, illustrating the dark blue low-pressure zones on the suction side where the pressure drops below the boiling point.
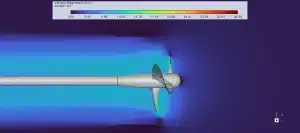
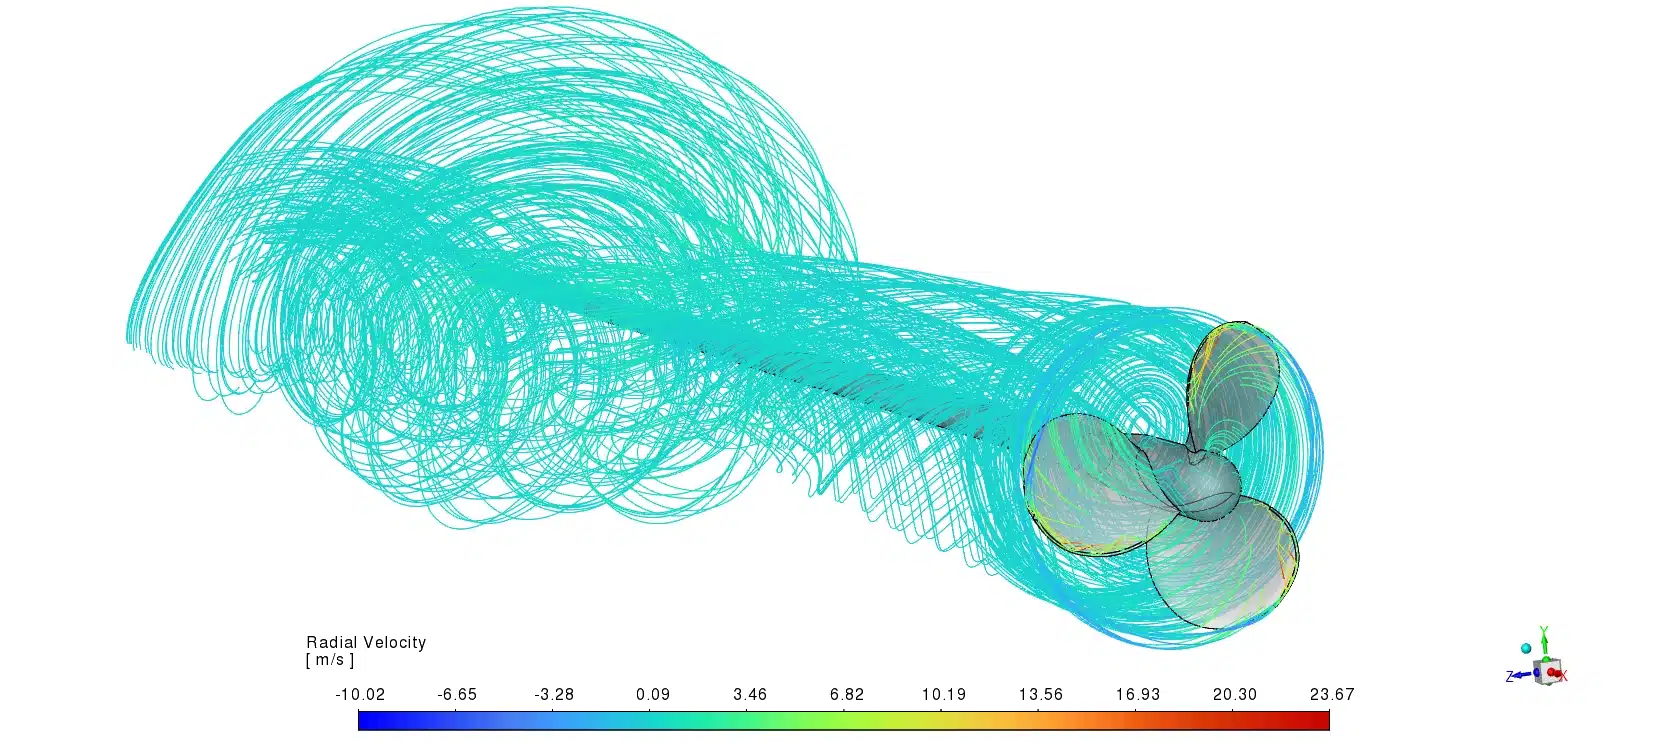
Figure 5: Velocity magnitude contour, showing the extreme acceleration of water exactly over the sharp leading edges of the curved blades.
The visual vapor contours clearly explain the source of this 0.11682379 average. First, we observe a continuous thin layer of vapor covering the suction side of the blades directly behind the leading edges. This specific pattern is called sheet cavitation. The sheet cavitation contributes heavily to the average vapor calculation because it covers a large physical area. Second, the contours highlight twisting tubes of vapor gas leaving the very tips of the blades. These are called tip vortices. Because the blade tip has a sharp geometry, the water spins in a tight circle, creating extreme low pressure in the center of the vortex. This vortex cavitation adds a highly concentrated amount of vapor gas into the water. Therefore, the exact average-vapor value of 0.11682379 is the direct mathematical sum of the large sheet cavitation on the blade face and the concentrated vortex cavitation at the blade tips.
For a marine manufacturing factory, this accurate hydrodynamic cavitation data is incredibly useful. An average vapor fraction of nearly 11.7% indicates that the propeller will suffer from noticeable thrust breakdown. The large volume of bubbles will disrupt the smooth flow of water, meaning the engine must burn more fuel to maintain the ship’s speed. Furthermore, when this 11.7% vapor volume moves away from the low-pressure zones, it will violently collapse back into liquid. This collapse will slowly erode the metal and cause the boat to vibrate. By identifying the exact root cause of the 0.11682379 vapor fraction, engineers can modify the design. They can use the computer to gently change the twist angle of the blade or make the leading edges slightly thicker. These small changes will lower the water speed, keep the pressure above 2000.7 Pa, and completely eliminate the vapor bubbles.
Frequently Asked Questions (FAQ)
- What does an average-vapor value of 0.11682379 mean?
- A: This exact value means that 11.68% of the calculated volume around the blade surface has turned into vapor gas. This gas is created by a combination of sheet cavitation on the main blade and vortex cavitation at the blade tips.
- Why does water boil on a cold propeller?
- A: In fluid mechanics, boiling is controlled by pressure, not just temperature. Because the spinning blades make the water move extremely fast, the local pressure drops below 2000.7 Pa. At this extremely low pressure, even cold ocean water instantly boils into vapor.


Reviews
There are no reviews yet.