


A Darrieus Vertical Axis Wind Turbine (VAWT) is a special kind of wind turbine that can catch wind from any direction. This makes them very useful for producing clean energy. To design better turbines, engineers use computer simulations. A Darrieus Vertical Axis Wind Turbine (VAWT) CFD simulation lets us study the aerodynamic performance of the blades. It is very important to prove that our computer model is correct. This is called a VAWT CFD Validation. We do this by comparing our results to a trusted research paper. In this study, we use ANSYS Fluent to create a simulation of a Darrieus turbine. We will then check our results against the famous paper by Castelli [1] to make sure our model is accurate.
- Reference [1]: Castelli, Marco Raciti, Alessandro Englaro, and Ernesto Benini. “The Darrieus wind turbine: Proposal for a new performance prediction model based on CFD.” Energy8 (2011): 4919-4934.
Figure 1: The 3D experimental setup of the Darrieus turbine, as shown in the reference paper for this Darrieus CFD Validation [1].
Simulation Process: Fluent Setup, Modeling Turbine Rotation with Sliding Mesh
To begin our VAWT Fluent simulation, we created a 2D model of the wind turbine’s domain. The turbine blades use a special shape called a NACA 0021 airfoil. Because the turbine spins, this is a transient simulation, meaning it changes over time. The most important part of the setup was modeling the rotation. In ANSYS Fluent, we used the sliding mesh technique. This creates a circular zone around the turbine that spins, while the area far away from the turbine stays still. This lets us accurately model how the moving blades interact with the wind. We also created a very fine mesh around the blades to correctly capture how the air flows over them.

Figure 2: The computational mesh with a detailed view of the boundary layer around the blades for the Sliding Mesh Fluent simulation.
Post-processing: CFD Validation, Comparing Power Curves and Flow Physics
The validation graph provides a clear, professional visual that proves our computer model is highly accurate. The graph compares the power coefficient (Cp), which measures how much energy the turbine captures, at different speeds. Our simulation results almost perfectly match the data from the Castelli paper [1], with a difference of less than 2%. The professional visual shows that the turbine’s power is low at slow speeds but increases to a maximum when the tip of the blade is moving 2.5 times faster than the wind (a Tip Speed Ratio of 2.5). At this perfect speed, our turbine captured 57% of the wind’s energy. This matching “hill-shaped” curve is the most important proof that our simulation method is correct.
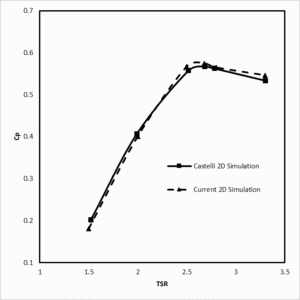
Figure 3: Power coefficient (Cp) validation graph for the Darrieus VAWT CFD Validation, comparing our simulation with the reference data [1].
The velocity and pressure contours explain why the turbine produces power. As the blades spin through the air, they create areas of high pressure on the front side and low pressure on the back side. This pressure difference creates a force that pushes and pulls the blades around, causing the turbine to spin. The velocity contour shows the wind speed changes from 0 to 38.9 m/s as it flows around the blades. The pressure contour shows forces ranging from a strong pull of -1176.5 Pascals to a push of 554.4 Pascals. These forces work together to create torque and generate power. The most important achievement of this simulation is the successful validation of our CFD model, which proves that we can accurately predict the real-world power output of a Darrieus VAWT, allowing engineers to design and test new, more efficient turbines on a computer before building expensive physical prototypes.
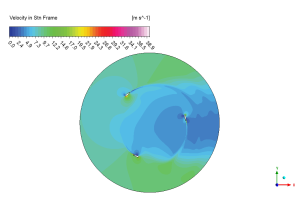
Figure 4: elocity contours showing flow distribution around the Darrieus VAWT
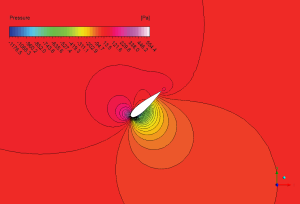
Figure 5: Velocity and pressure contours from the VAWT CFD analysis, showing the aerodynamic forces that drive the turbine’s rotation.


Reviews
There are no reviews yet.