


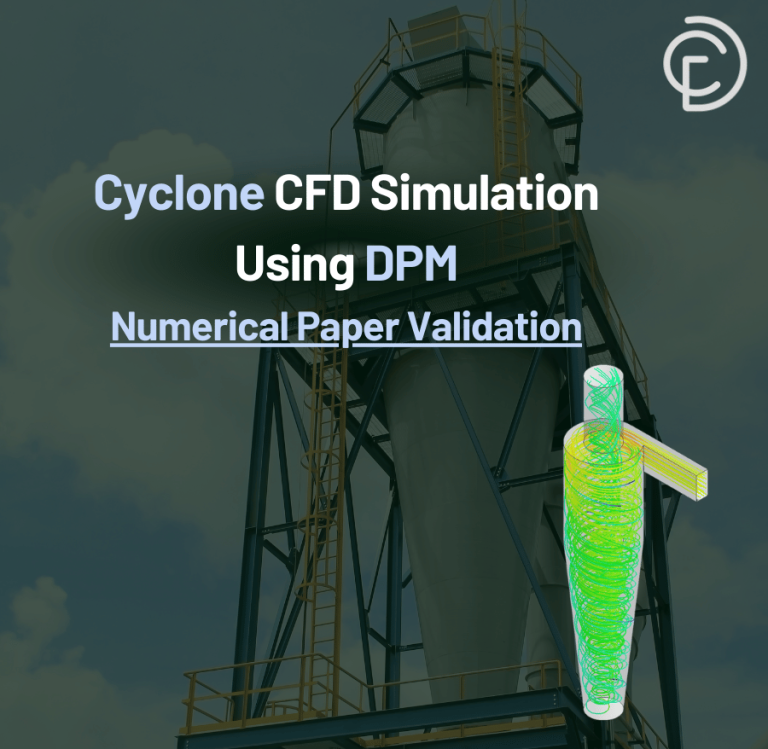
Cyclone separators are workhorses in many industries, but they face a serious enemy: erosion. The same high-speed particles they are designed to capture can also wear away the cyclone’s internal walls. This damage leads to expensive repairs, equipment failure, and costly downtime. An Erosion Inside Cyclone Separator CFD simulation is the best engineering tool to predict exactly where and how this damage will happen. By using ANSYS Fluent, we can visualize the flow and particle paths to identify high-risk areas. This report details a study of a Stairmand cyclone, based on the reference paper [1], to understand the root causes of erosion and improve the cyclone’s design for a longer life.
- Reference [1]: Dizajyekan, Sajed Naiemi, et al. “Evaluation of centrifugal force, erosion, strain rate, and wall shear in a Stairmand cyclone.” Processes5 (2022): 994.
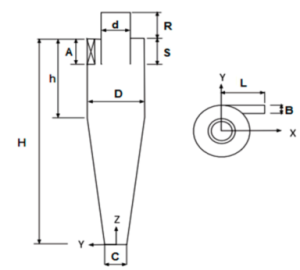
Figure 1: Schematic of the Stairmand cyclone separator geometry used in this Cyclone Erosion CFD analysis [1].
Simulation Process: Modeling the Cyclone Erosion Fluent Simulation
The simulation process began with building a 3D model of the Stairmand cyclone. This geometry was then filled with a high-quality structured grid containing 228,225 cells to ensure accurate calculations. A good mesh is the foundation for a reliable result.
To capture the complex physics inside the cyclone, the Reynolds Stress Model (RSM) was used for turbulence. RSM is a powerful 7-equation model that is highly accurate for predicting the intense, swirling flows that are found in cyclones. The solid particles were tracked using the Discrete Phase Model (DPM), which calculates the path of each individual particle. Critically, the DPM Erosion Model was activated to measure the wear caused by particle impacts on the walls. The entire Erosion Inside Cyclone Separator Fluent simulation was run as transient, which means we can observe the erosion process as it develops over time.
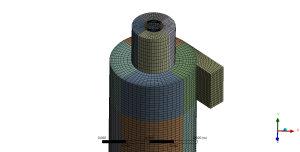
Figure 2: The structured grid used for the Cyclone Erosion fluent simulation.
Post-processing: CFD Analysis, How Flow Dynamics Cause Wall Erosion
The simulation results provide a clear and fully substantiated story that begins with the gas flow, which is the “cause” of all erosion. The velocity contour in Figure 4 shows that the tangential inlet creates a powerful, high-speed vortex, with velocities reaching 20.9 m/s near the cyclone wall. This is not just a simple spinning motion; the vorticity contour shows magnitudes up to 2980 s⁻¹, indicating an extremely intense and organized swirling flow. This powerful, high-energy vortex field is the engine that drives the erosion process. It generates a massive centrifugal force that grabs the solid particles and controls their every move. The calculated pressure drop of 416.10 Pa is a direct measure of the energy consumed by this violent, swirling flow.

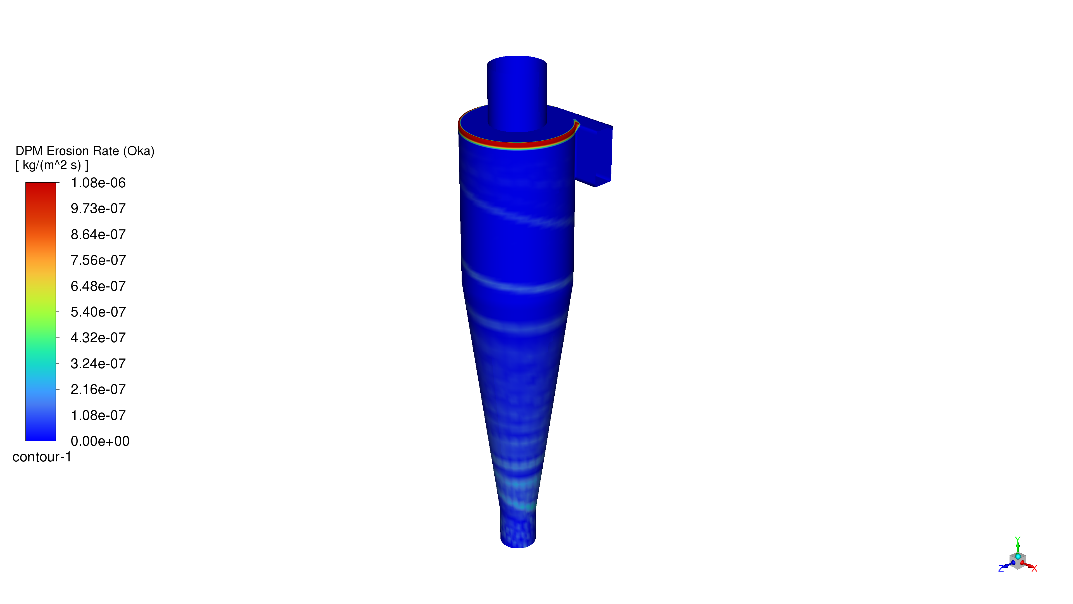
Figure 3: Erosion rate contour from the Erosion Inside Cyclone Separator CFD simulation, identifying the highest-risk areas for wear.
This intense flow field has a direct, destructive “effect” on the cyclone walls, which is perfectly captured by the Cyclone Erosion CFD model. The centrifugal force from the vortex acts like a sling, throwing the solid particles outward at high speed. The erosion contour in Figure 3 shows the direct result: a very high erosion rate of 1.31e+00 kg/m²s is concentrated in two specific locations. The first is at the bottom of the conical section, where the downward-spiraling particles repeatedly scrape and impact the wall. The second is on the vortex finder, where particles that haven’t been separated are forced to change direction suddenly, causing them to collide with its surface. This is not random wear; it is predictable damage caused by the fluid dynamics. The most significant achievement of this simulation is the direct, quantitative link it establishes between the high-velocity, high-vorticity flow field and the predictable, localized erosion patterns, providing invaluable engineering data to reinforce critical areas and extend the cyclone’s operational lifespan.
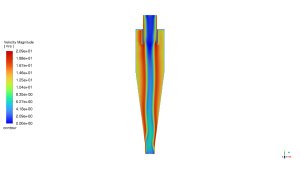
Figure 4: Velocity magnitude contour, showing the high-speed flow that drives the particles and causes erosion.


Reviews
There are no reviews yet.