
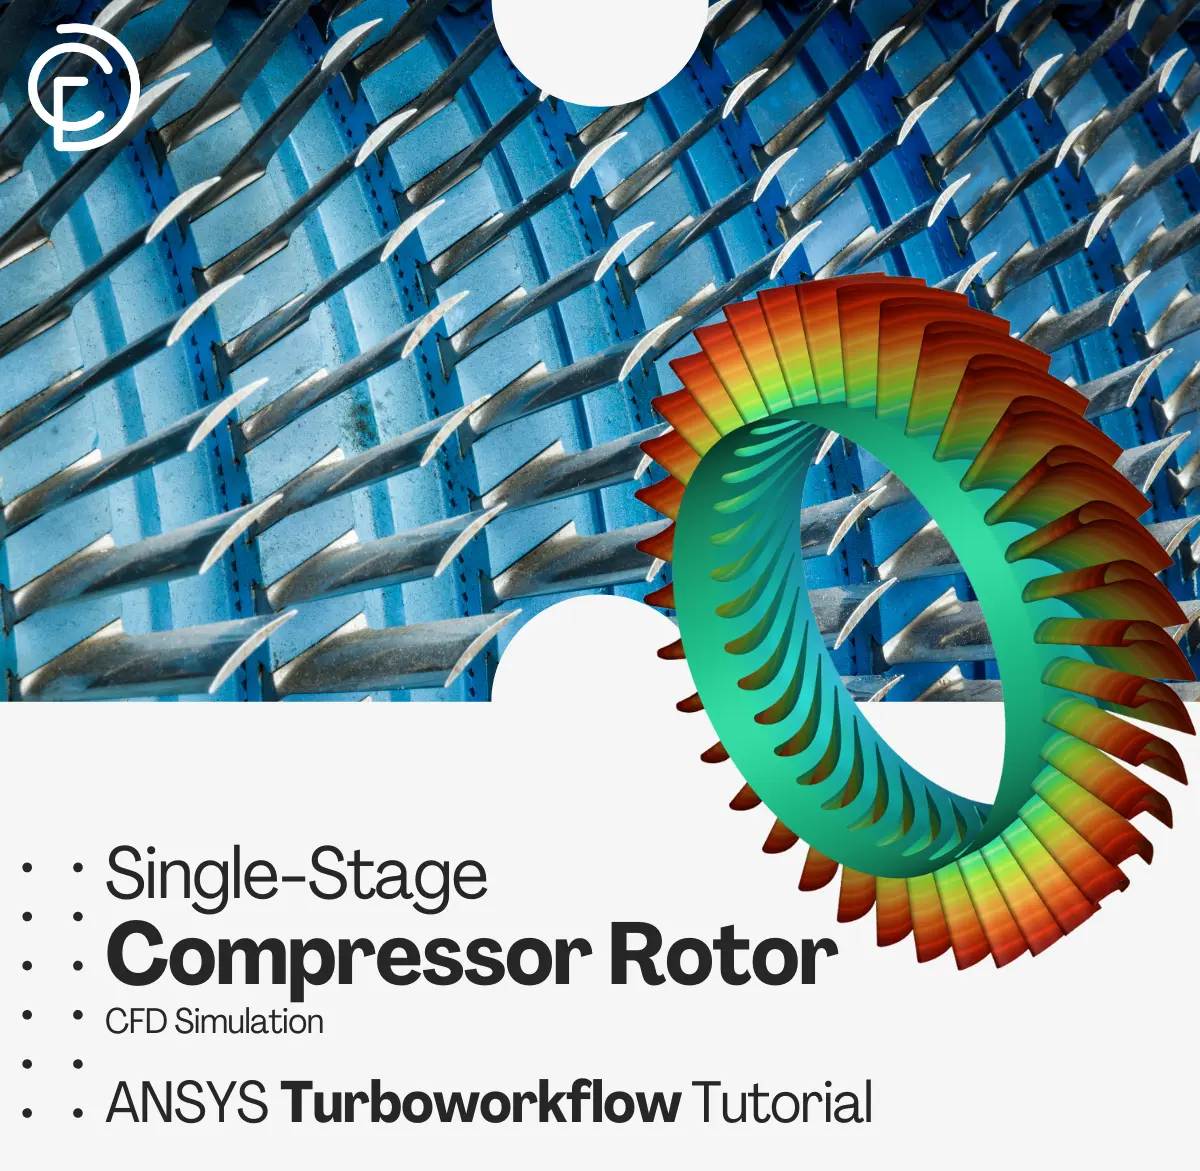


Axial Compressors are vital parts in jet engines, and how well they work directly affects engine performance and fuel use. Simulating these turbomachineries is challenging because of the complex airflow patterns that develop around the blades. NASA Rotor 37 is a well-known test case that engineers use to check if their simulation methods work correctly. This rotor comes with detailed test data that helps verify computer predictions. Our study uses ANSYS Fluent’s Turbo Workflow tools to make the simulation process easier and faster. The software helps with creating the model, making the mesh, and solving the equations in ways that work well for rotating machinery. Our simulation looks at how air moves through the compressor, focusing on pressure changes, air speeds, and shock waves that form when air moves very fast.
- Reference [1]: Reid, Lonnie. Performance of single-stage axial-flow transonic compressor with rotor and stator aspect ratios of 1.19 and 1.26, respectively, and with design pressure ration of 1.82. Vol. 1338. National Aeronautics and Space Administration, Scientific and Technical Information Office, 1978.
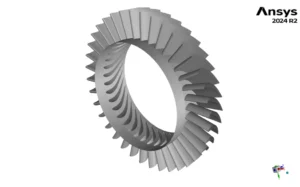
Figure 1: Axial compressor single stage designed for current study
Simulation Process
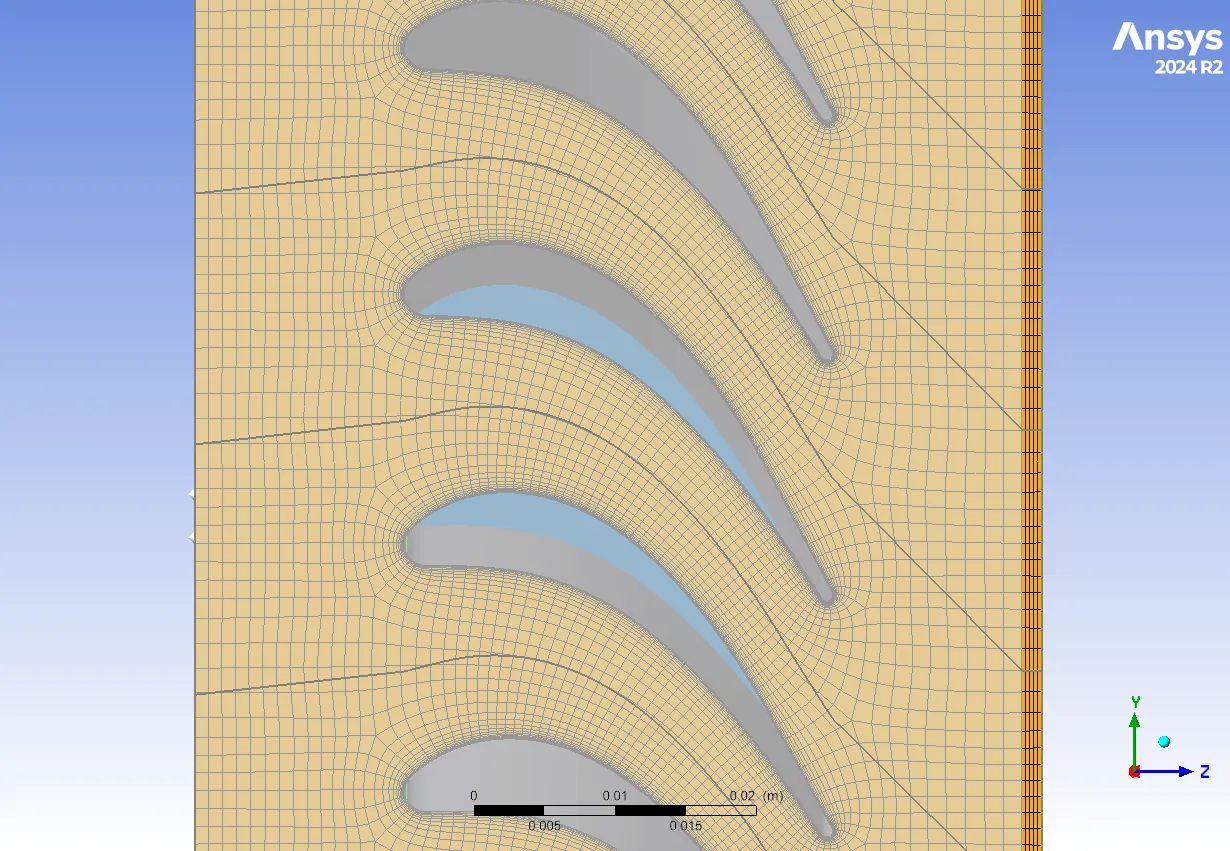
The 3-D domain of this simulation has been designed in ANSYS BladeGen Domain has inlet and outlet and also hot zone wall and inner wall for wire inside and outer wall as pipe shell. The meshing of this present model has been generated by ANSYS TurboGrid software. The mesh grid is unstructured and the total cell number is 68120 elements and 121031 nodes. the figure below shows an overview of the performed mesh. The simulation process strates with ANSYS TurboWorkFlow Module. The rotor row selected to simulate based on the generated grid. The CFD model generated automatically with Module and simple is ready to simulate. The one blade inserted and multiplied in row with periodic condition.
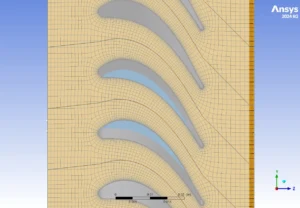
Figure 2: grid generated by ANSYS Turbogrid for axial compressor CFD simulation
Post-Process
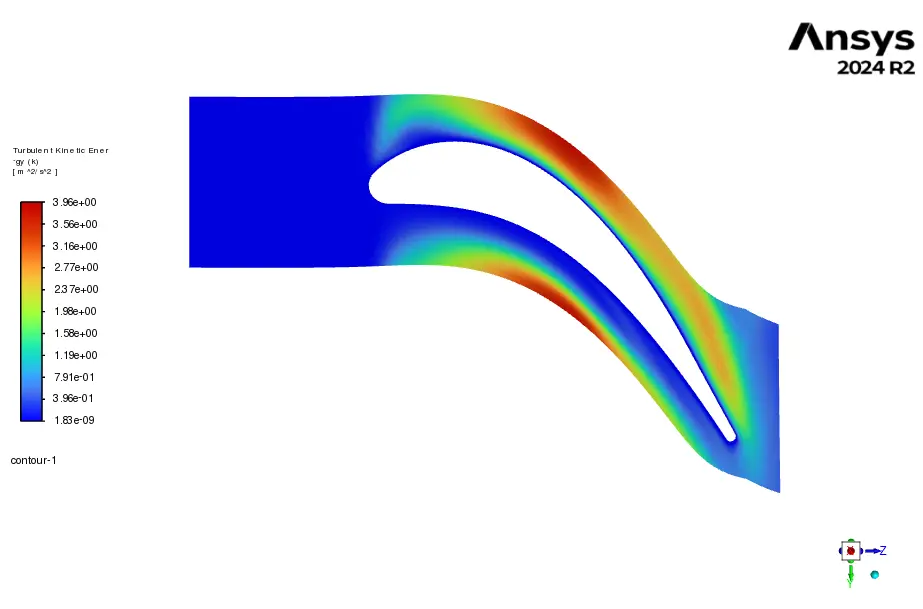
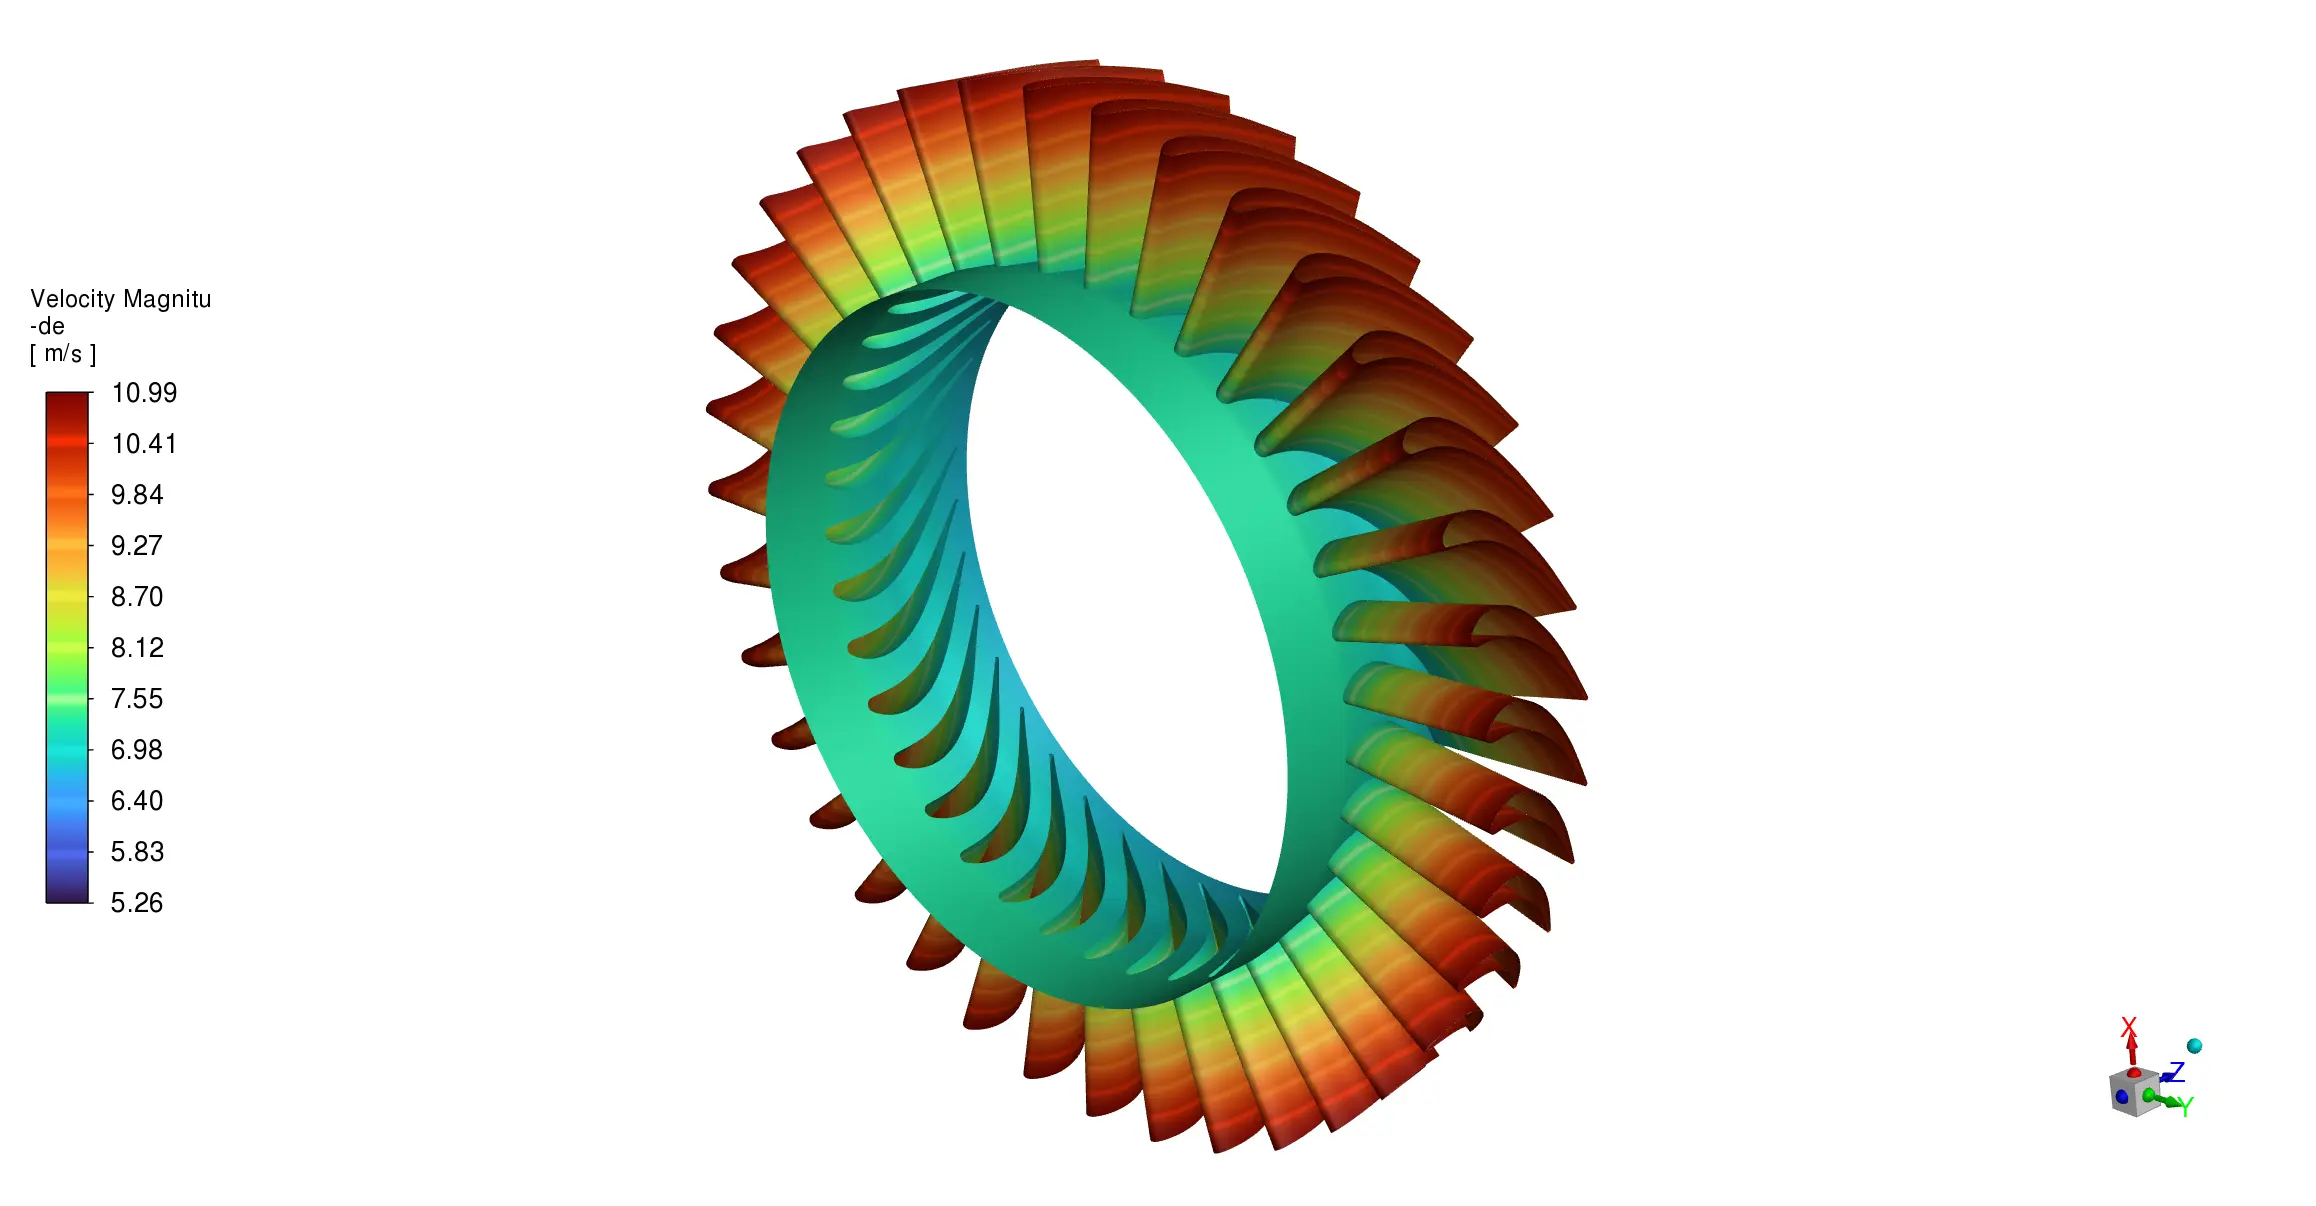
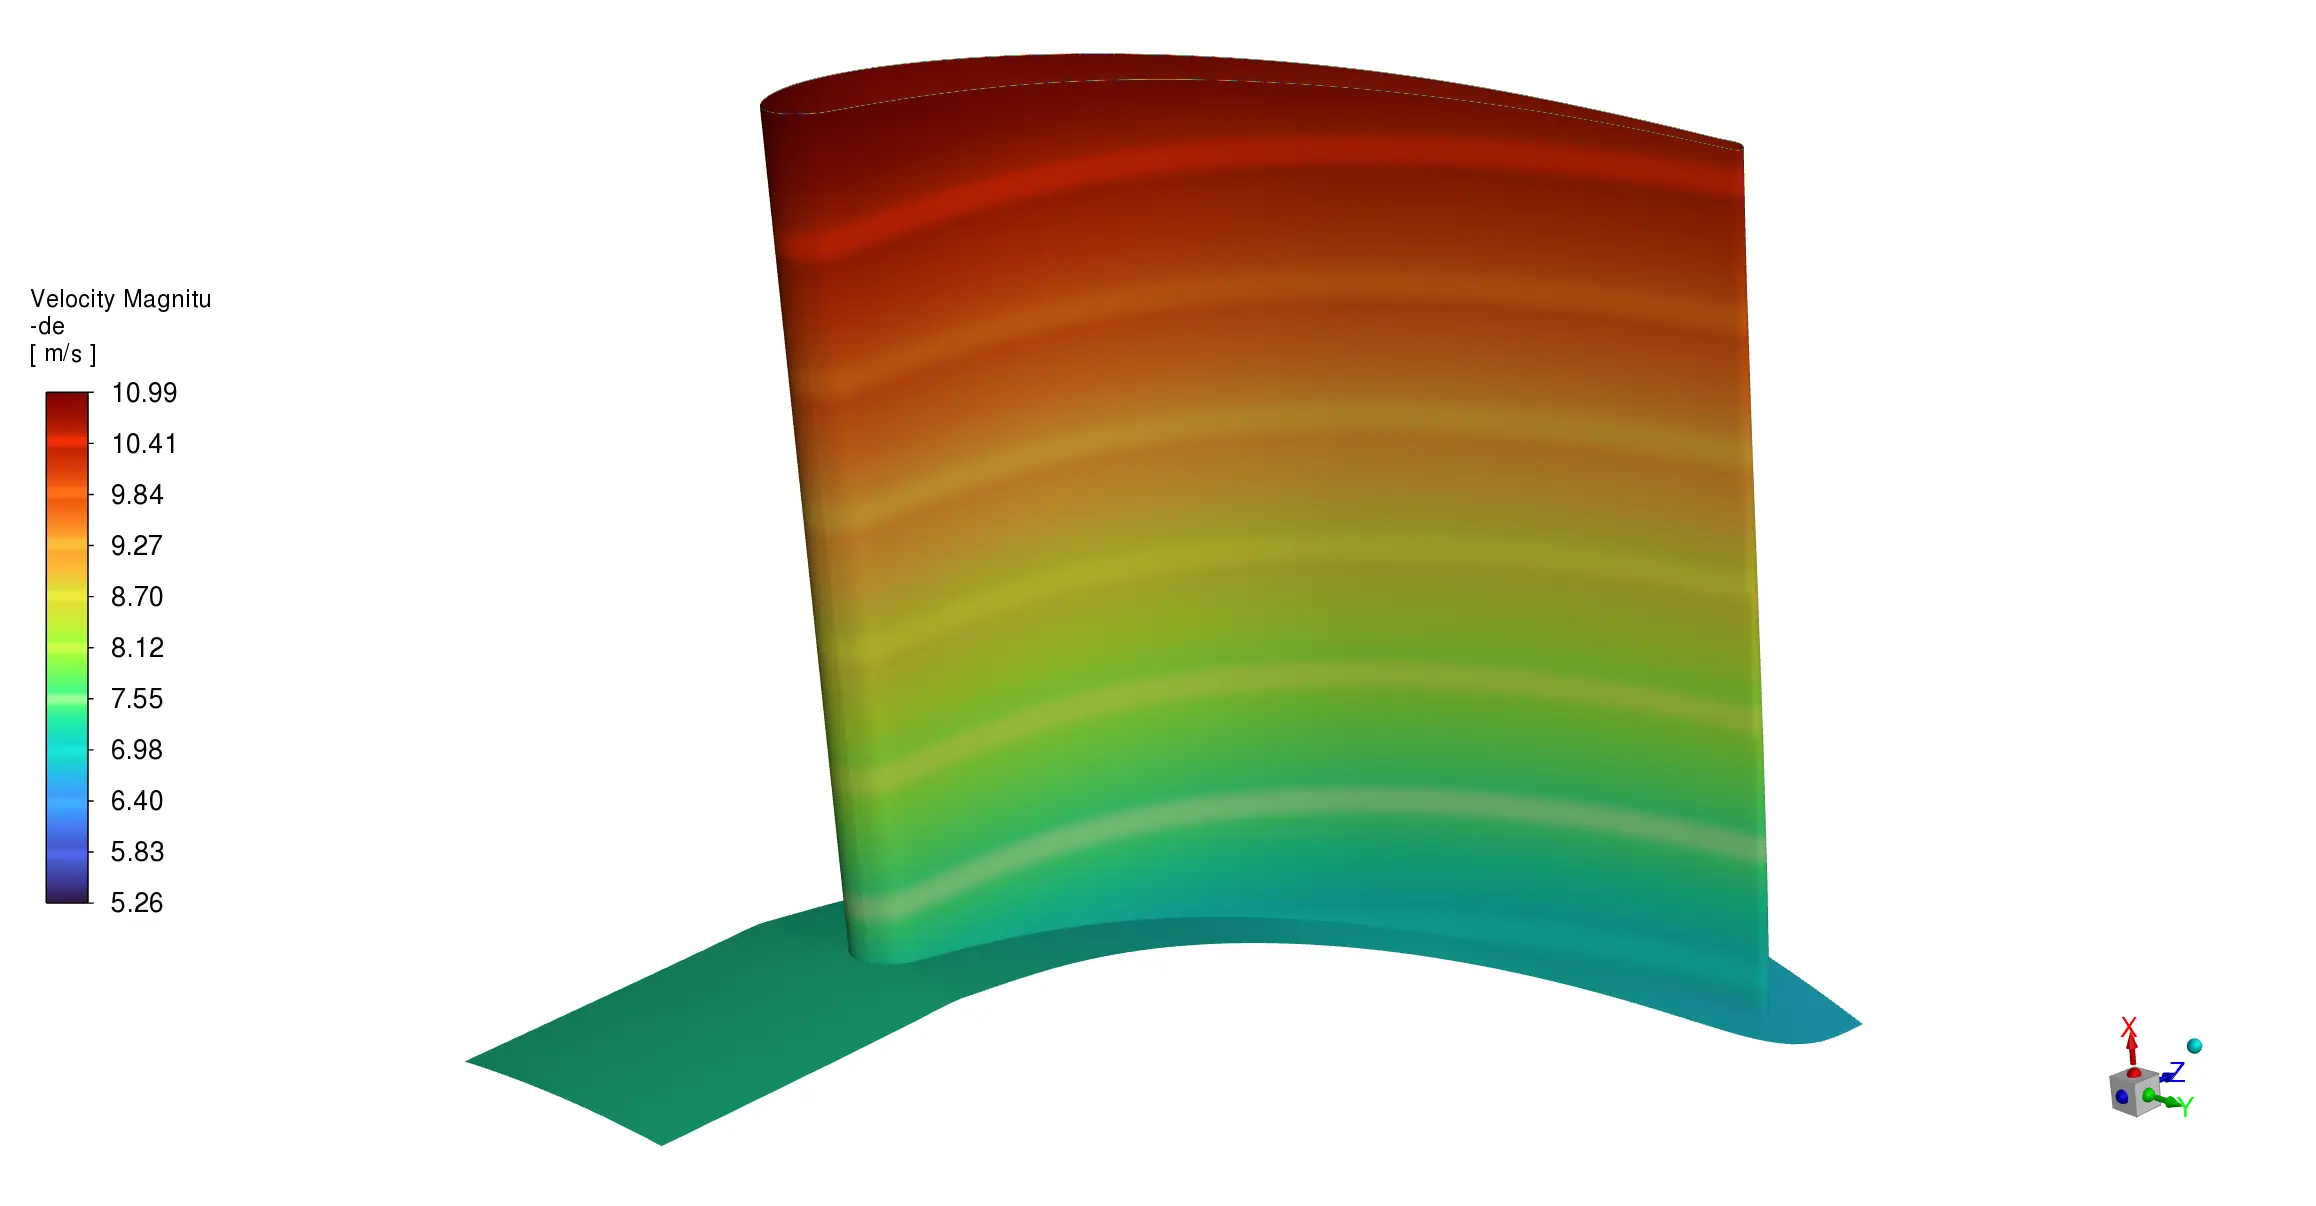
The velocity contour of the NASA Rotor 37 compressor shows a clear pattern of how air moves through the blades. Looking at the first image, we can see the highest speeds (10-11 m/s, shown in red and orange) occur at the blade tips and trailing edges, while slower speeds (6-8 m/s, shown in green) appear in the middle sections. This speed difference happens because the blade shape forces air to speed up as it passes through the narrow spaces between blades. The uniform pattern around the entire rotor confirms that the periodic boundary condition works correctly, making it possible to simulate just one section and apply it to the whole wheel. The detailed view in the third image reveals how velocity jumps from nearly zero (dark blue) at the leading edge to over 170 m/s (red) along the curved bottom surface of the blade, showing the dramatic acceleration that creates lift forces on the blades.

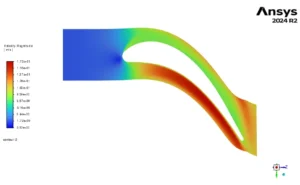
Figure 3: Velocity field around compressor rotor blade
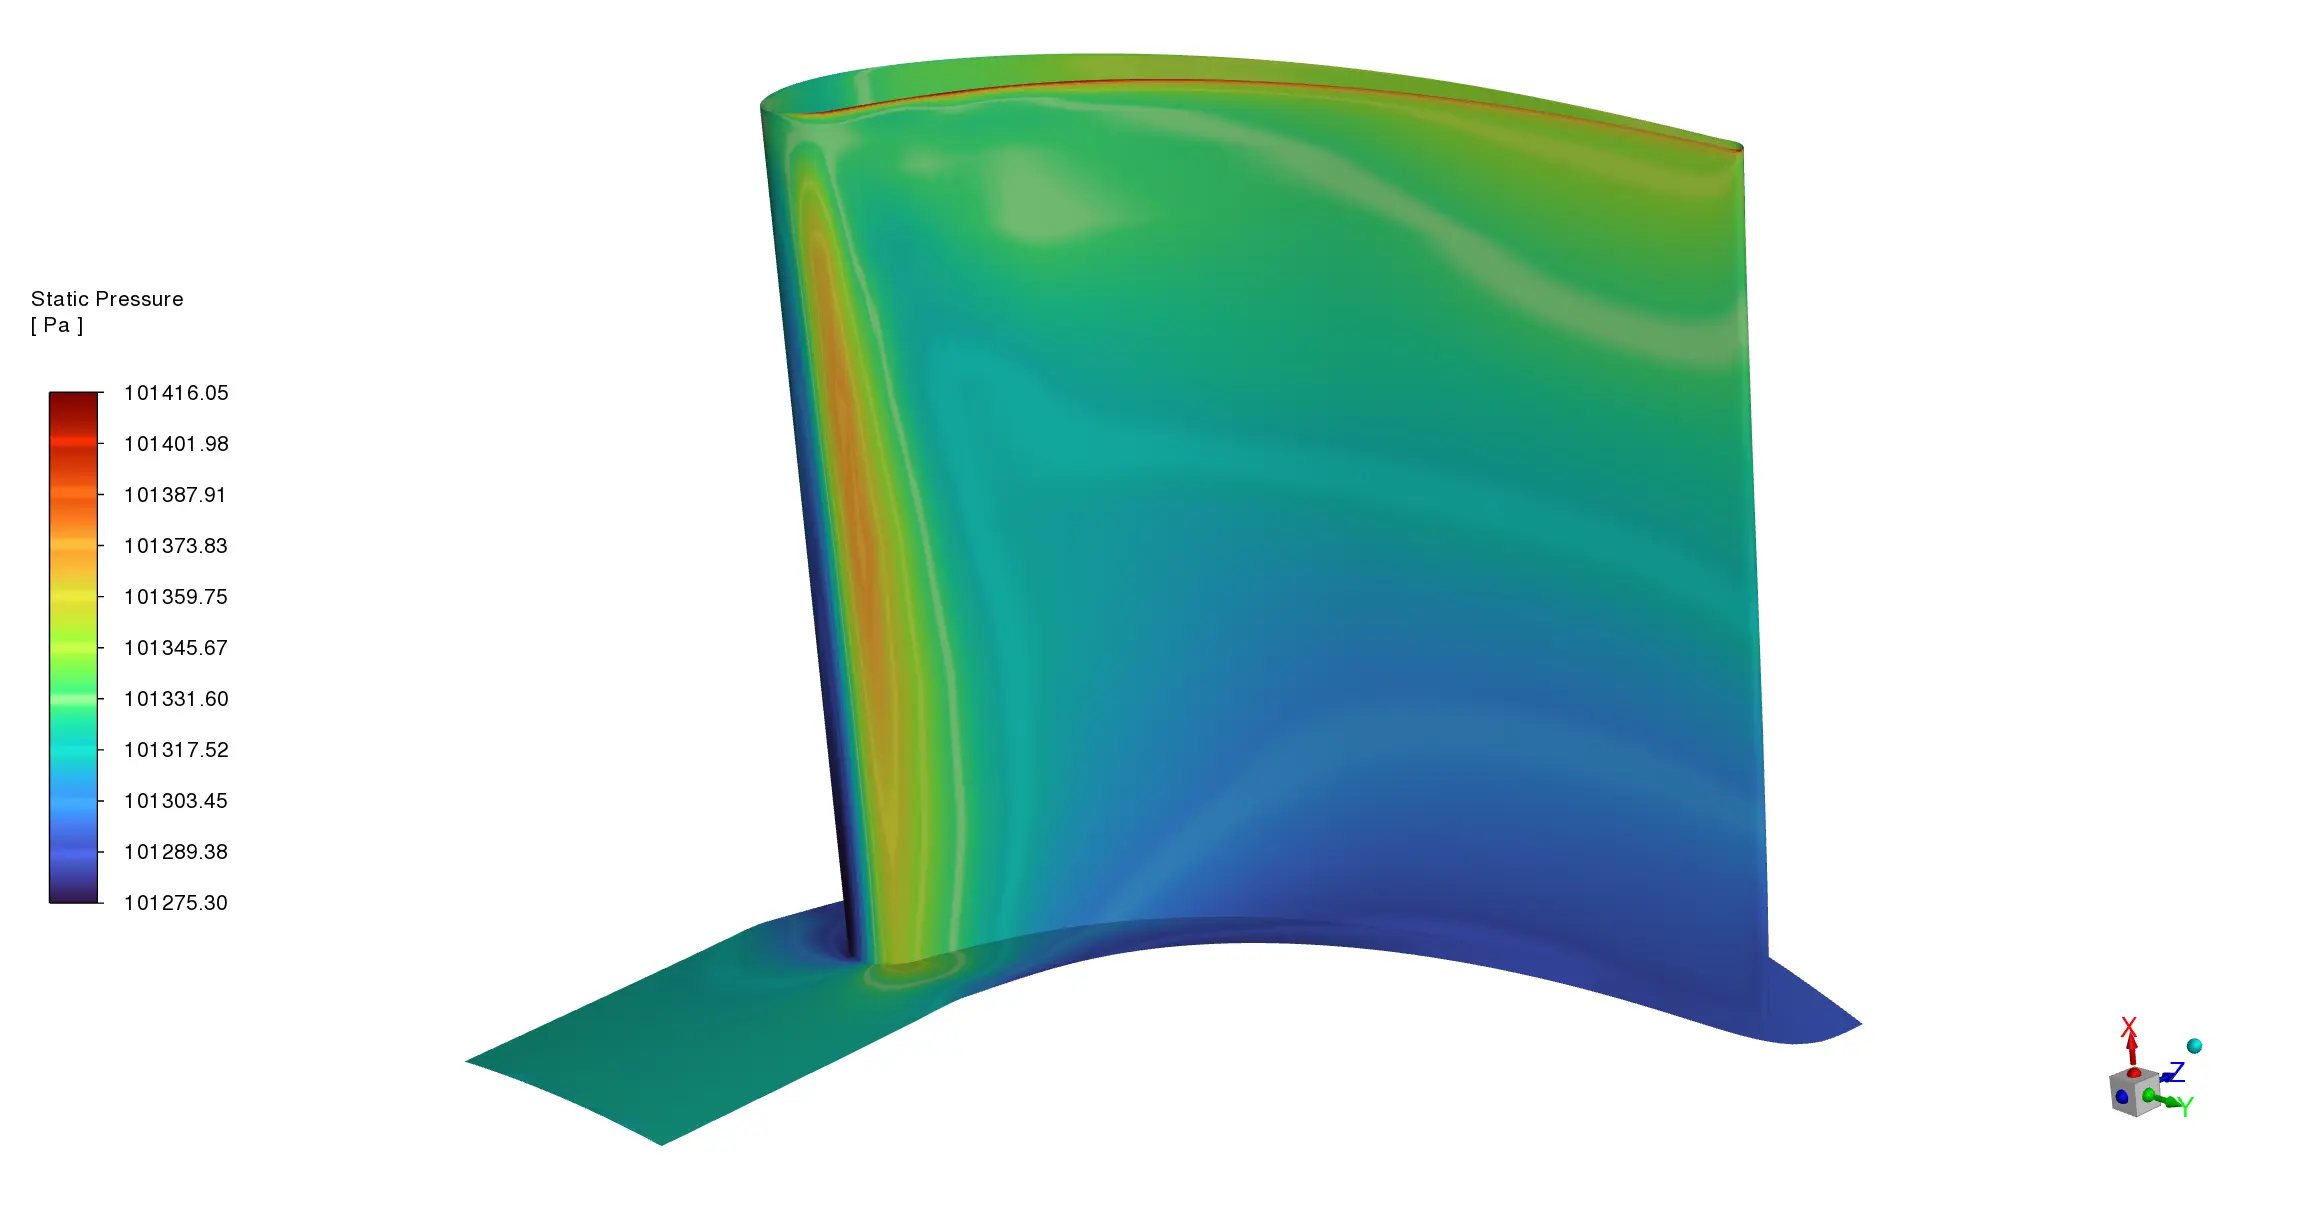
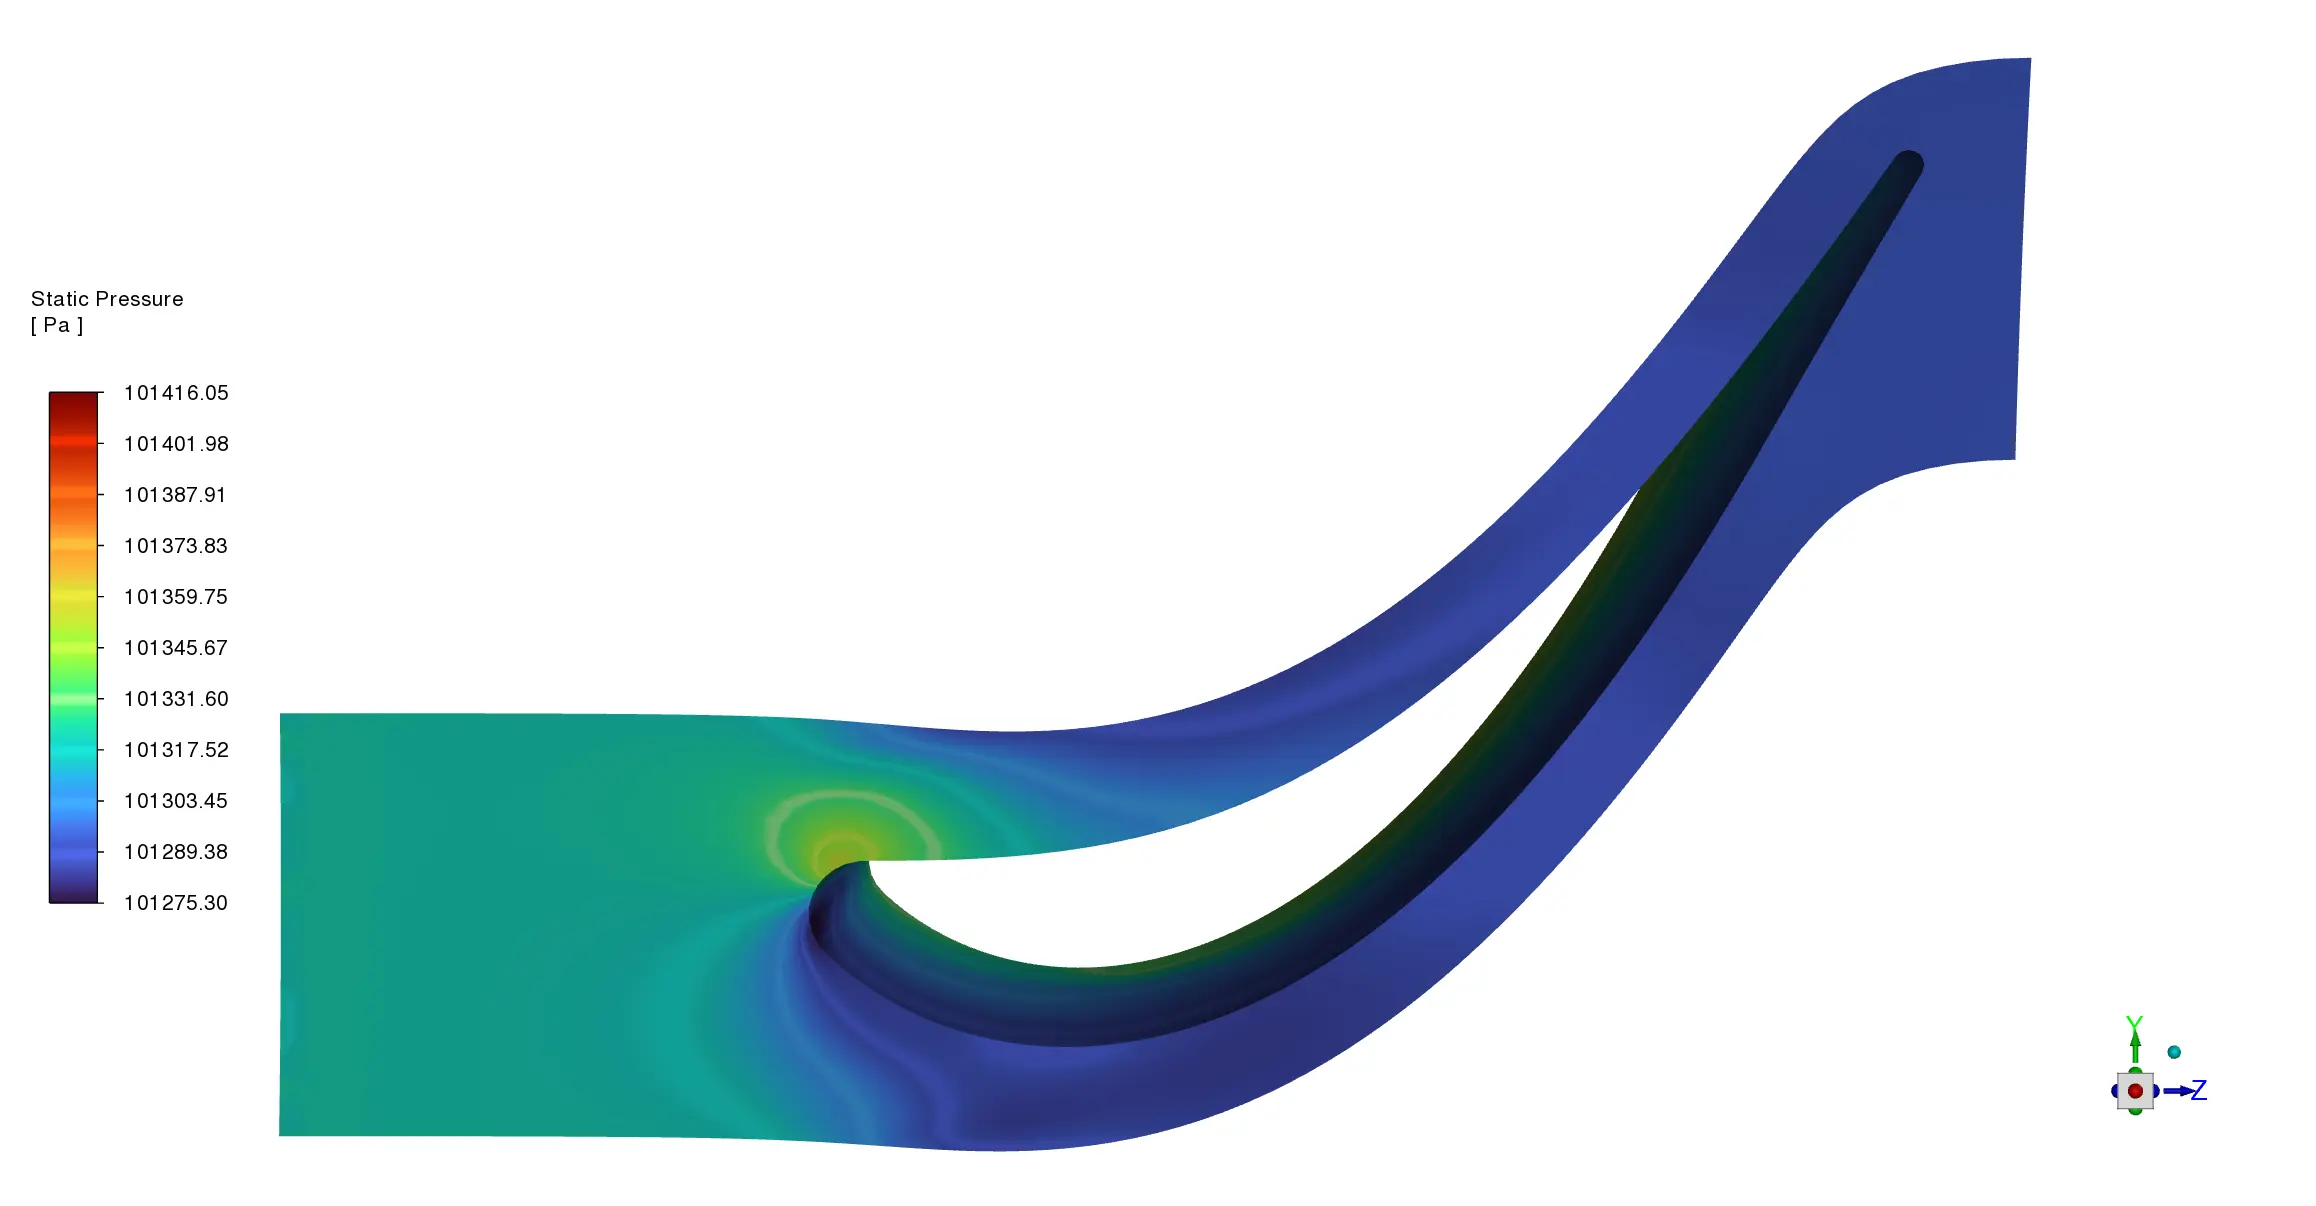
The pressure contour in the second image directly relates to the compressor’s main job – increasing air pressure. We can see lower pressure areas (around 101275-101300 Pa) on the curved underside of each blade, with higher pressure regions (101350-101400 Pa, shown in green-yellow) on the upper surfaces. This pressure difference of about 140 Pa across each blade is what drives the compression process. The pressure rises gradually from the front to the back of the rotor, confirming that the compressor is working properly to pressurize the airflow. The blade design creates this perfect balance of velocity and pressure changes, with the highest pressure (red areas) appearing exactly where the flow slows down after passing through the blade passages. This precise relationship between velocity and pressure follows Bernoulli’s principle and shows that the NASA Rotor 37 design efficiently converts kinetic energy into pressure rise.
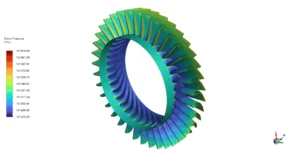
Figure 4: Pressure increment in compressor rotor stage


1 review for Single-Stage Compressor Rotor CFD Simulation | ANSYS Turboworkflow Tutorial
Memo –
Hello, i would like to know if this case can be done on ansys fluent student version 2026 R1 or 2025 R2 ?