


A Supersonic Jet Flow LES CFD simulation is a powerful computer model used to study the loud noise from high-speed jets, like those on fighter aircraft. When a jet moves faster than sound, it creates strong shock waves and intense turbulence, which are the sources of noise. A Supersonic Jet LES Simulation is the best tool for this because it can capture the small, chaotic movements of the air (turbulent eddies) that create this sound. This is known as an Acoustic fluent analysis.
This report details a LES Simulation CFD of a supersonic jet using ANSYS Fluent. The goal is to see exactly where the noise is created and how it travels. By using this Jet Acoustic CFD method, engineers can understand the physics of noise generation. This allows them to design quieter engines, which is critical for reducing environmental noise and improving aircraft design. For more advanced turbulence CFD simulations and LES modeling tutorials, visit CFDland Turbulence Simulations.
- Reference [1]: Norum, Thomas, and Martha Brown. “Simulated high speed flight effects on supersonic jet noise.” 15th Aeroacoustics Conference. 1993.
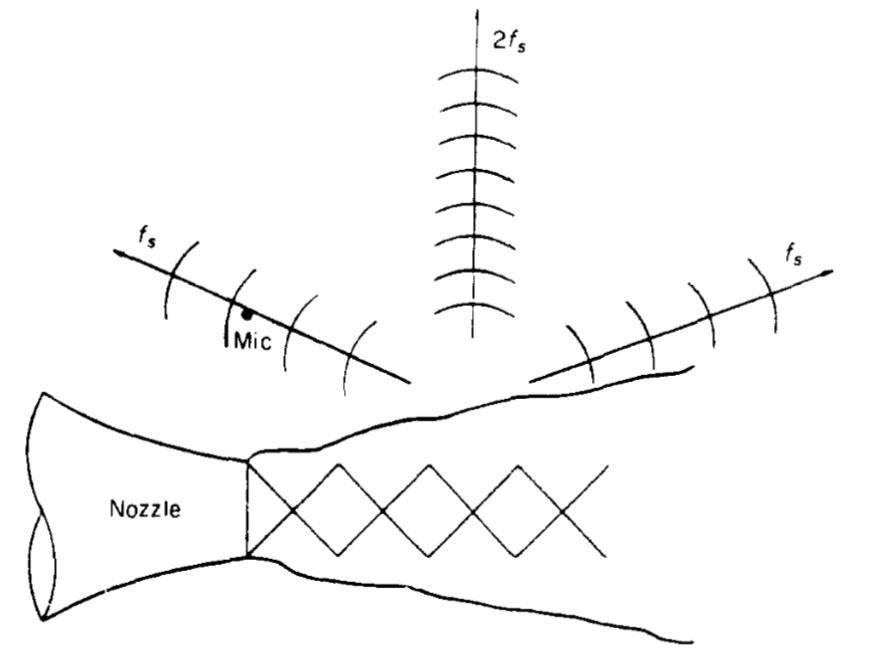
Figure 1: A diagram illustrating the concept of supersonic jet flow noise generation, the subject of this LES CFD simulation.
Simulation Process: Fluent-CFD Setup, A RANS-to-LES Workflow with Adaptive Meshing for Acoustics
The 3D jet flow geometry was created and meshed using ANSYS Fluent Meshing with two Bodies of Influence (BOIs). These BOIs in Fluent helped control mesh refinement near the jet core and shear layers where turbulence and acoustic sources are strongest. The CFD simulation started with a RANS turbulence model in ANSYS Fluent to get initial flow field conditions quickly. After the RANS solution converged, a mesh adaptation parameter was defined using the formula:
intergral_lenght_scale / cell-volume ^ (1/3)
This CFD mesh refinement criterion checks if any mesh cells have values below 5, indicating they are too coarse to capture turbulent eddies properly. Once the adaptive mesh refinement was complete, the Large Eddy Simulation (LES) was activated in ANSYS Fluent. The LES turbulence model directly resolves large turbulent structures in the supersonic jet flow, making it ideal for aeroacoustics predictions and noise analysis.
For acoustic measurements in this Fluent CFD simulation, two virtual microphones were positioned strategically. The first acoustic receiver was placed 0.1 meters above the jet inlet to capture near-field noise generated by jet turbulence and mixing layers. The second microphone was positioned at coordinates (0.2, 0.2) in a region with no flow velocity, allowing measurement of far-field acoustic pressure fluctuations without direct flow interference. These acoustic pressure monitoring points in ANSYS Fluent recorded sound pressure levels (SPL) over time as the LES solution progressed.

Figure 2: The high-quality polyhedral mesh with two Bodies of Influence (BOIs) used in Fluent Meshing to refine the grid in critical flow regions.
Post-processing: CFD Analysis of Flow Structures and Aeroacoustics
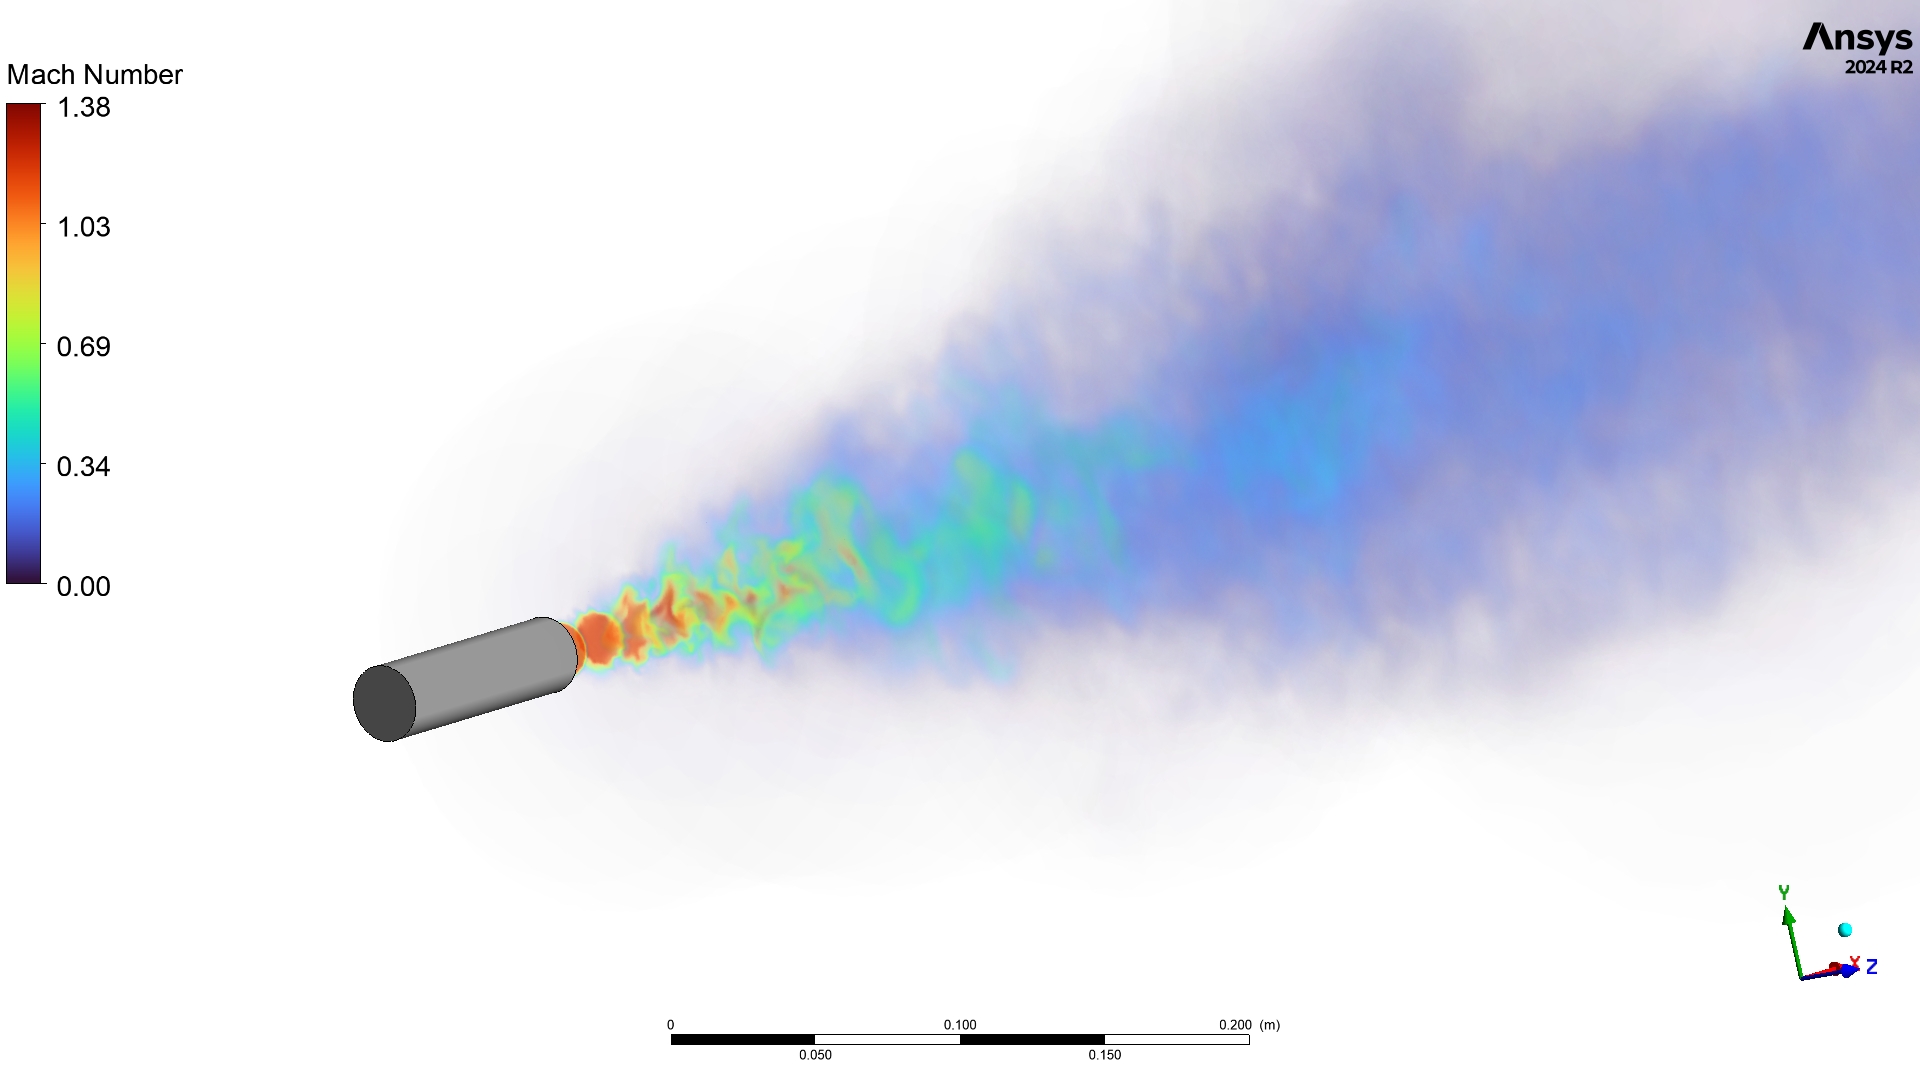
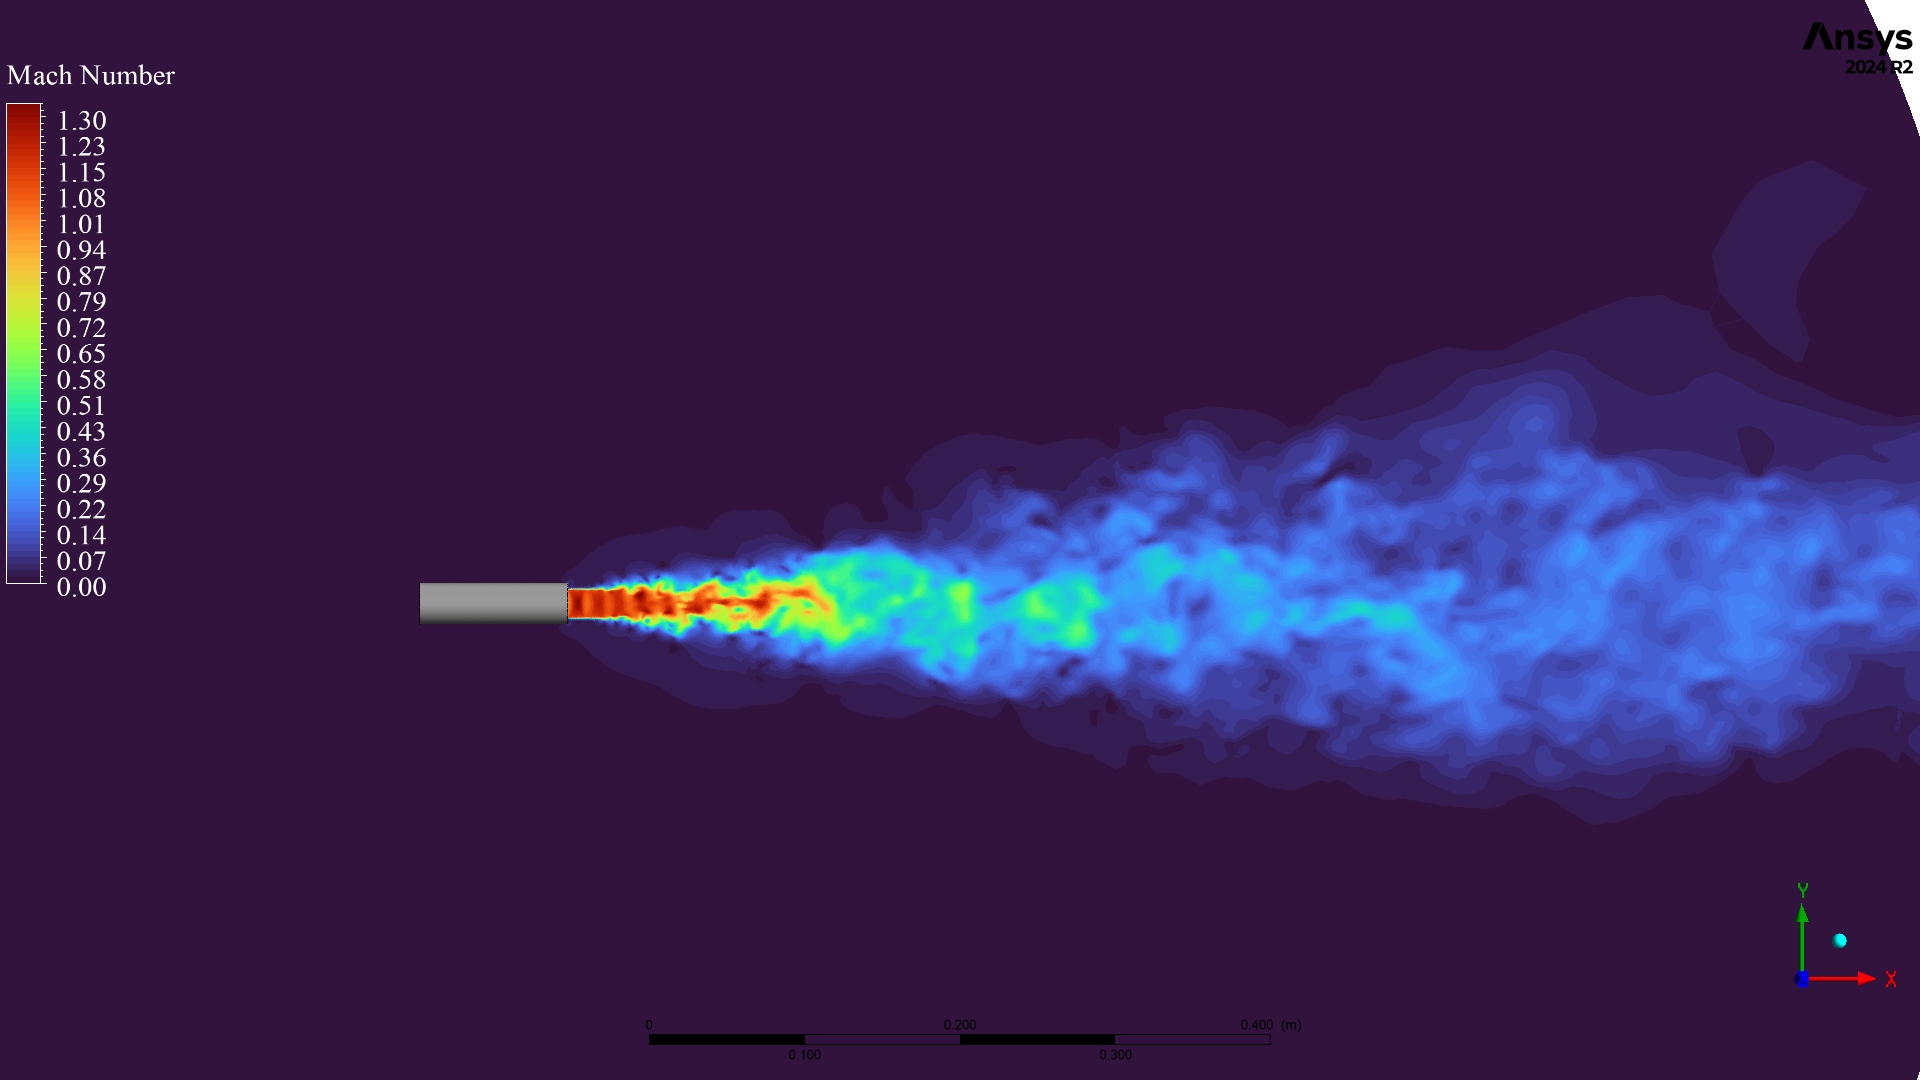
The simulation results provide a complete engineering story, showing a clear cause-and-effect relationship between the supersonic flow structures, the generation of turbulence, and the resulting acoustic noise. The analysis begins with the fundamental physics of the jet. The Mach number contour in Figure 3 shows the jet exiting the nozzle at a supersonic speed of Mach 1.30. The pressure ratio plot in Figure 4 reveals that the jet is “under-expanded,” meaning its pressure at the exit is higher than the surrounding air. This causes a series of compression and expansion waves to form, creating a repeating diamond pattern of shocks known as shock-cells. The plot clearly shows these shock-cells as the pressure oscillates between 0.91 and 1.23 times the atmospheric pressure in the first two diameters downstream of the nozzle.
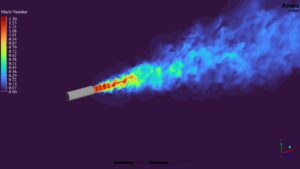
Figure 3 Mach number contours from the Fluent CFD simulation, showing the supersonic core (Mach 1.30) and the mixing with surrounding air.
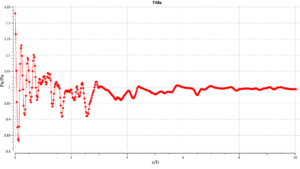
Figure 4: Pressure Ratio (Pe/Pa) Along Jet Centerline in Fluent – Shock cell structure visible from x/D = 0-2 with oscillating pressure peaks reaching 1.23, stabilizing to atmospheric pressure beyond x/D = 3.
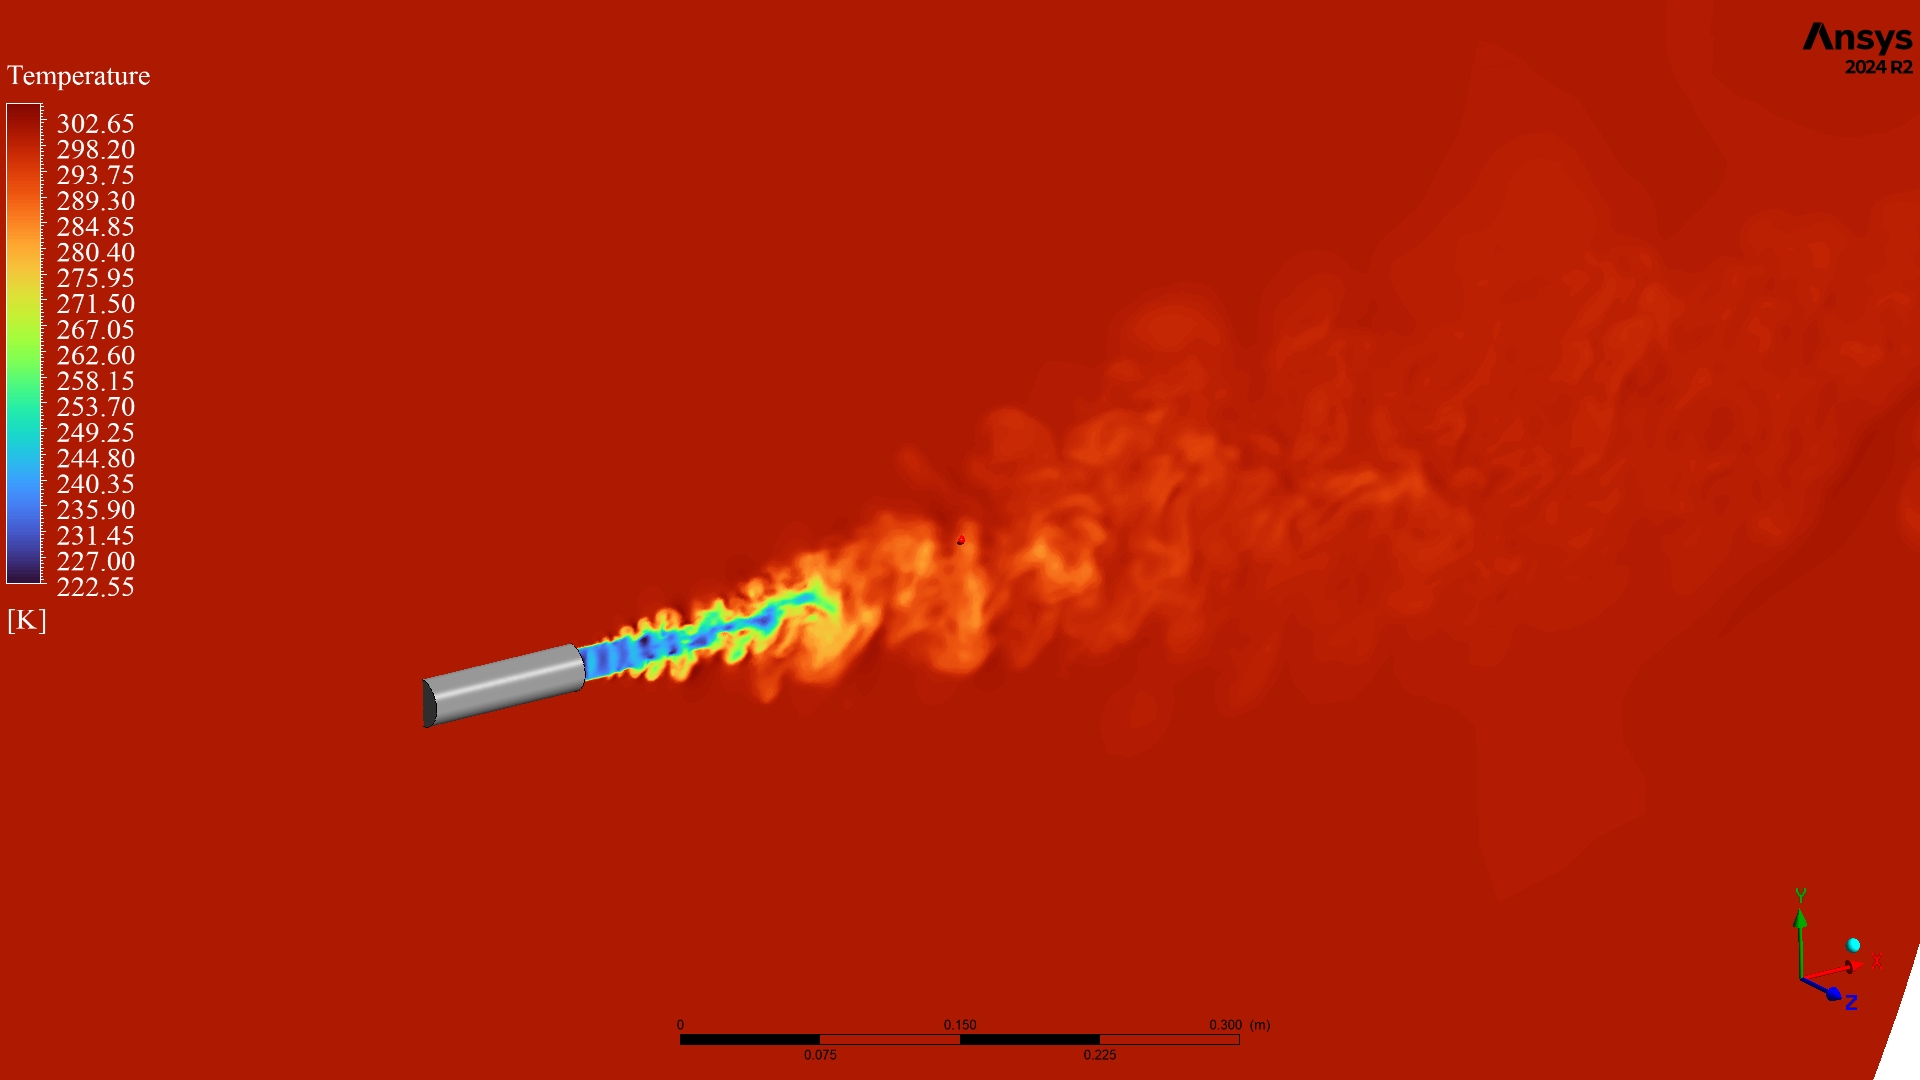
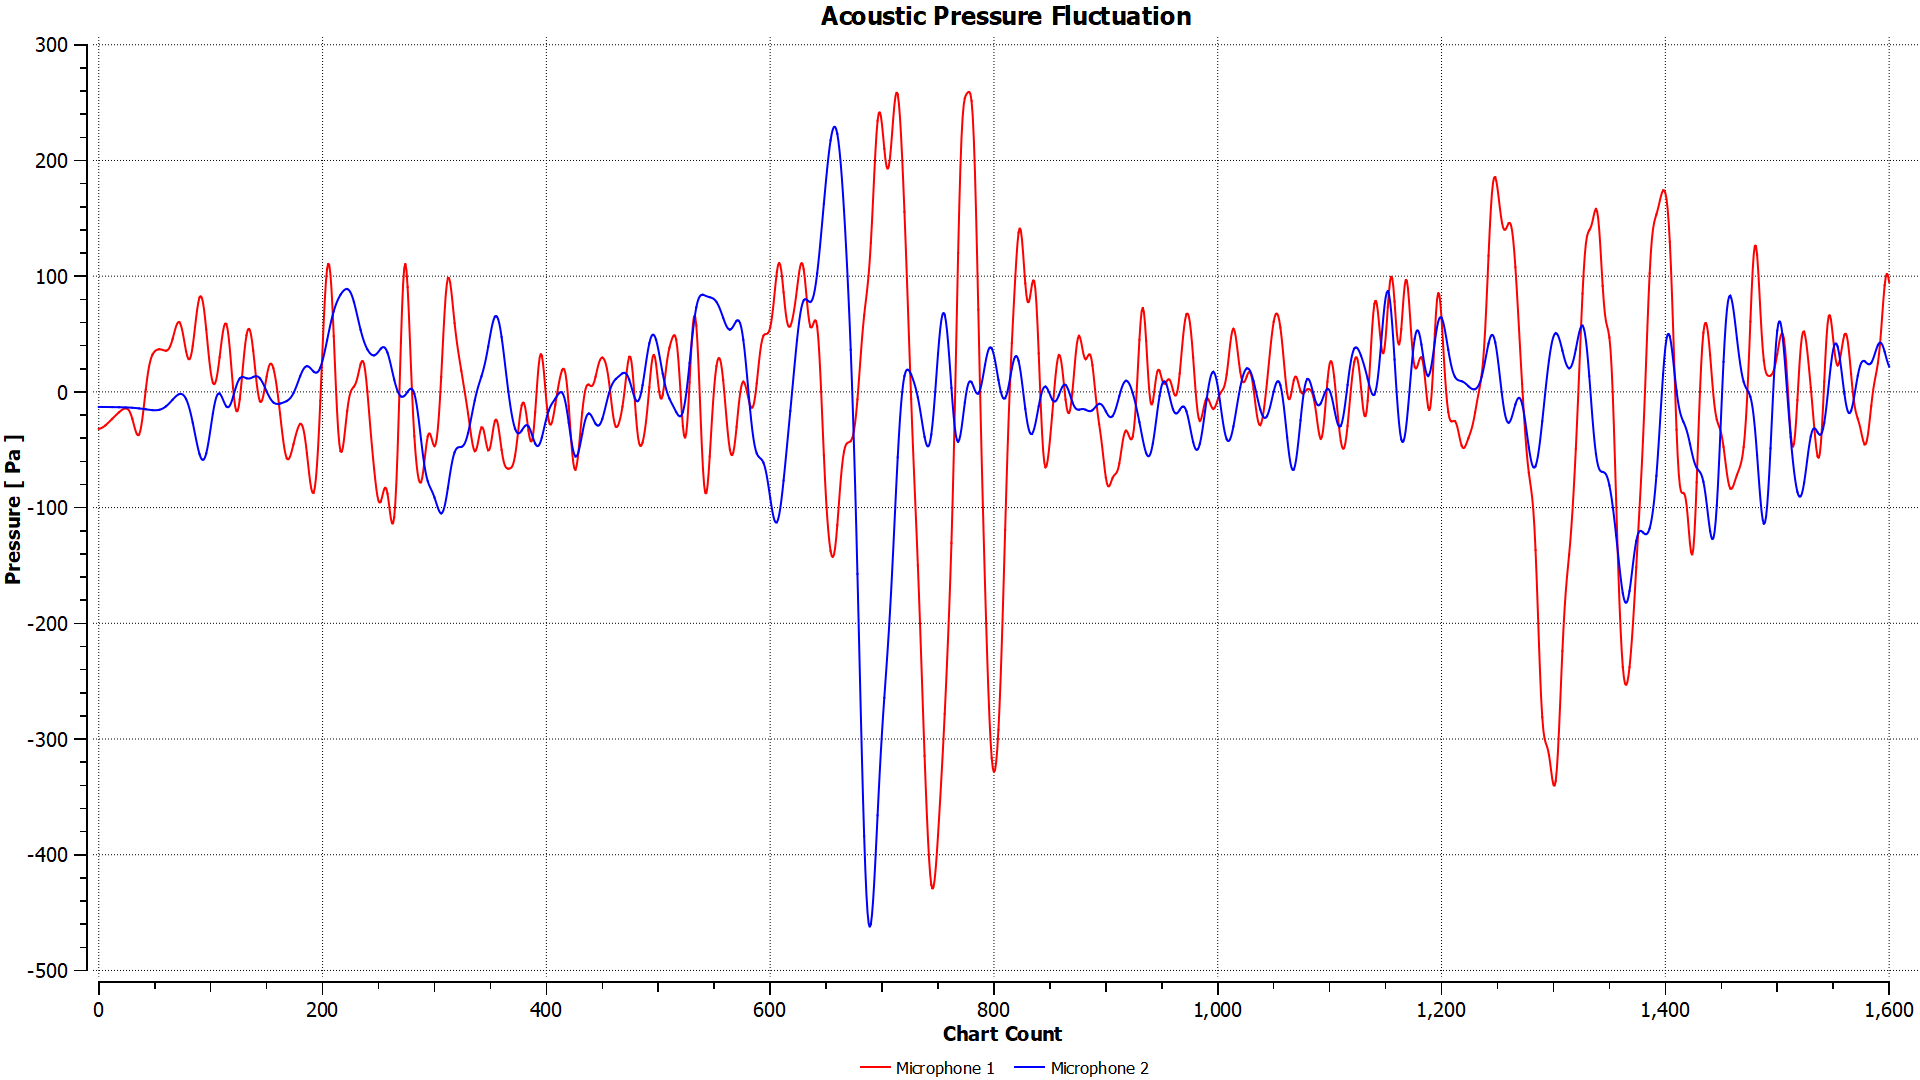
The acoustic pressure fluctuation contour from the Fluent aeroacoustics simulation displays noise generation in the supersonic jet. Dark red and blue regions near the jet shear layers show acoustic fluctuations ranging from -1500 Pa to +1472 Pa, which are the main noise sources created by turbulent eddies and shock waves. The acoustic field spreads outward from the jet mixing region, with lower fluctuation levels (green, ~150 Pa) in the far-field. This CFD acoustic analysis proves that LES in ANSYS Fluent can capture jet noise sources accurately. The acoustic pressure time-history plot from both microphones shows unsteady pressure fluctuations over time. Microphone 1 (red line, near jet inlet) records peak fluctuations of ±350 Pa around sample 700-800, showing strong near-field noise from turbulence and shock interactions. Microphone 2 (blue line, in quiescent zone) shows lower fluctuations of ±250 Pa, confirming it captures far-field acoustic waves with less intensity. Both signals have random turbulent noise with periodic peaks, typical of supersonic jet aeroacoustics. This Fluent CFD microphone data provides direct acoustic measurement for noise prediction and validates the LES acoustic model.
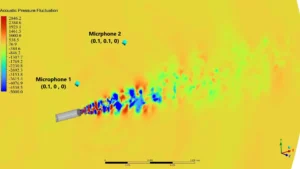
Figure 5: Acoustic Pressure Fluctuations from LES in ANSYS Fluent – Jet noise sources concentrated in shear layers with ±1500 Pa fluctuations, propagating to far-field with reduced intensity.

Figure 6: Time-History of Acoustic Pressure at Two Monitoring Points in Fluent CFD – Microphone 1 (near jet) shows ±350 Pa peaks, while Microphone 2 (far-field) records ±250 Pa, confirming noise propagation from turbulent jet flow.
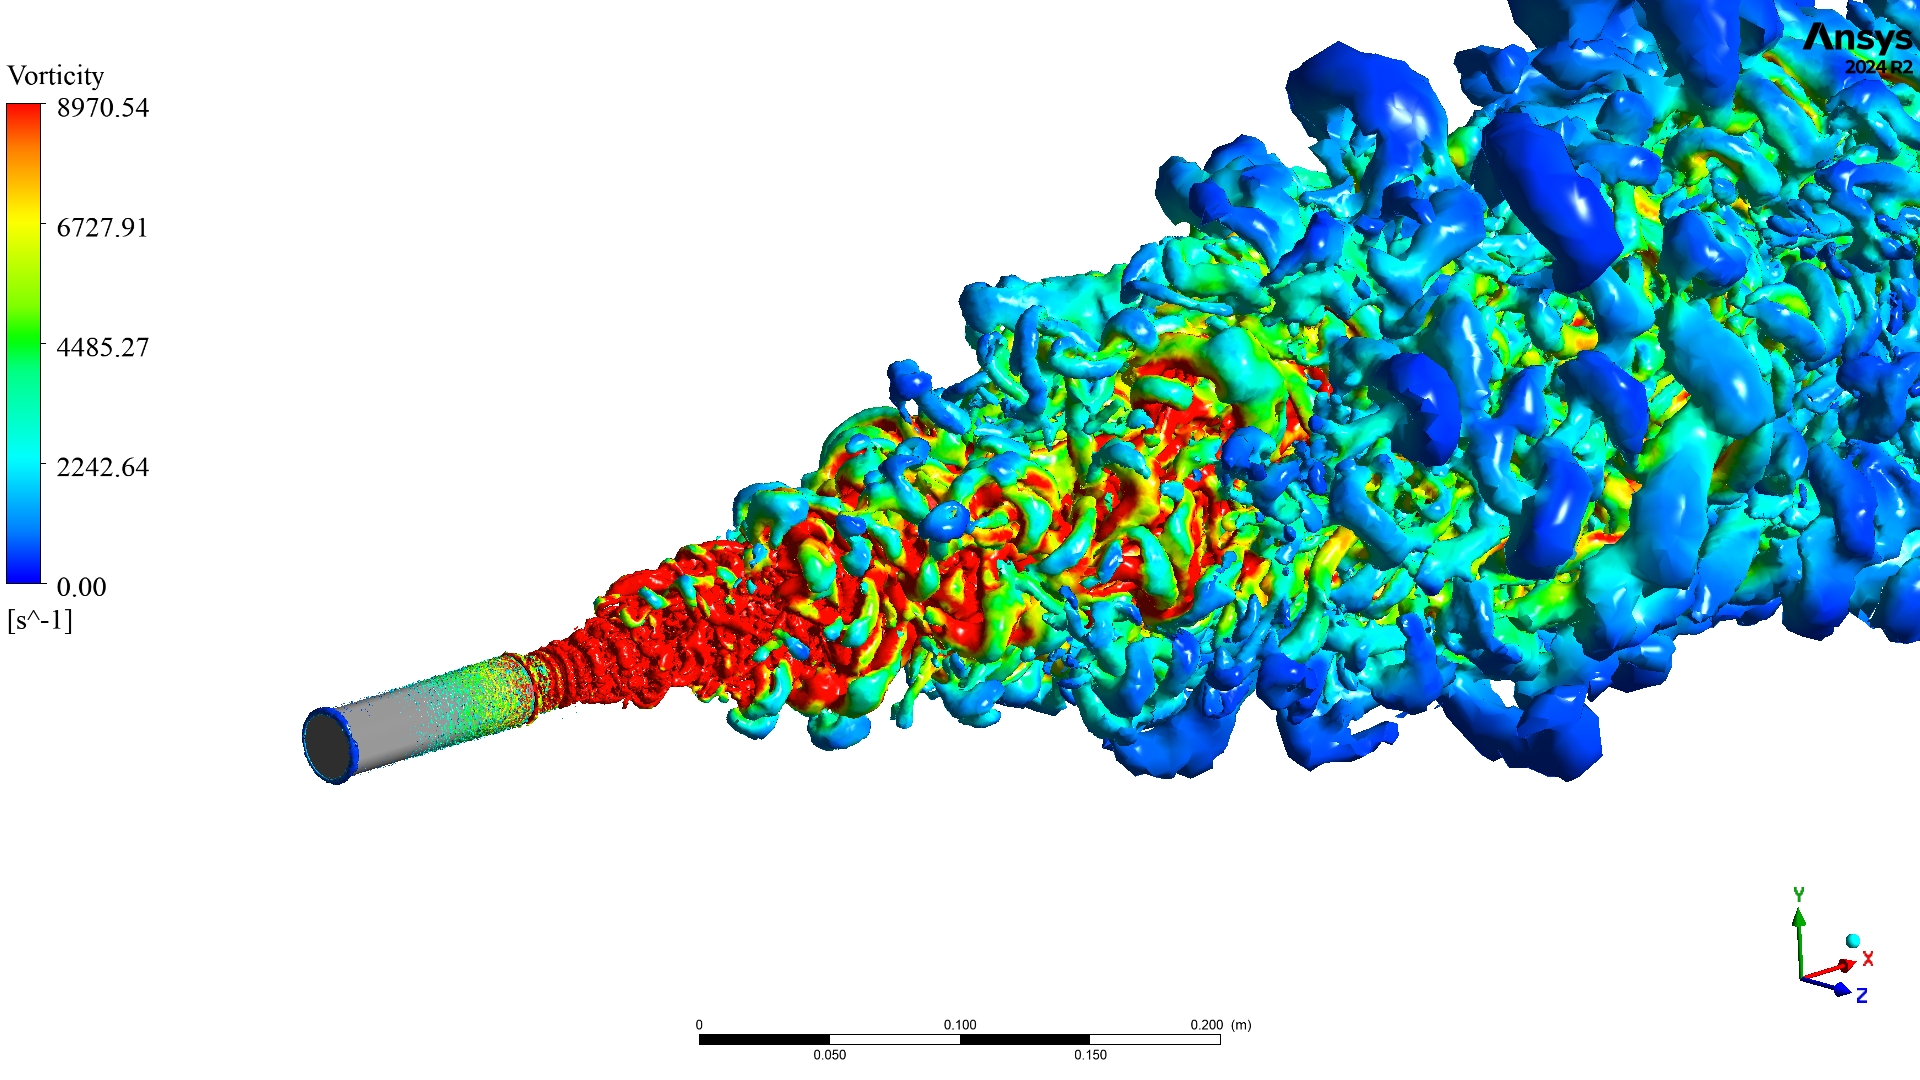
The vorticity iso-surface from the LES CFD simulation in ANSYS Fluent reveals complex turbulent structures. High vorticity values (red, 8970 s⁻¹) concentrate near the nozzle exit where jet shear layers create intense turbulence. Medium vorticity (yellow-green, 4485-6727 s⁻¹) extends downstream as turbulent eddies grow and interact. The blue structures in the far-field show large-scale vortices with lower vorticity (2242 s⁻¹). These 3D vortex structures are the main acoustic noise sources in supersonic jets, as they create pressure fluctuations when they form, interact, and break down. The LES turbulence model in Fluent resolves these eddies directly, making it superior to RANS for aeroacoustic predictions. This vorticity visualization confirms that the adaptive mesh refinement successfully captured fine turbulent scales, essential for accurate jet noise CFD analysis.

Figure 7: 3D Vorticity Structures from LES in ANSYS Fluent CFD – High vorticity (8970 s⁻¹) in jet shear layers generates acoustic noise sources, with large-scale turbulent eddies extending downstream.
The most important achievement of this simulation is the successful and accurate connection between the complex fluid dynamics (shock-cells and turbulence) and the resulting acoustic output. For an aerospace designer or manufacturer, this data is invaluable. It provides a “virtual acoustic laboratory” to:
- Pinpoint Noise Sources: They can see exactly where the loudest noise is coming from (the high vorticity and high acoustic pressure regions).
- Test Quieter Designs: They can now test design changes, like adding chevrons or tabs to the nozzle, and see directly in the simulation if these changes break up the large turbulent structures (Figure 7), which would reduce the pressure fluctuations (Figure 5) and result in lower noise levels at the microphones (Figure 6). This allows for the development of quieter and more efficient engines without building expensive physical prototypes.


Reviews
There are no reviews yet.