


In this Trombe Wall CFD Analysis tutorial, we explore a smart building technology used to heat rooms without electricity. A Trombe wall uses the sun’s energy to warm the air naturally. The system has a glass layer on the outside and a thick wall on the inside. When sunlight hits the dark wall, it gets hot. This heat moves into the house through the wall material and by air movement. This process is called natural convection. Sometimes, we add a fan to help the air move faster. This is called forced convection. Designing these walls is difficult because the weather changes every day. Therefore, engineers use CFD simulation to test the design on a computer. We use ANSYS Fluent to calculate the temperature and airflow. This helps us see if the wall works well before we build it.
In this ANSYS Fluent tutorial, you will learn how to perform a detailed Trombe Wall fluent simulation. We will guide you through the process of comparing computer results with real experimental data to prove accuracy. You will learn how to set up the Solar Ray Tracing model to simulate real sunlight. We also teach you how to use a Fan boundary condition fluent setup to model mechanical ventilation. This CFD Analysis of Trombe Wall training is essential for architects who want to save energy in green buildings. For more lessons on sustainable energy, please explore our Renewable Energy tutorials.
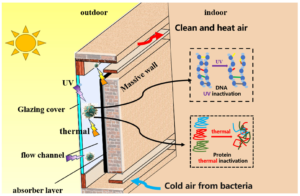
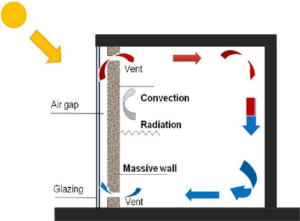
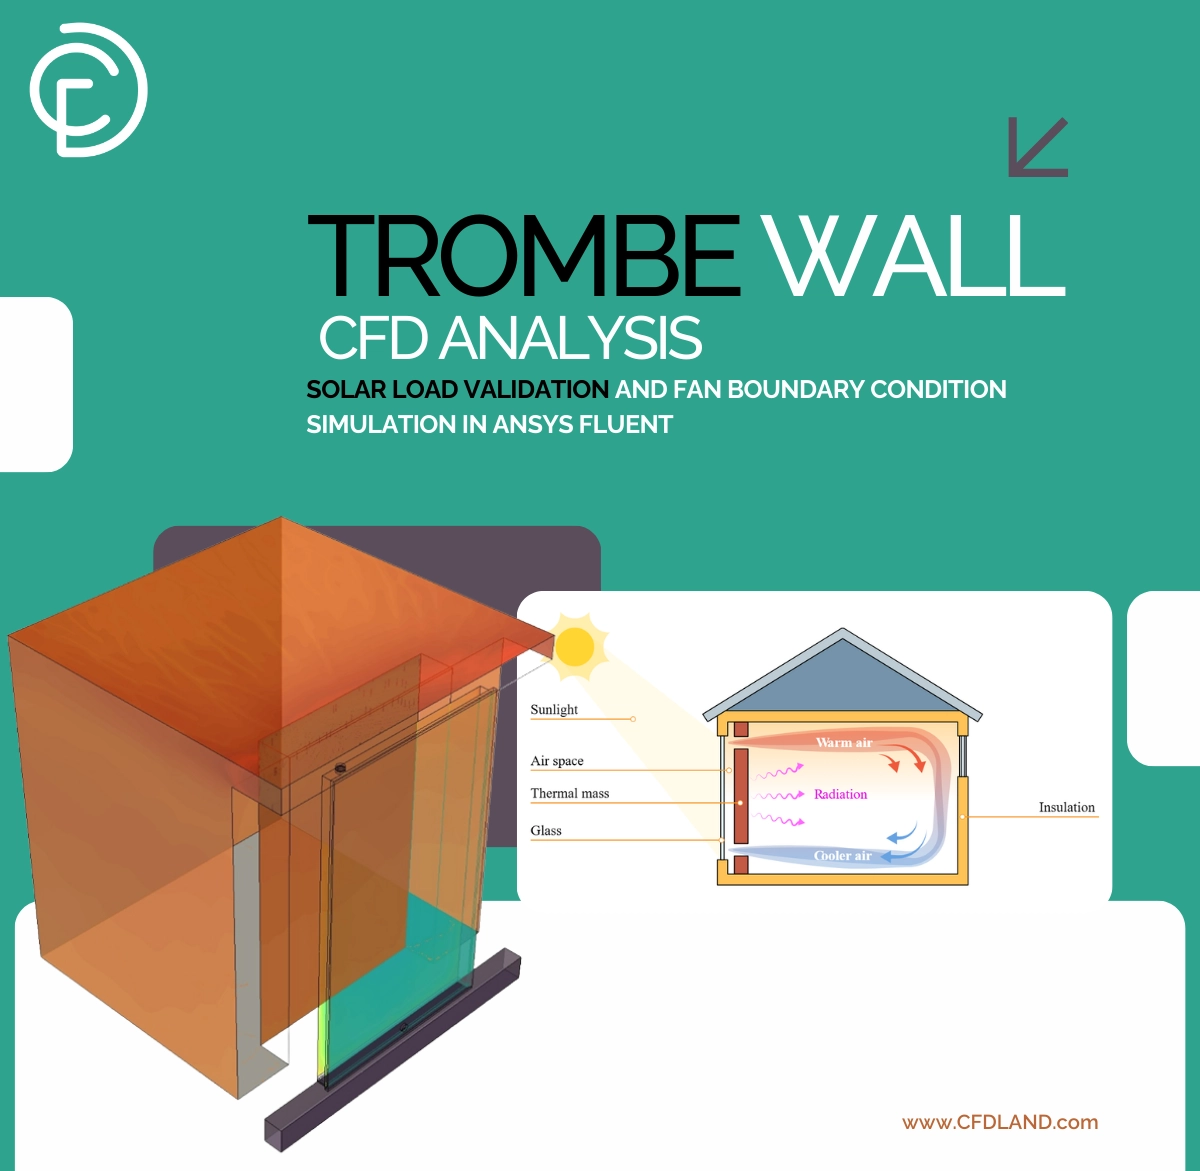
Figure 1: Photos of trombe wall showing the working mechanism in the system
Simulation process: Solar Ray Tracing and Fan Modeling in ANSYS Fluent
In this CFD simulation training, we start with a 3D model designed based on a real experimental setup. This ensures our Trombe Wall CFD Study is accurate. The geometry includes all the important parts: the clear front glass (polycarbonate glazing), the air gap, and the thick wall layers made of XPS insulation, brick, concrete, and stone. It also includes the top and bottom vents. Crucially, we model the mechanical fan installed at the outlet to improve air circulation. The model also includes the room space to see how the wall heats the inside air.
We used Fluent Meshing to create a high-quality Polyhedral grid. The mesh has a total of 4,492,174 cells. We made the mesh very fine (refined) near the walls and inside the narrow air gap. You will learn how to apply the Fan boundary condition using the Pressure Jump model in ANSYS Fluent. Instead of just setting a fixed speed, we input the real fan curve from the manufacturer’s catalog. This method is much better because it calculates the fan’s performance based on the system’s resistance, just like in real life.
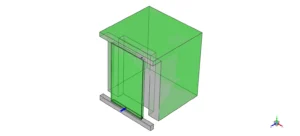
Figure 2: 3D Geometry model of the Trombe wall system, including the polycarbonate glazing, air gap, thermal mass wall layers (brick, concrete, stone), and ventilation ports.
The most critical part of this Trombe Wall simulation is the Discrete Ordinates radiation setup. The sun is the main source of heat. In this lesson, we use the Solar Ray Tracing model in ANSYS Fluent. This model calculates the exact path of sunlight as it passes through the glass and hits the wall. We set the sun position using the Solar Calculator. We input the exact location: Longitude -84.63 (West), Latitude 13.65 (North), Timezone GMT-5, Date June 21, and Time 13:00 (1:00 PM). This tells Fluent exactly where the sun is in the sky.
Finally, you will learn to assign the correct material properties. We used XPS for insulation, Brick and Concrete for storing heat, and Polycarbonate for the glass. The Polycarbonate has high transmissivity, which allows sunlight to pass through it easily. The dark wall materials have high absorptivity, meaning they catch and hold the heat. This detailed setup allows our CFD Analysis to predict the temperature and airflow very precisely.
Post-processing: Trombe Wall CFD Analysis Results
In this section of the tutorial, we analyze the engineering data to see how well the Trombe wall heats the air. We interpret the temperature differences and radiation contours to validate the design. First, we check the accuracy of the simulation by comparing it with real measurements. The table below shows the temperature difference between the inlet and outlet air at 13:00 PM. The ΔT is 28.8°C. This means the wall heated the air by nearly 29 degrees. The CFD Predicted ΔT is 30.87°C. The difference is only 2.07°C. . In engineering, an error below 10% is excellent. This proves that the Trombe Wall fluent simulation methods you learned in this course are reliable and valid for real-world design.
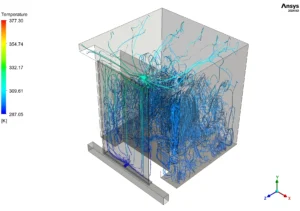
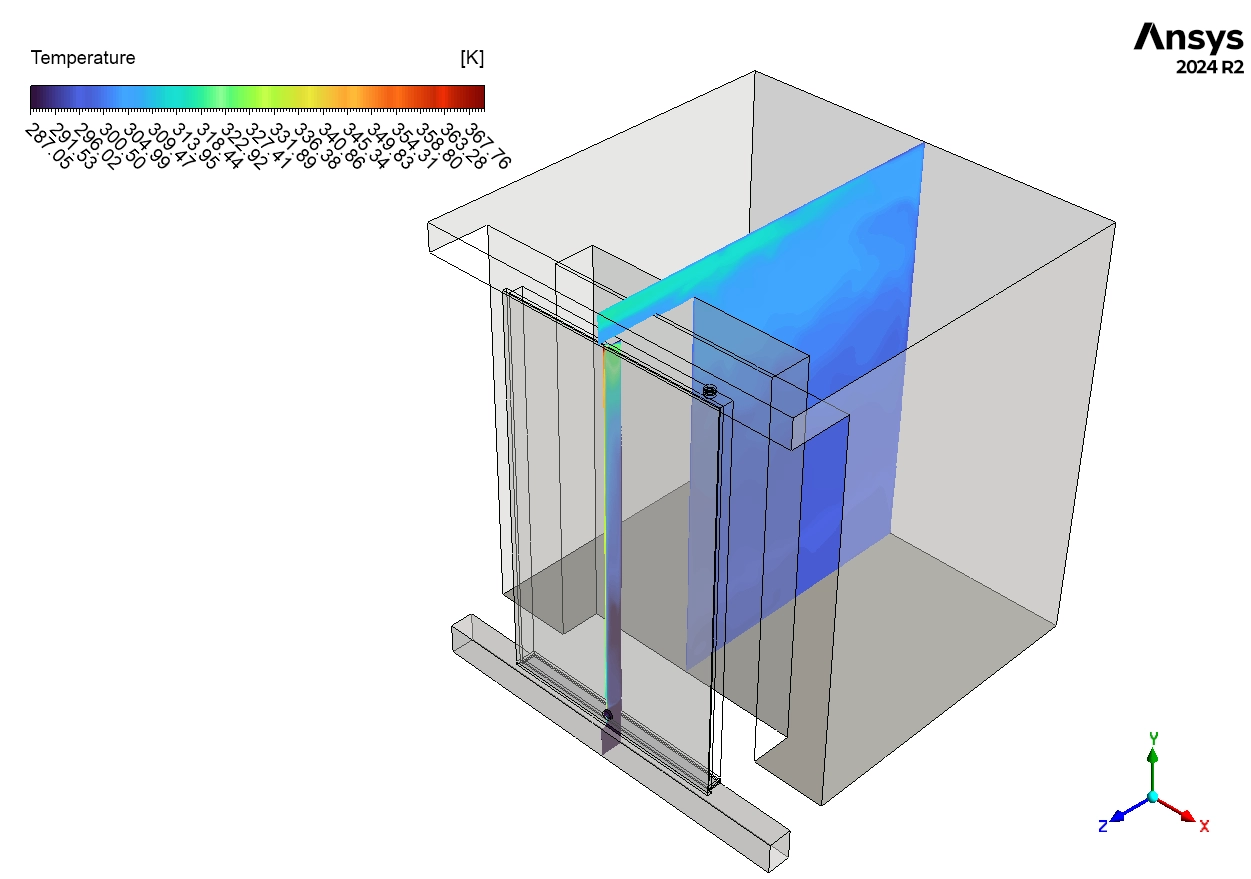
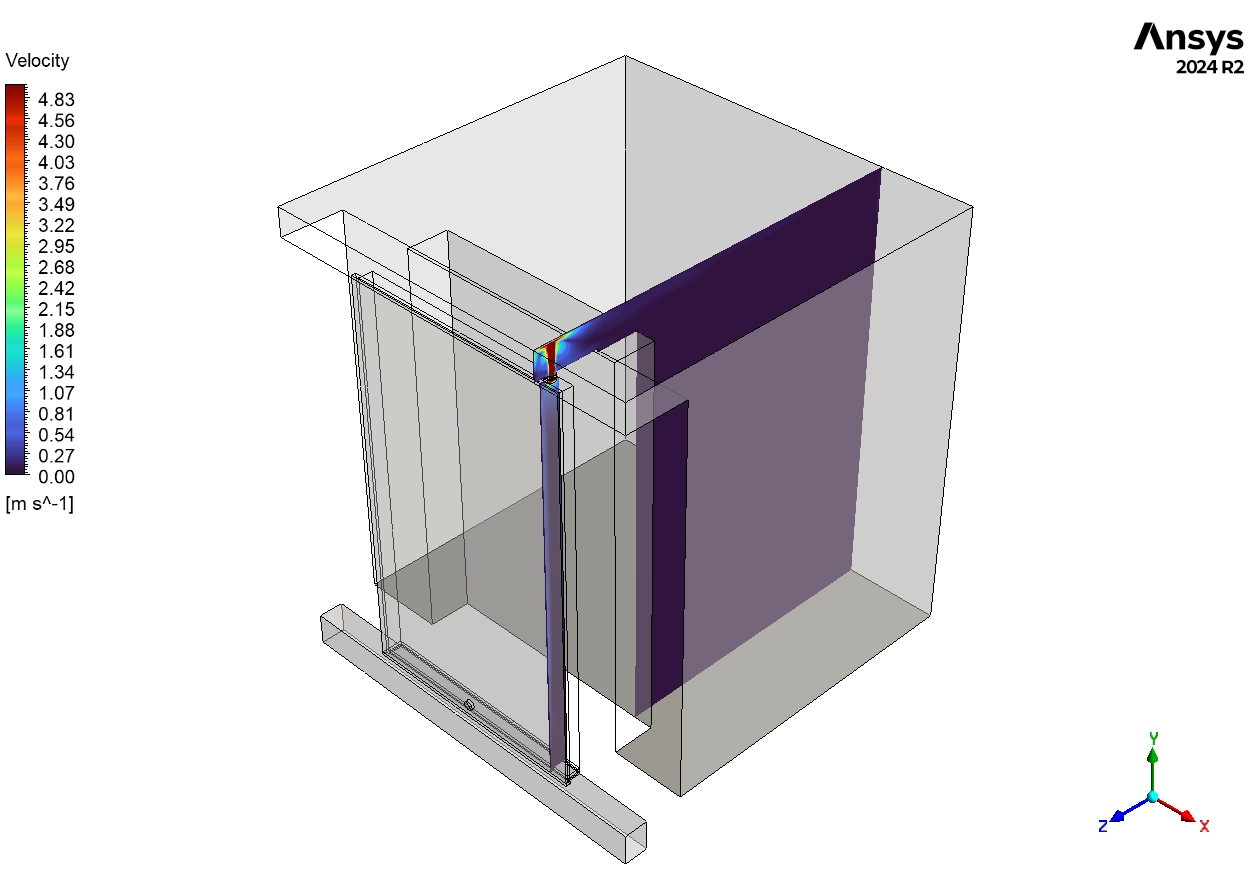
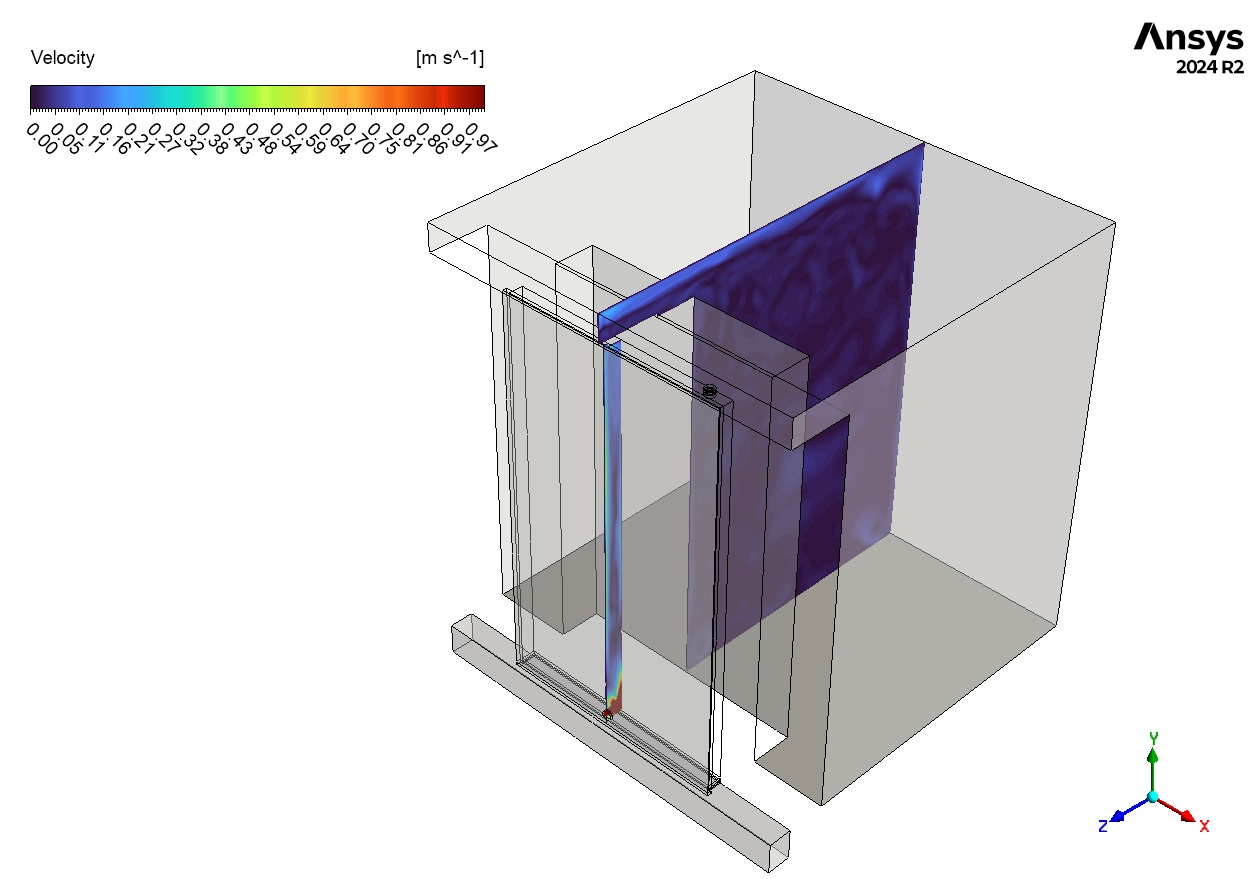
Figure 3: Temperature distribution visualized using particle streamlines colored by temperature (287.05-377.30 K or 13.9-104.15°C), showing cool air entering through the fan opening
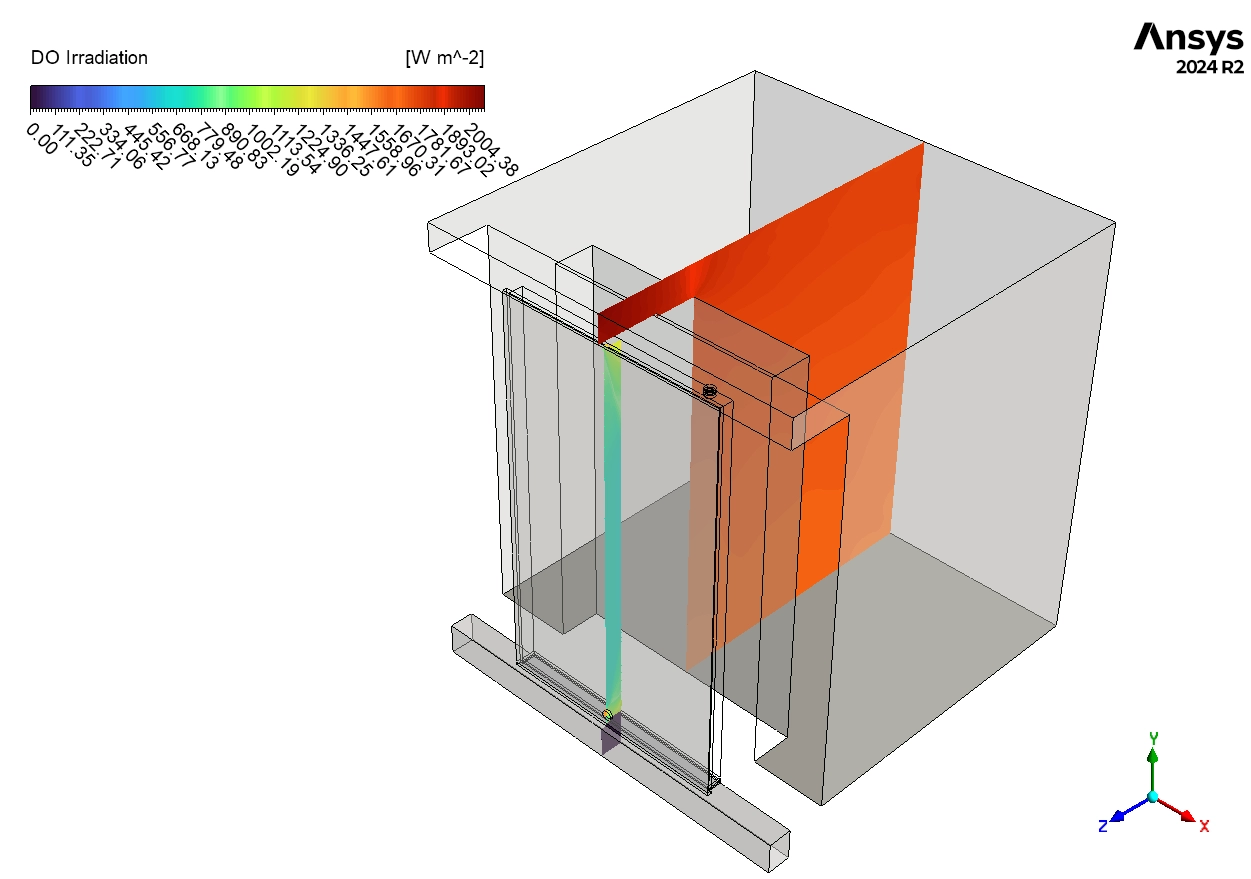
Next, we analyze the Solar Radiation Contours in Figure 4. The red color on the front glass indicates a Maximum Irradiation of 2121.56 W/m². This confirms that the Solar Ray Tracing model is working correctly and simulating a very sunny afternoon. The yellow color on the inner brick wall shows values between 800-1400 W/m². This proves that the wall is absorbing a significant amount of solar energy. Engineering Insight: This absorbed energy is the engine of the system. If you used a different glass that was less clear (lower transmissivity), these values would drop, and the heating performance would fail.
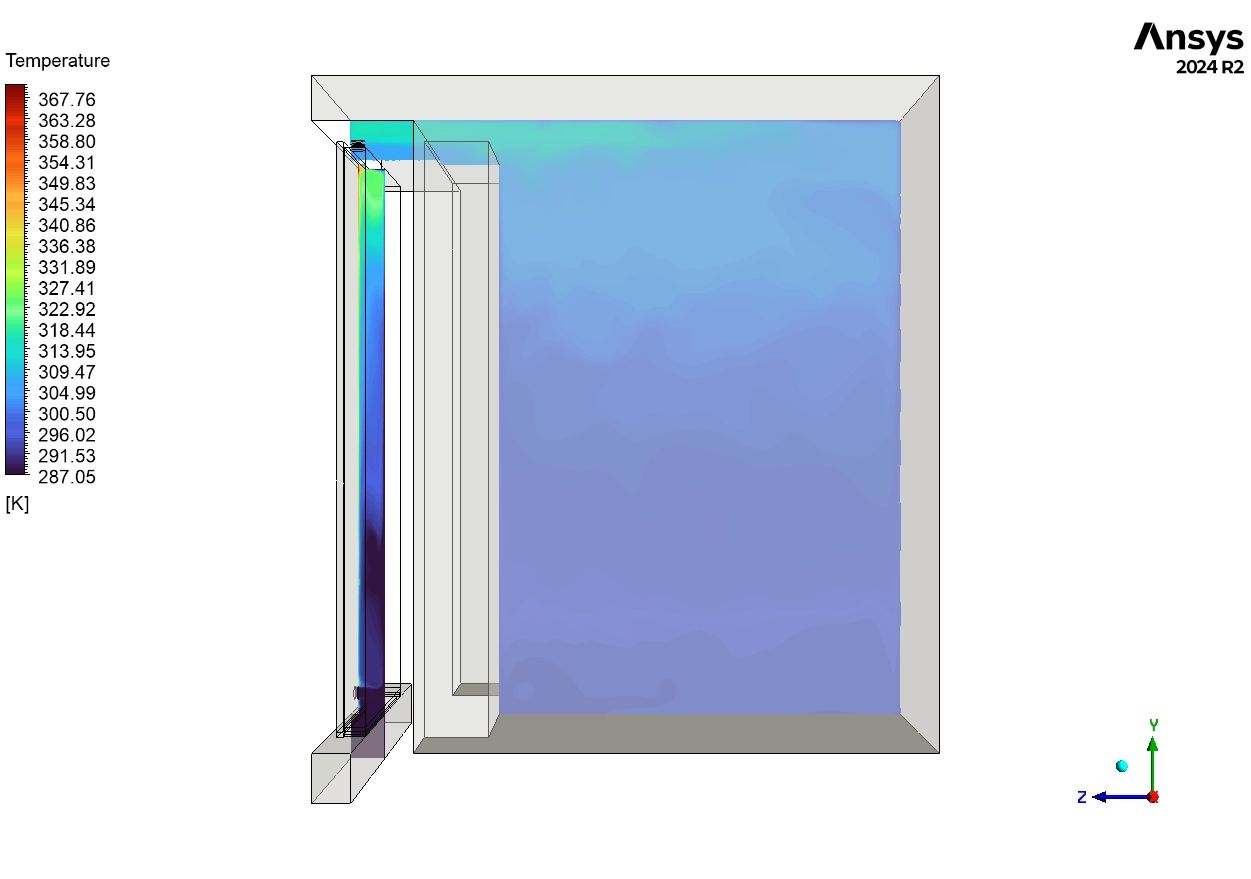
Finally, we examine the Temperature Streamlines in Figure 3. The lines start as dark blue at the bottom fan inlet, showing cool air entering at about 290 K (17°C). As the air moves up the channel, the lines turn green, yellow, and finally red. The red streamlines near the top reach a massive 377 K (104°C). This extreme heat comes directly from the solar-heated brick surface. The swirling lines indicate turbulence, which is good because it helps mix the air and pick up more heat. Figure 5 confirms that heat is also moving through the solid brick wall via conduction. We see a clear temperature gradient from the hot inner surface to the cooler outer surface. This demonstrates that the Trombe wall provides heat in two ways: immediate hot air circulation (convection) and delayed radiant heat from the wall mass. This dual-action makes the Trombe wall a highly efficient system for sustainable buildings.
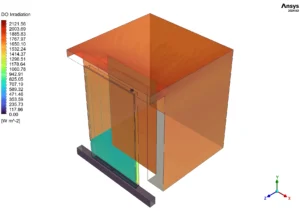
Figure 4: Solar radiation distribution (DO Irradiation) on Trombe wall surfaces measured in W/m² (0-2121.56 W/m²), showing maximum solar irradiation

Figure 5: Cross-sectional temperature distribution in the Trombe wall structure (287-377 K), showing temperature gradient through the brick wall thickness from hot inner surface


Reviews
There are no reviews yet.