

Airplanes waste a massive amount of jet fuel during flight. This happens because high-pressure air under the wing escapes to the low-pressure zone on top of the wing. This escaping air creates a violent spinning tornado at the wing edge called a wingtip vortex. This vortex grabs the airplane and physically pulls it backward, creating severe induced drag.
To solve this problem, engineers attach a vertical wall at the wingtip called a winglet. However, guessing the exact angle and size is impossible. In this tutorial, we will use ANSYS Fluent and ANSYS Direct Optimization to solve this physics problem automatically. If you want to master airflow physics over flying objects, exploring our Aerodynamics & Aerospace CFD tutorials is your best next step. Today, we will analyze exactly how morphing the physical winglet shape destroys the vortex and maximizes the CL/CD aerodynamic performance.
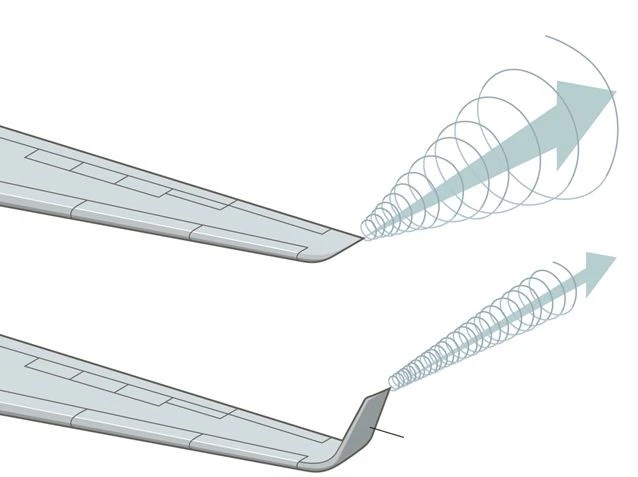
Figure 1: The physical flow schematic explaining how wingtip vortices cause induced drag and how vertical walls block them.
Simulation Process: Aerodynamic Design Space
To find the perfect aerodynamic shape, we must build a strict physical test space. We build the parameterized geometry inside ANSYS Design Modeler. We command the software to alter two exact physical variables. The first is the Winglet Scale (taper ratio). We allow the computer to change this from exactly 0.05 to 1.0. The second is the Winglet Angle. We allow the computer to swing this wall from exactly 25° to 80°. We connect this geometry directly to the ANSYS Direct Optimization engine. We select the MOGA (Multi-Objective Genetic Algorithm) to hunt for the optimal physics. We command the algorithm to generate exactly 20 initial samples, followed by 20 new samples across a maximum of 7 iterations. We set one absolute physical objective: Maximize the CL/CD ratio.
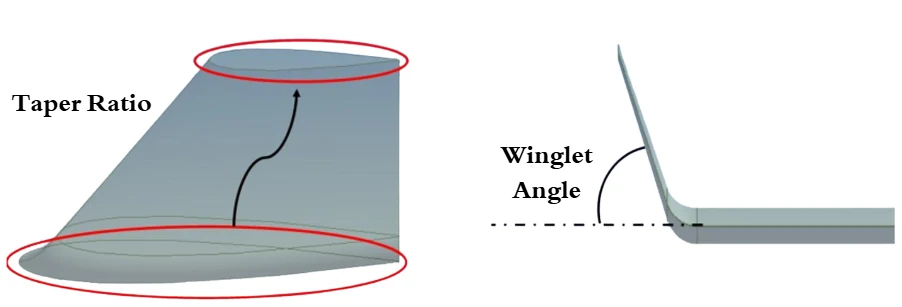
Figure 2: The exact parameterized variables inside ANSYS, defining the Winglet Scale and Winglet Angle.
This first table displays the exact physical dimensions of the 5 Pareto-optimal candidates discovered by the MOGA search.
| Candidate Name | Winglet Scale | Winglet Angle [°] | CL/CD |
| Candidate 1 | 0.97625 | 72.376 | 19.806 |
| Candidate 2 | 0.97625 | 72.727 | 19.801 |
| Candidate 3 | 0.95613 | 70.805 | 19.795 |
| Candidate 4 | 0.97362 | 72.438 | 19.793 |
| Candidate 5 | 0.97362 | 72.426 | 19.792 |
To confirm this achievement, we re-run Candidate 1 independently in a full ANSYS Fluent simulation. The final table confirms the exact optimized aerodynamic efficiency.
| Parameter | Confirmed Value |
| Winglet Angle | ~71 [°] |
| Winglet Scale (Taper Ratio) | ~0.97 |
| CL/CD (ANSYS Fluent Result) | 19.774726 |
Post-processing: Analysis of Optimal Case
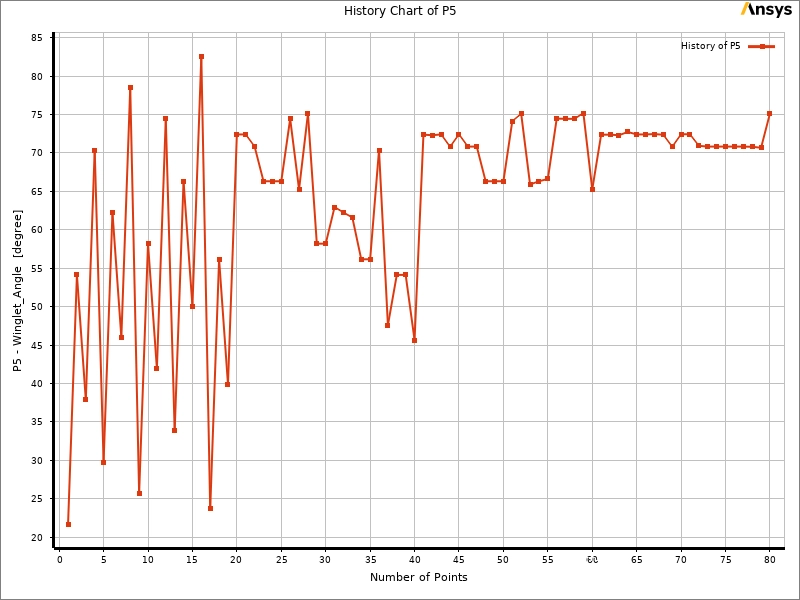
We must now perform a deep-dive analysis of the visual charts and contours. We will track how the algorithm found the solution, analyze the crushing surface pressures, and examine the precise 3D flow redirection. Look closely at the two scatter plots in Figure 3 and Figure 4. The horizontal axis tracks exactly 80 design points. These charts show the MOGA engine thinking and hunting for the absolute best aerodynamic physics.
In Figure 3, the vertical axis maps the Winglet Angle. Look at the early points from exactly 1 to 20. The red dots bounce wildly from 25° to 80°. The algorithm is testing extreme physical shapes. However, after point 55, the red line suddenly flatlines. It locks tightly into the 70° to 75° band. Now look at Figure 4. The vertical axis maps the Winglet Scale. The same physical hunting occurs. After point 60, the red line locks onto the 0.95 to 1.0 band.
Why did the algorithm choose these exact numbers? In fluid physics, a taper ratio near 1.0 provides maximum physical wall area. A large wall angled exactly near 72 ° perfectly blocks the high-pressure air from rolling over the tip. The algorithm proved that this specific combination creates the highest CL/CD ratio.

Figure 3: The MOGA search history proving the algorithm forces the Winglet Angle to stabilize tightly near 70°to 75 °.
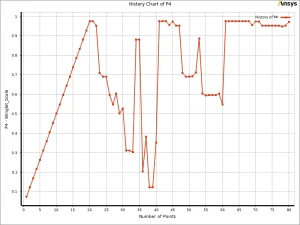
Figure 4: The optimization search proving a near-full Winglet Scale of 0.95 to 1.0 delivers the highest lift-to-drag improvement.
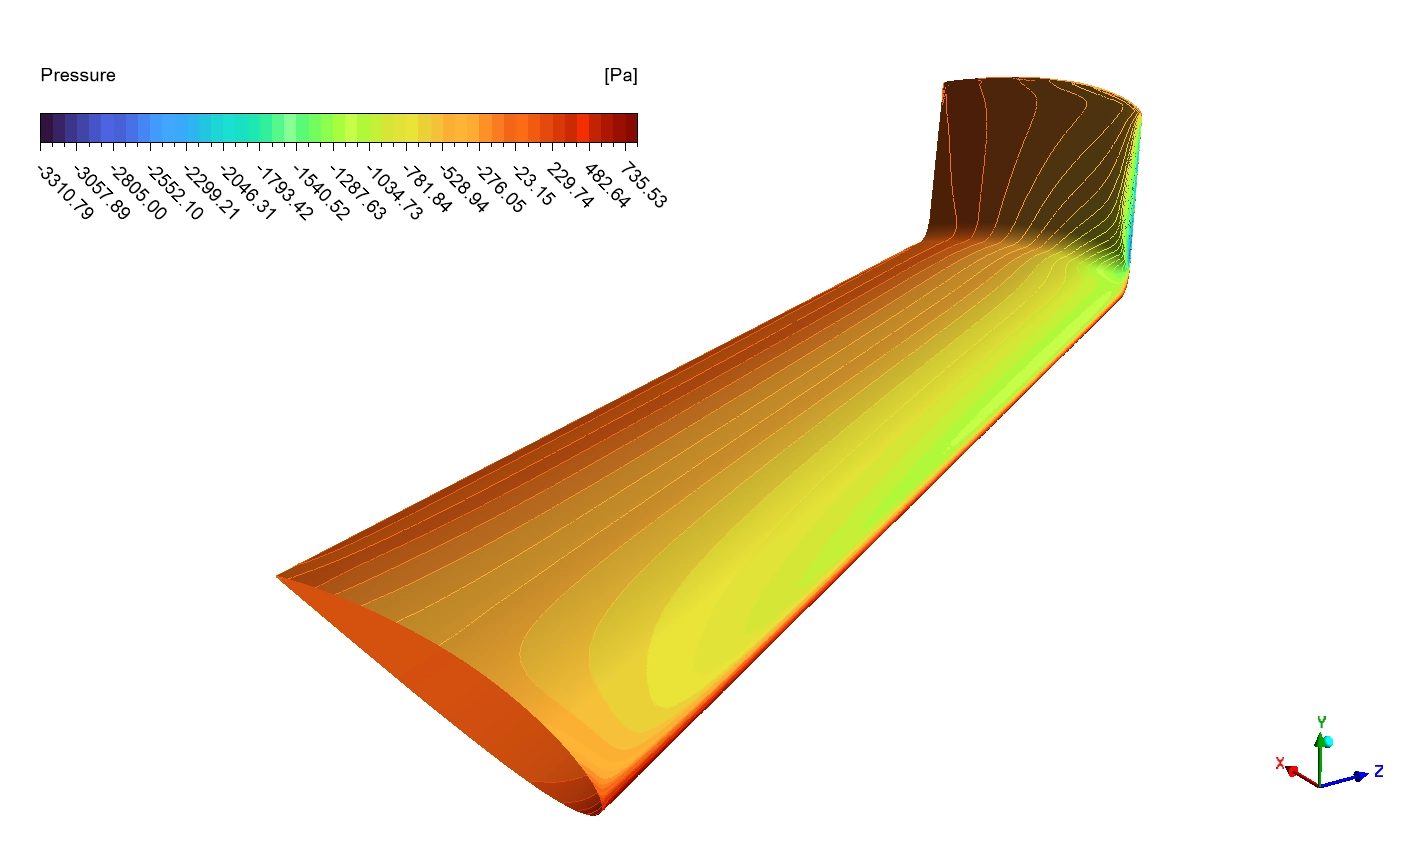
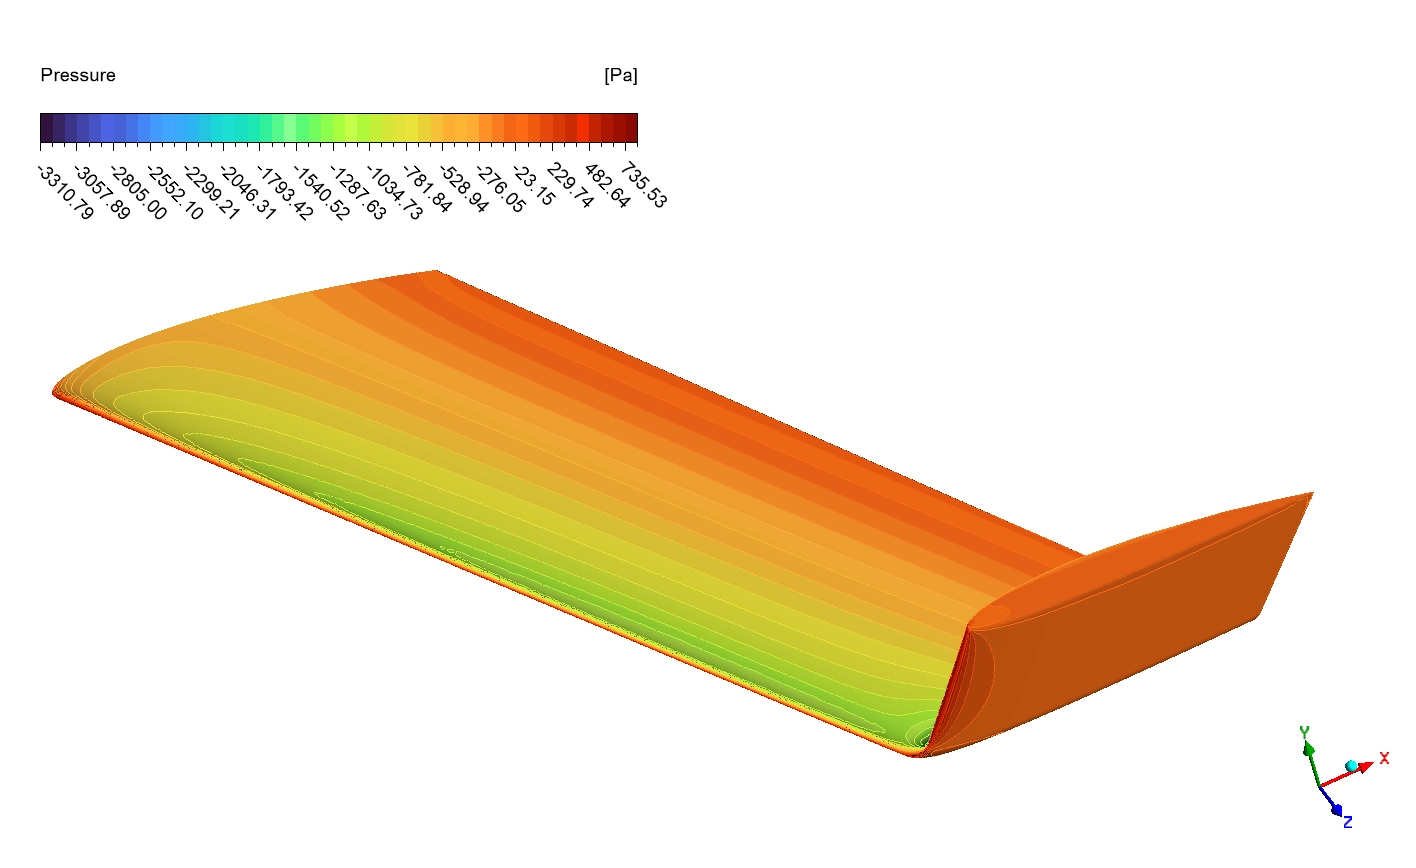
Look at the 3D wing in Figure 5. This is the Surface Static Pressure contour. The legend tracks the physical force from an extreme low of exactly -3310.78 Pa to a high of exactly 735.53 Pa. The leading edge of the wing is painted bright red and orange. This is the stagnation zone. The fast air crashes directly into the metal face here, creating a positive pressure of exactly 735.53Pa. Now look at the massive blue and green zone covering the entire top surface. This is the low-pressure suction zone. The pressure here drops violently to exactly -3310.78Pa. The massive physical difference between the crushing red front and the deep blue top is the exact mathematical force that lifts the airplane into the sky. Furthermore, you can see the pressure bands transition smoothly without breaking. This proves the boundary layer is perfectly attached, which prevents pressure collapse and drag.

Figure 5: The Static Pressure contour proving the upper wing surface achieves a massive low-pressure lift zone hitting exactly -3310.78 Pa.
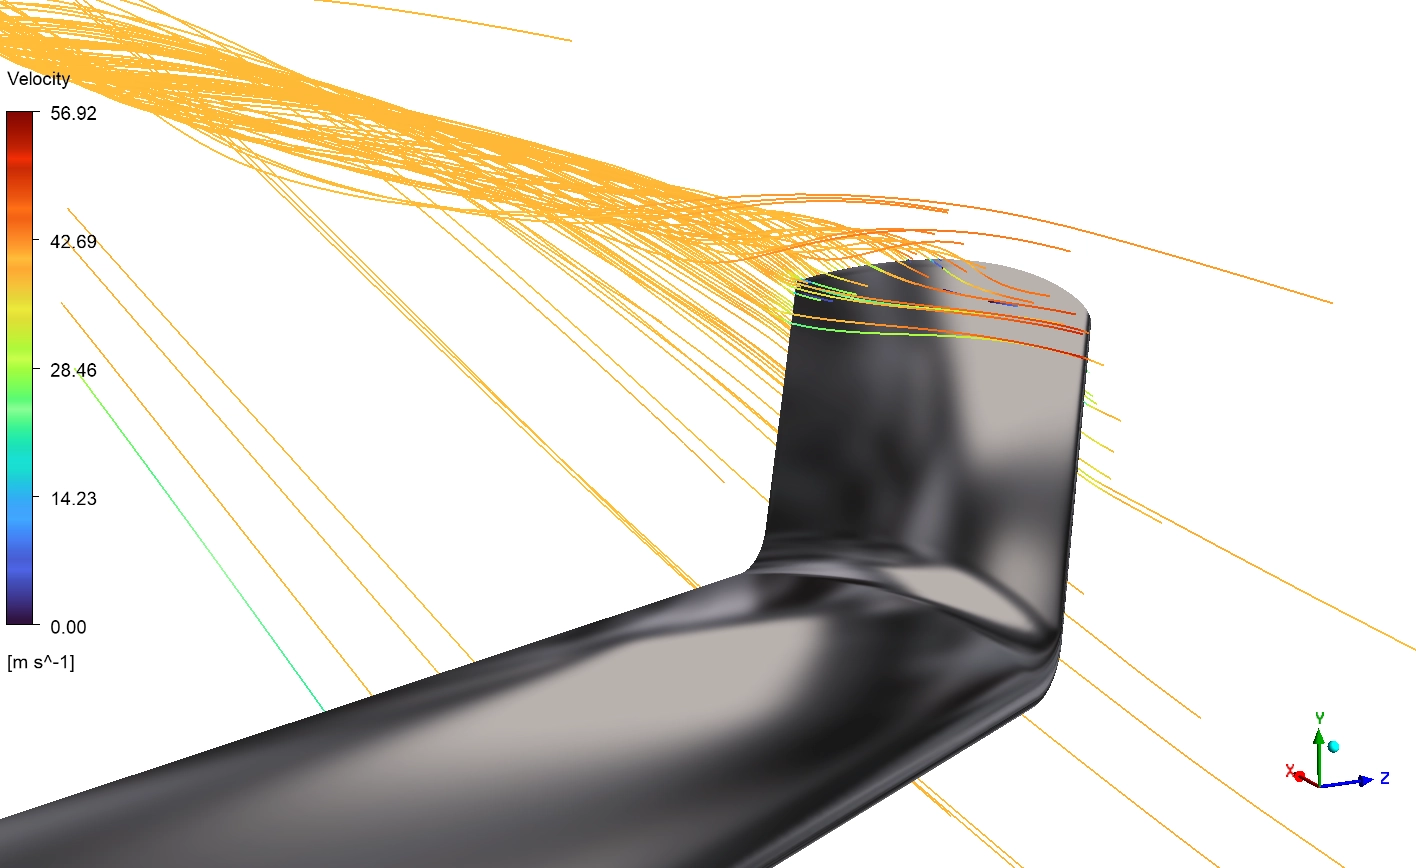
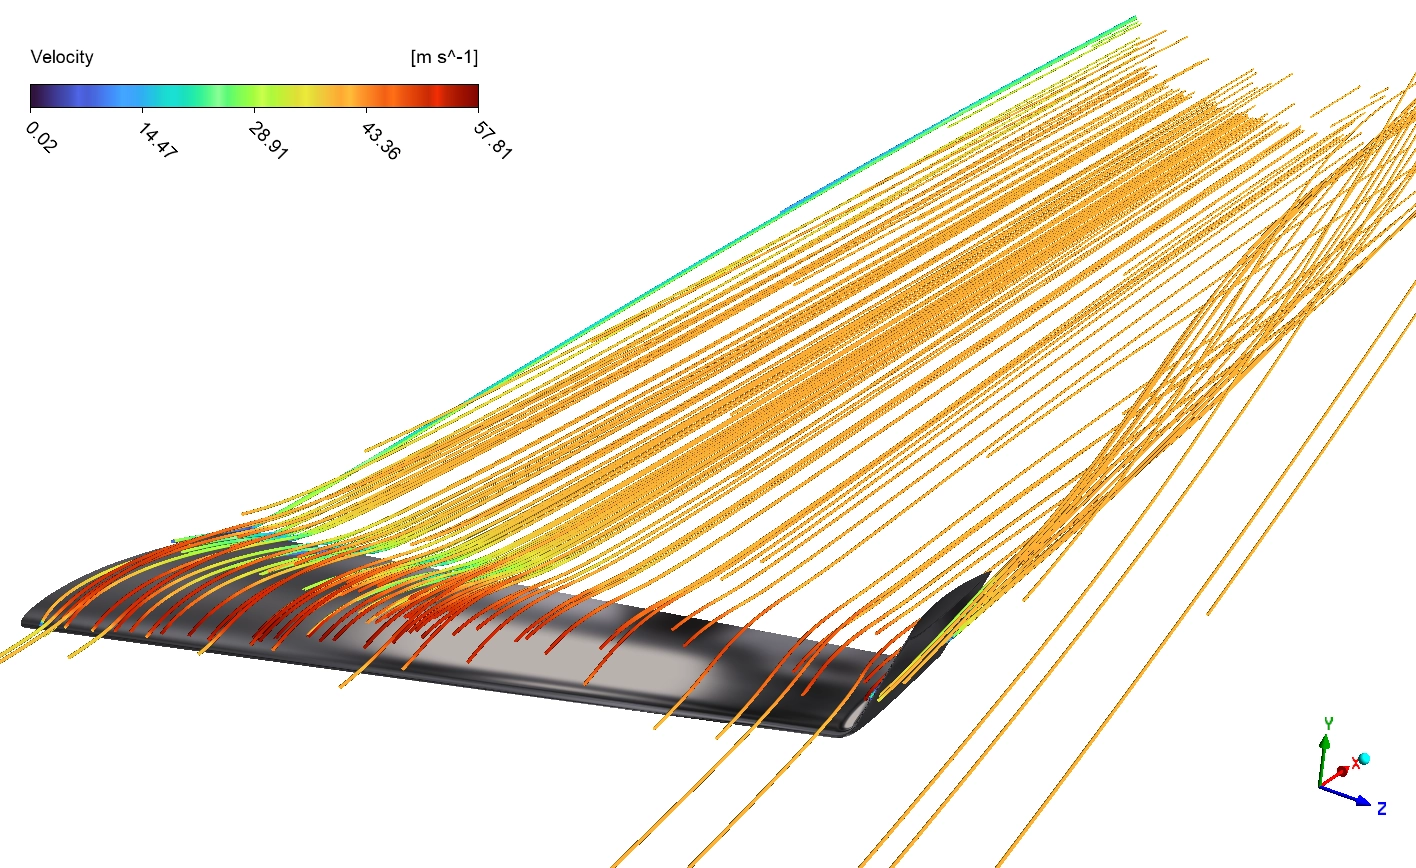
Now look at Figure 6. This is the Velocity streamline plot. The orange ribbons measure the air speed over the wing between exactly 43 and 57 m/s. Look at the dark green and cyan zone right where the winglet joins the main wing. The speed here drops to exactly 14 to 28 m/s. This is a physical deceleration zone. However, look closely at how the orange lines behave at the tip. Without the winglet, these lines would twist into a violent spiral. Because the optimized winglet is present, the orange lines stay perfectly straight and attached. The physical metal wall cleanly redirects the escaping air upward. This proves that the MOGA design successfully murdered the wingtip vortex, drastically reducing the induced drag.
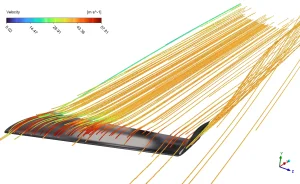
Figure 6: The Velocity streamlines proving the straight orange flow bands hit exactly 57 m/s while suppressing the vortex.
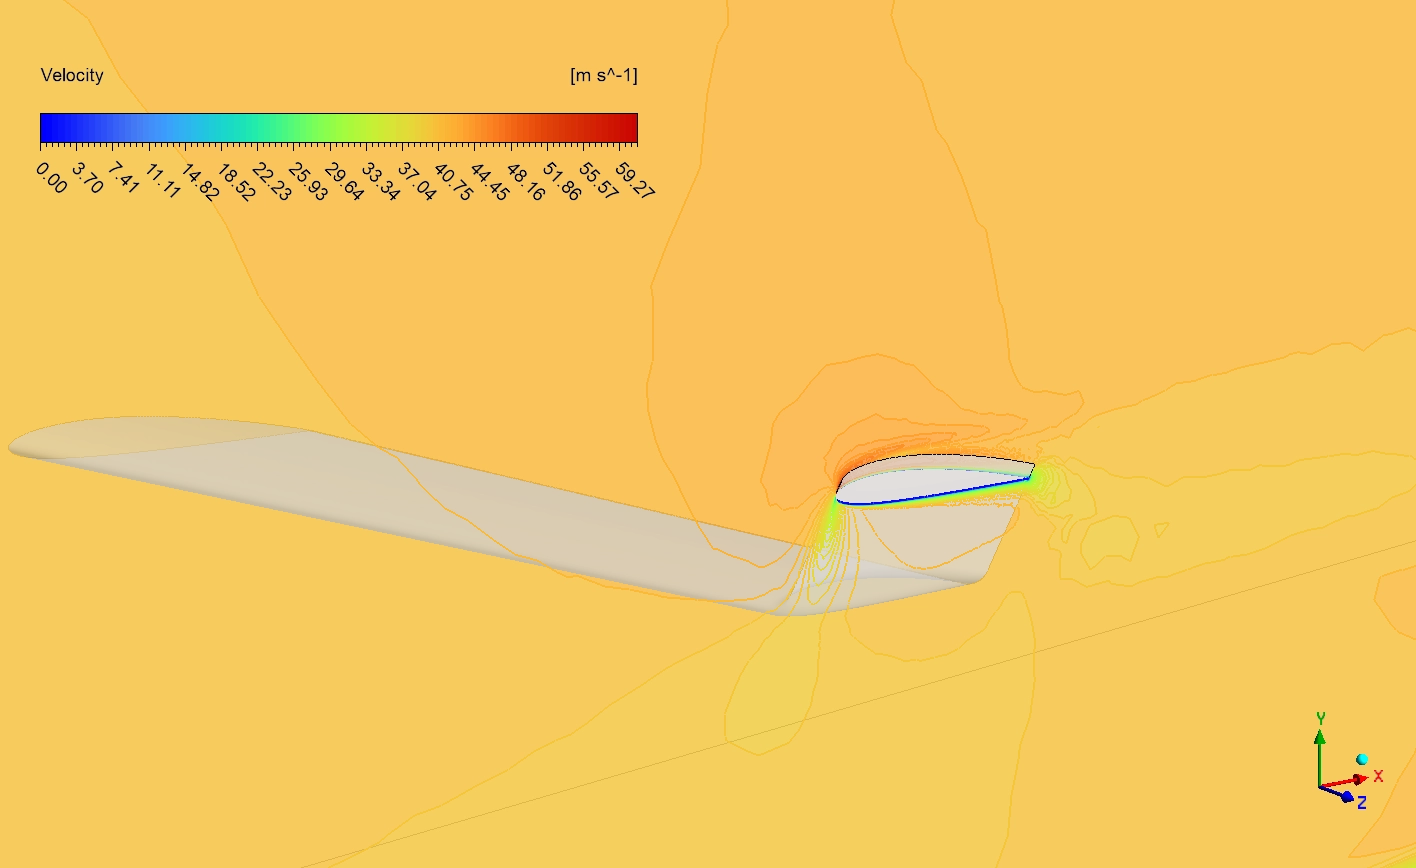
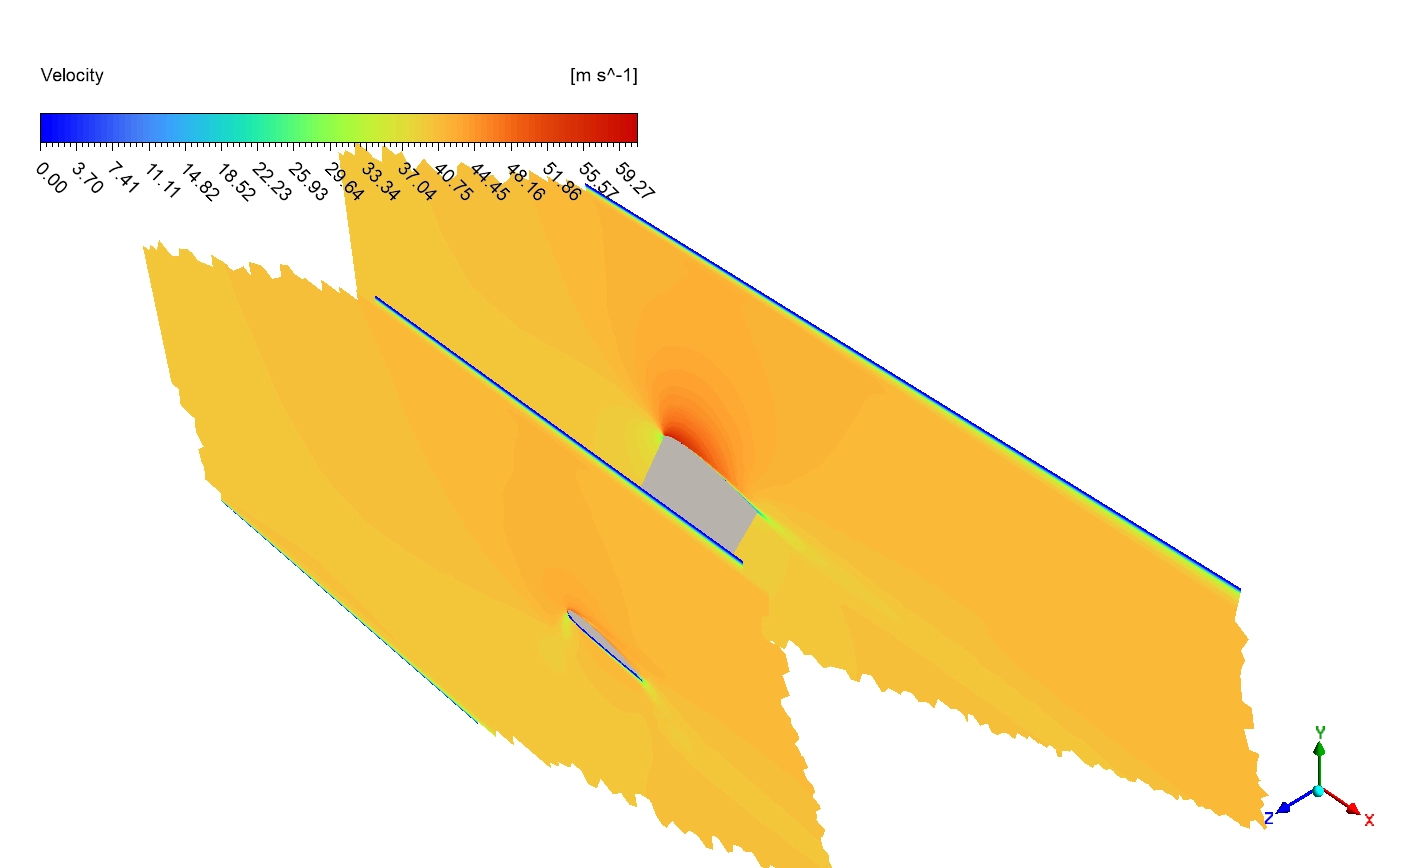
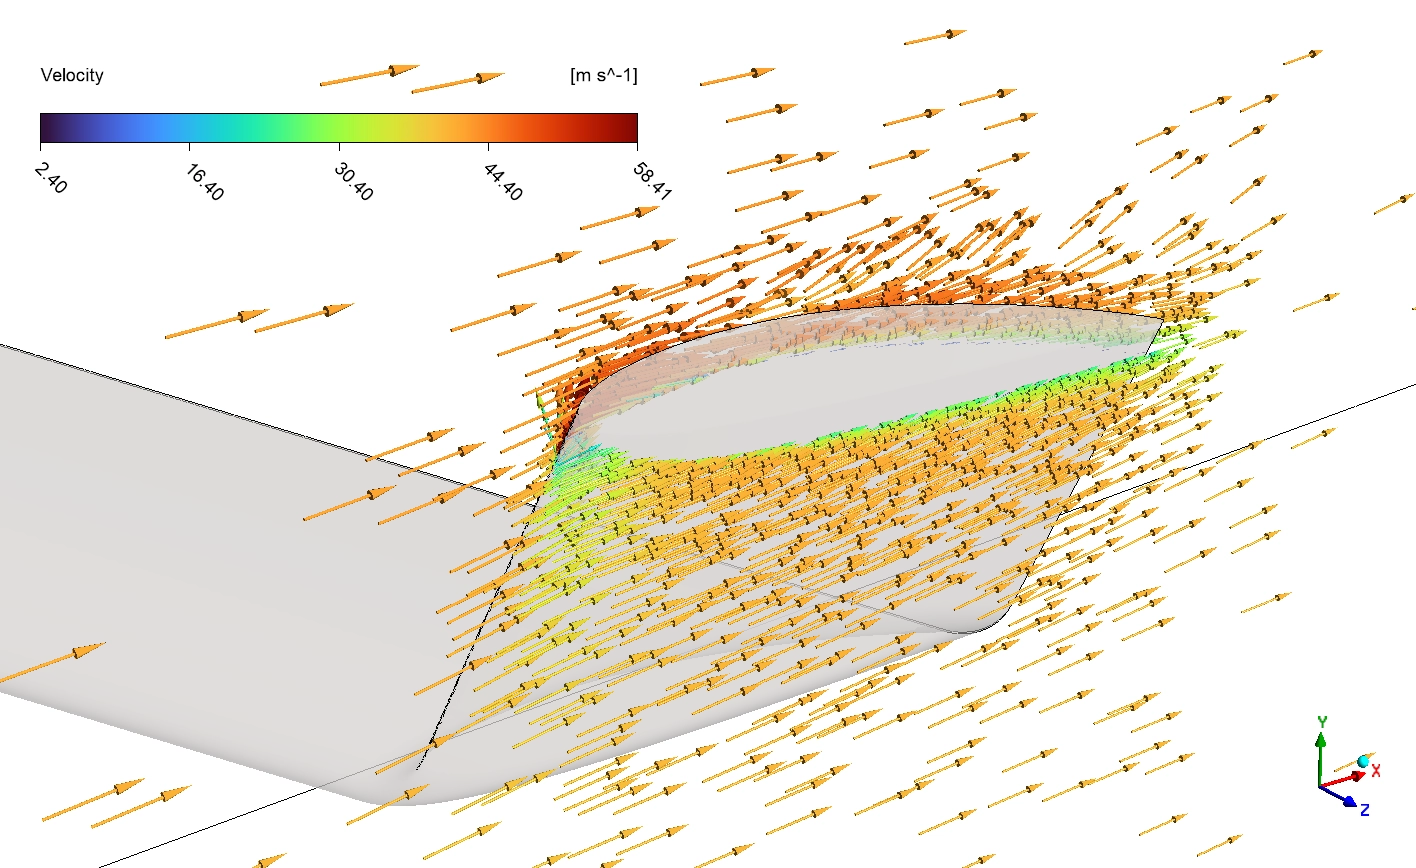
Finally, study the arrows in Figure 7. This is the Velocity vector field mapped precisely at the wing-winglet interface. The color legend tracks the absolute speed from exactly 2.40 to 58.41m/s. Look at the bright red and orange arrows at the front leading edge. These arrows hit the maximum speed of exactly 58.4m/s. Now follow these arrows backward along the vertical face of the winglet. They are perfectly parallel. They do not cross, and they do not spin. This organized downwash proves that the exact 71 ° angle intercepts the heavy high-pressure air flawlessly. Because the flow is perfectly structured, the airplane suffers zero form drag penalty while gaining maximum lift efficiency. This visual proof confirms exactly why Candidate 1 achieved the incredible efficiency rating of 19.77.
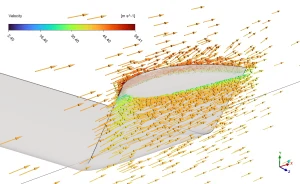
Figure 7: The Velocity vector field proving the exactly 71° angle organizes the flow cleanly to reach 58.41 m/s with zero separation.
Frequently Asked Questions (FAQ)
- Why do wingtip vortices create induced drag?
- Vortices steal forward kinetic energy from the airplane and turn it into useless spinning energy. This spinning air also alters the physical downwash angle behind the wing, which effectively tilts the lift force backward. This backward lift force acts directly as physical drag.
- Why did the algorithm choose a 71-degree angle instead of a 90-degree straight wall?
- A straight 90 [°] wall creates a very sharp physical corner. Sharp corners in fluid dynamics cause the boundary layer to detach, which creates severe form drag. A 71 ° angle blends smoothly with the main wing, preventing separation while still blocking the escaping vortex air.
- What is the MOGA method in ANSYS?
- MOGA stands for Multi-Objective Genetic Algorithm. It is a smart mathematical search tool inside ANSYS Direct Optimization. It mimics biological evolution. It tests random shapes, kills the bad ones, and breeds the best ones together over multiple iterations to find the absolute strongest physical design.


Reviews
There are no reviews yet.