

A Savonius Vertical Axis Wind Turbine (VAWT) is a drag-based machine. The wind pushes against its curved blades (buckets), causing it to rotate. While the design is simple and reliable, the airflow around it is extremely complex. The flow separates from the blades, creates large wakes, and is highly turbulent. To design efficient turbines, engineers must accurately predict this behavior using CFD simulation.
However, no single mathematical model fits every problem. This project investigates the Effect of Turbulence Models on the aerodynamic performance of a 2D Savonius turbine. We perform a comparative CFD study using ANSYS Fluent to see how different mathematical approaches change the results. We compare four specific models: k-omega SST, SST Transition, Spalart-Allmaras, and the Reynolds Stress Model (RSM). The simulation setup is based on the parameters from the study by Talukdar et al. [1]. For a foundational understanding of green energy simulations, consult resources such as Renewable Energy Tutorials.
- Reference [1]: Talukdar, Parag K., Vinayak Kulkarni, and Ujjwal K. Saha. “Performance Characteristics of Vertical-Axis Off-Shore Savonius Wind and Savonius Hydrokinetic Turbines.” International Conference on Offshore Mechanics and Arctic Engineering. Vol. 51319. American Society of Mechanical Engineers, 2018.
- Reference [2]: Farajyar, Shayan, et al. “CFD investigation and optimization on the aerodynamic performance of a Savonius vertical axis wind turbine and its installation in a hybrid power supply system: a case study in Iran.” Sustainability6 (2023): 5318.
![A schematic showing the basic design and operation of a Savonius VAWT [2].](https://cfdland.com/wp-content/uploads/2024/04/Picture1-3.png)
Figure 1: Schematic of the Savonius VAWT geometry used to study the effect of turbulence models [2].
Simulation Process: Sliding Mesh and Model Selection
To simulate a rotating machine like a Savonius turbine in Fluent, we need a specific strategy. We divided the geometry into two zones. The inner zone is circular and contains the turbine blades. This zone rotates. The outer zone is stationary and represents the far-field air. We created a high-quality mesh for both zones, ensuring the interface between them matches perfectly.
In ANSYS Fluent, we used the Sliding Mesh technique. This allows the inner mesh to physically rotate at every time step, which is essential for capturing the transient nature of the flow. The core of this CFD analysis is the comparison of four turbulence models:
- Spalart-Allmaras: A simple one-equation model often used for aerospace.
- k-omega SST: A robust two-equation model that handles wall separation well.
- SST Transition: Similar to k-omega but includes equations to predict laminar-to-turbulent transition.
- Reynolds Stress Model (RSM): A complex model that solves equations for every stress component (anisotropic turbulence).
By running the exact same 2D Savonius turbine simulation with these four different settings, we can isolate the Effect of Turbulence Models on the results.
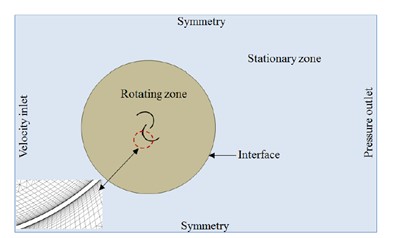
Figure 2: Computational domain showing the rotating and stationary zones for the Savonius CFD simulation. [1].
Post-processing: Analyzing Wakes and Velocity Fields
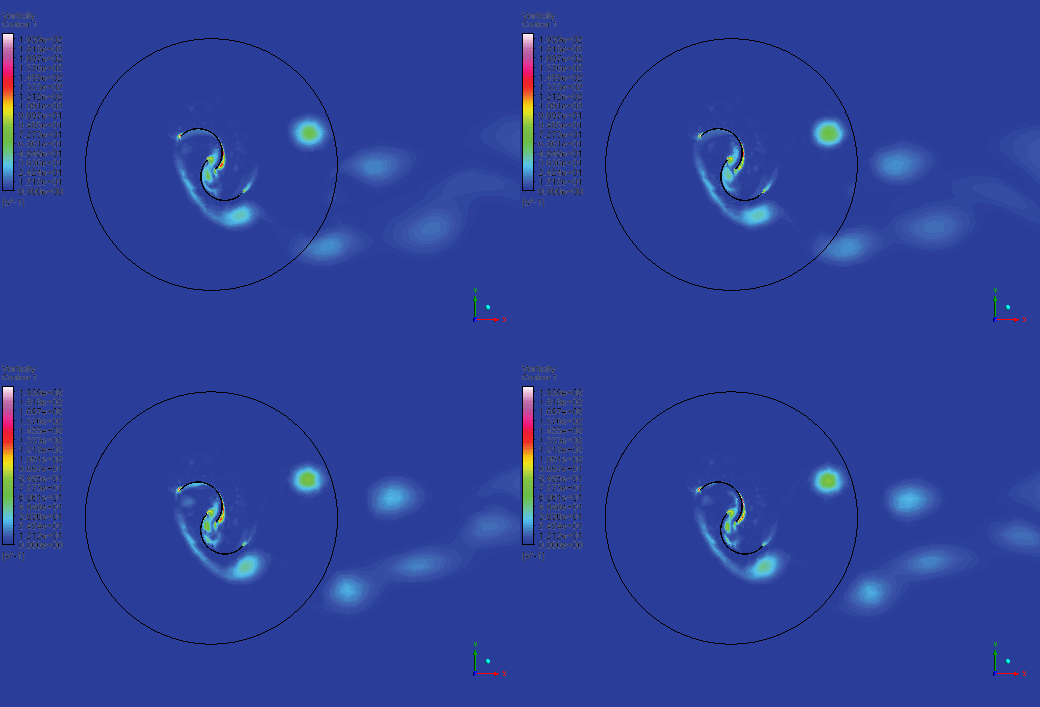
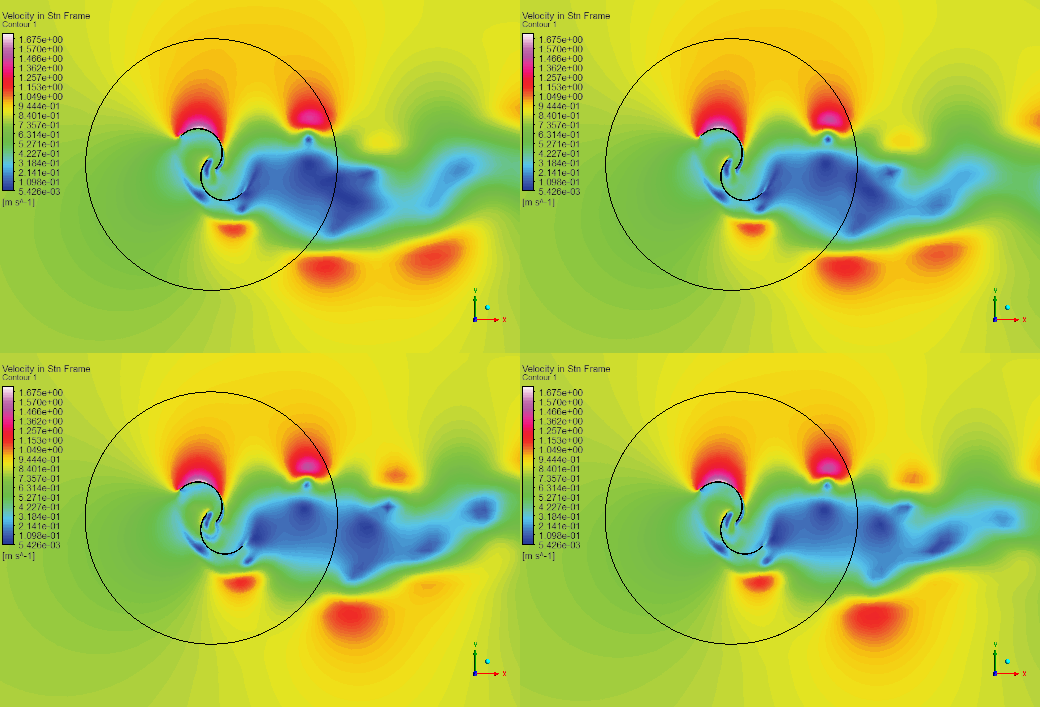
The results reveal significant differences in how each model predicts the airflow. Figure 3 displays the velocity contours for all four cases. First, let’s look at the similarities. All models predict high velocity at the tip of the “advancing blade” (the blade moving into the wind). The maximum velocity recorded is approximately 1.675 m/s. This high-speed region creates low pressure, which generates the torque that spins the turbine.
Now, we analyze the differences, which highlights the Effect of Turbulence Models on 2D Savonius turbine physics. The biggest variation is in the wake region behind the turbine.
- Spalart-Allmaras: This simpler model predicts a very contained and narrow wake. It assumes turbulence is isotropic (the same in all directions), which simplifies the complex swirling flow behind the rotor.
- Reynolds Stress Model (RSM): This is the most physically complete model. It predicts a much larger, more diffuse, and wider wake. Because RSM calculates individual stress components, it better captures the “swirl” and the mixing of the turbulent air.
- k-omega SST & Transition: These models fall in the middle. They capture flow separation better than Spalart-Allmaras but are not as computationally expensive as RSM.
This comparison proves that for a Savonius turbine aerodynamic performance study, the choice of model dictates the wake prediction. If you are designing a wind farm where one turbine sits behind another, using a simple model like Spalart-Allmaras might underestimate the wake effect, leading to poor spacing decisions. Therefore, understanding the Effect of Turbulence Models is crucial for accurate Wind Turbine Performance CFD.
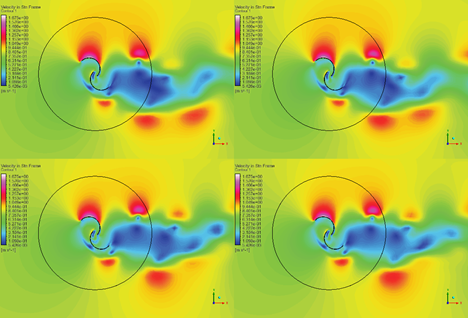
Figure 3: Comparison of velocity contours showing the different wake structures predicted by four turbulence models.
Key Takeaways & FAQ
- Q: Which turbulence model is best for a Savonius turbine?
- A: There is no single “best” model, but k-omega SST is often the industry standard because it balances accuracy (especially for flow separation on curved blades) with computational speed. However, for highly swirling flows or wake analysis, RSM provides the most physical detail.
- Q: What is the main effect of turbulence models on the results?
- A: The main Effect of Turbulence Models is observed in the prediction of flow separation (when air unsticks from the blade) and the wake structure. Different models calculate the turbulent viscosity differently, leading to different predictions of how far the wake extends downstream.
- Q: Why use the Sliding Mesh technique?
- A: The Sliding Mesh technique is the most accurate way to simulate a VAWT in ANSYS Fluent. Unlike “Moving Reference Frame” (MRF) which is for steady-state, Sliding Mesh actually moves the grid, capturing the unsteady interaction between the blades and the wind.


Reviews
There are no reviews yet.