


A Glass Greenhouse is a structure designed to create a controlled microclimate for optimal plant growth. Its operation is based on the “greenhouse effect.” The glass enclosure allows shortwave solar radiation to pass through and be absorbed by the soil and plants. These objects then re-radiate this energy as longwave infrared heat. The glass is opaque to this outgoing radiation, effectively trapping the heat and raising the internal temperature. This control is crucial for protecting crops and extending growing seasons.
To design these structures for maximum efficiency, engineers must understand the complex relationship between solar heating and internal air movement. A Glass Greenhouse CFD simulation is the perfect tool for this. It allows for a detailed analysis of temperature distribution and airflow without expensive physical prototypes. This project presents a Glass Greenhouse Fluent simulation that investigates the internal climate. For more projects involving solar energy, you can explore our Renewable Energy CFD Simulation category. The simulation setup is based on the experimental work in the reference paper by Awani et al. [1].
- Reference [1]: Awani, S., et al. “Numerical and experimental study of a closed loop for ground heat exchanger coupled with heat pump system and a solar collector for heating a glass greenhouse in north of Tunisia.” International Journal of Refrigeration76 (2017): 328-341.

Figure 1: A real-world example of a modern Glass Greenhouse facility.
Simulation Process: Solar Load Modeling with Fluent’s Ray Tracing
The simulation process for this Glass Greenhouse CFD study began with modeling the 2D geometry, including the soil and embedded pipes. A high-quality, structured mesh was generated to ensure accurate results, especially near the walls and floor where the most significant thermal changes occur. The core of this Glass Greenhouse ANSYS Fluent simulation was the solver setup. To accurately capture the effects of solar radiation, two powerful models were used together. First, the Discrete Ordinates (DO) radiation model was activated. This model is essential for calculating the exchange of radiative heat between all interior surfaces. Second, instead of manually defining a heat source, we used Fluent’s advanced Solar Ray Tracing module. This tool automatically calculates the solar heat load based on the geographical location, time of day, and date. For this simulation, the date was set to January 1st. This integrated approach provides a highly realistic and accurate simulation of how the sun directly impacts the greenhouse environment.
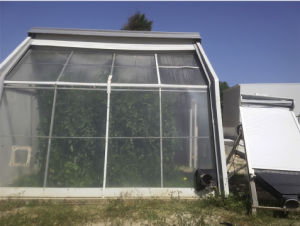
Figure 2: The experimental system layout from the reference paper [1] used as a basis for the CFD model.
Post-processing: Temperature Stratification and Natural Convection Analysis
The post-processing results clearly illustrate the successful capture of the greenhouse effect. The temperature contour in Figure 3 shows a significant temperature stratification, with a thermal gradient developing from the floor to the ceiling. The internal temperature ranges from a minimum of 33.24°C to a maximum of 81.56°C. The highest temperatures are concentrated at the ground level. This is a direct result of the solar radiation passing through the glass and being absorbed by the soil, which then stores this thermal energy. This detailed thermal mapping is critical for greenhouse design, as it allows engineers to predict hot and cold zones and optimize climate control systems.
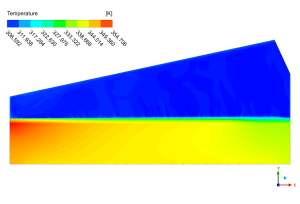
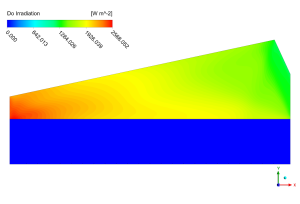
Figure 3: Temperature distribution from the Glass Greenhouse CFD Simulation, showing heat concentration at ground level.
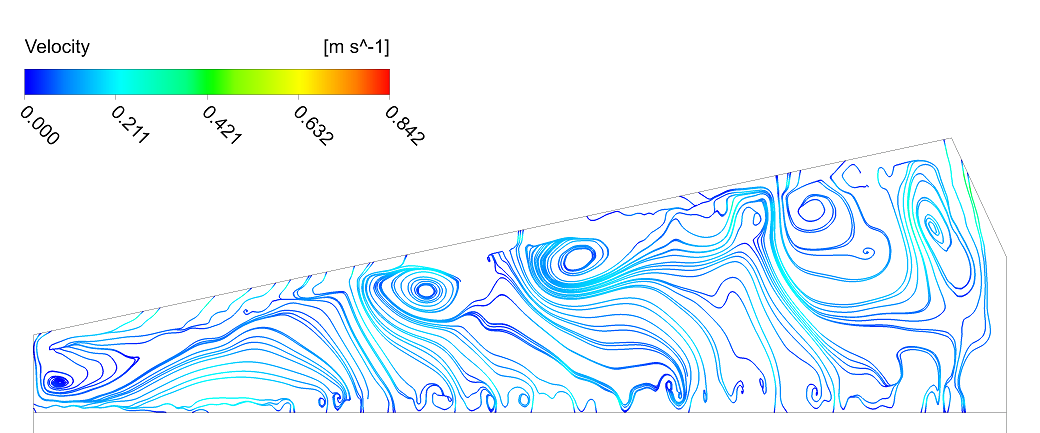
The velocity streamlines in Figure 4 reveal the direct consequence of this temperature difference: the formation of large-scale natural convection loops. As the air near the hot ground heats up, its density decreases, causing it to rise. Conversely, the air near the cooler glass walls loses heat, becomes denser, and sinks. This continuous cycle creates several large, rotating air cells that dominate the internal airflow, with velocities reaching up to 0.84 m/s. This air movement is essential for the greenhouse’s function. These convection currents are the primary mechanism for distributing the solar heat absorbed by the floor throughout the entire greenhouse, preventing extreme hot spots and ensuring a more uniform environment for plant growth. This Greenhouse CFD analysis demonstrates precisely how solar energy drives the thermal and fluid dynamic behavior that defines the internal climate.
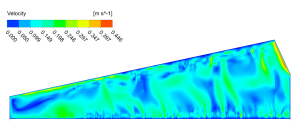
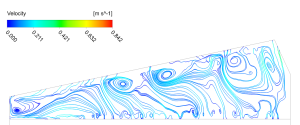
Figure 4: Velocity streamlines showing large natural convection cells driven by solar heating.
Key Takeaways & FAQ
- Q: What is the difference between Solar Ray Tracing and the DO radiation model in a Glass Greenhouse Fluent simulation?
- A: They work together. Solar Ray Tracing is an external load model that calculates how much energy from the sun enters the greenhouse. The Discrete Ordinates (DO) model is an internal model that calculates how that energy (now heat) is radiated and exchanged between the internal surfaces like the floor, walls, and plants.
- Q: What is natural convection in a greenhouse?
- A: Natural convection is the air movement caused by temperature differences. In a greenhouse, the sun heats the floor, which heats the air above it. This hot air rises, and cooler air from the walls sinks to take its place, creating a continuous circulation loop that distributes heat.
- Q: Why is CFD simulation useful for greenhouse design?
- A: A Greenhouse CFD simulation allows designers to visualize and predict the internal temperature and airflow patterns under different conditions (e.g., different seasons, materials, or vent placements). This helps optimize the design for energy efficiency and ideal plant growth without building expensive physical prototypes.


Reviews
There are no reviews yet.