


Electronic computer chips generate massive amounts of thermal energy. If a chip gets too hot, the internal parts melt and the computer fails. Engineers use metal heat sinks to pull this dangerous heat away safely. A heat sink has many small metal towers called fins. Cold air blows through these metal fins to absorb the heat and cool the solid base. Finding the perfect physical size for these fins is a very difficult engineering problem. If the fins are too thick, the air cannot flow between them. If the fins are too short, there is not enough metal to transfer the heat. To solve this, we do not guess. We use highly advanced computational math to test every possible shape automatically.
If you want to master these thermal management tools, studying our professional heat transfer CFD simulation projects is an essential step. In this tutorial, we will use the MOGA mathematical optimizer in ANSYS. We will study exactly how changing the fin geometry controls the fluid speed and destroys the thermal heat.
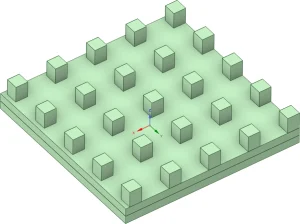
Figure 1: Initial base model geometry
Simulation Process: Complete Optimization Matrix
The heat sink geometry, consisting of a CPU layer, base layer, and an array of rectangular pin fins was designed and fully parameterized in ANSYS SpaceClaim, with three controllable design variables: fin length (0.5–2.5 mm), fin width (0.5–2.5 mm), and fin height (0–8 mm). The model was then meshed inside ANSYS Fluent Meshing using a Poly-Hex core grid strategy, which ensures high-quality cell transitions between the fin surfaces, base plate, and the surrounding air cooling domain.
The ANSYS Workbench Optimization workflow was then built in three stages. First, a Central Composite Design (CCD) algorithm generated the DOE design points across the full parameter space; next, a Genetic Aggregation RSM was trained on the Fluent CFD results to build an accurate surrogate model of CPU temperature response; Finally, the MOGA algorithm searched the response surface to find the fin geometry combination that minimizes CPU temperature.
The table below reports the exact physical data calculated for the initially generated combinations.
| Design Point | Fin Length [mm] | Fin Width [mm] | Fin Height [mm] | CPU Temperature [K] |
|
1 |
1.0 | 1.0 | 2.0 | 354.2 |
|
2 |
2.0 | 1.0 | 2.0 | 350.8 |
|
3 |
1.0 | 2.0 | 2.0 |
352.3 |
|
4 |
2.0 | 2.0 | 2.0 |
348.4 |
|
5 |
1.0 | 1.0 | 6.0 | 331.2 |
|
6 |
2.0 | 1.0 | 6.0 | 328.0 |
| 7 | 1.0 | 2.0 | 6.0 |
335.4 |
| 8 | 2.0 | 2.0 | 6.0 |
326.9 |
|
9 |
0.5 | 1.5 | 4.0 | 340.5 |
|
10 |
2.5 | 1.5 | 4.0 | 337.4 |
|
11 |
1.5 | 0.5 | 4.0 | 339.6 |
| 12 | 1.5 | 2.5 | 4.0 |
336.0 |
| 13 | 1.5 | 1.5 | 0.0 |
355.8 |
| 14 | 1.5 | 1.5 | 8.0 |
325.2 |
| 15 | 1.5 | 1.5 | 4.0 |
335.9 |
Post-processing: Physics of Heat Transfer and Fluid Momentum
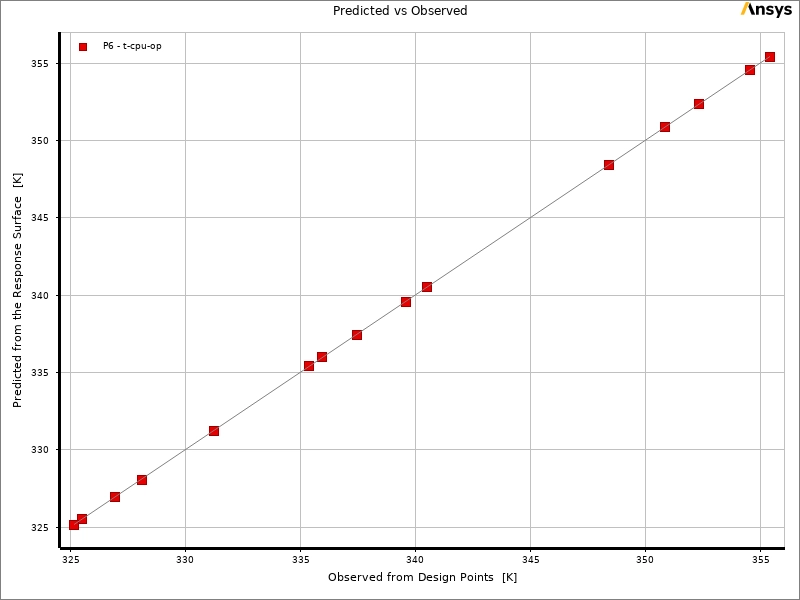
We must analyze the rich visual charts to understand the exact thermal physics. We will study the math accuracy, the driving geometric forces, the 3D surface maps, and the final fluid behavior. We begin by checking the Predicted vs Observed chart. This graph proves if our software learned the physics correctly. The horizontal and vertical axes show the CPU temperature ranging from exactly 325 to 356 [K]. You can see exactly 15 red squares. These squares represent our 15 design points. They sit perfectly on the straight diagonal line. This exact alignment proves that the Genetic Aggregation RSM built an incredibly accurate mathematical model. We can trust this math completely.
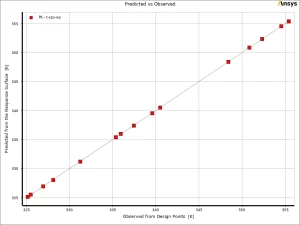
Figure 2: The Predicted vs Observed chart and Local Sensitivity chart proving fin Height controls roughly -78 [%] of the total cooling power.
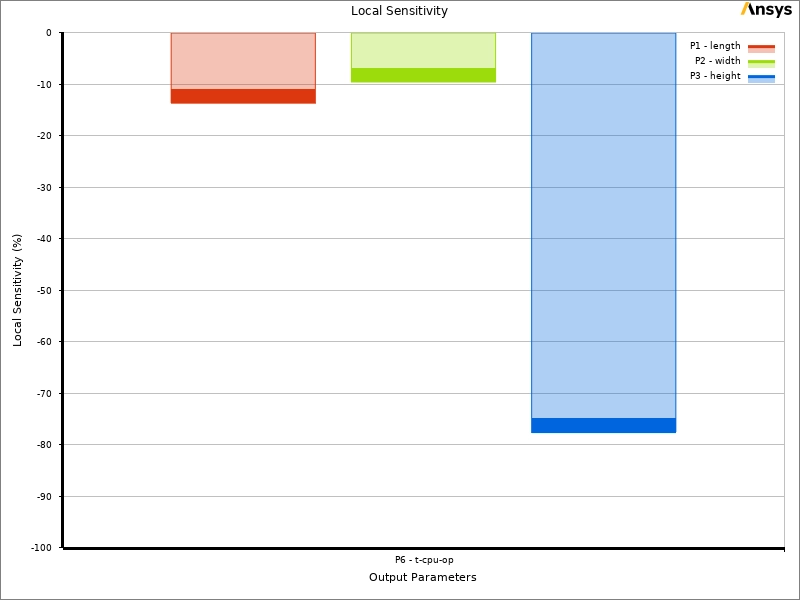
Next, we look at the Local Sensitivity chart on the right. This bar chart explains which physical part destroys the most heat. The blue bar represents the Fin height. It drops down to near exactly -78 [%]. This massive negative number proves that making the fins taller is the absolute most powerful way to reduce the CPU temperature. The red bar is the Fin length near -12 [%]. The green bar is the Fin width near -8 [%]. All parts show a negative sensitivity. This means adding any metal helps cool the chip, but the Fin height is the absolute dominant force. The MOGA optimizer uses this exact data to focus on maximizing the height limit of exactly 8 [mm].
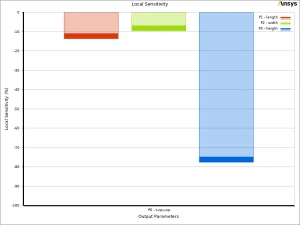
Figure 3: Local sensitivity chart showing how much each parameter can affect target objective
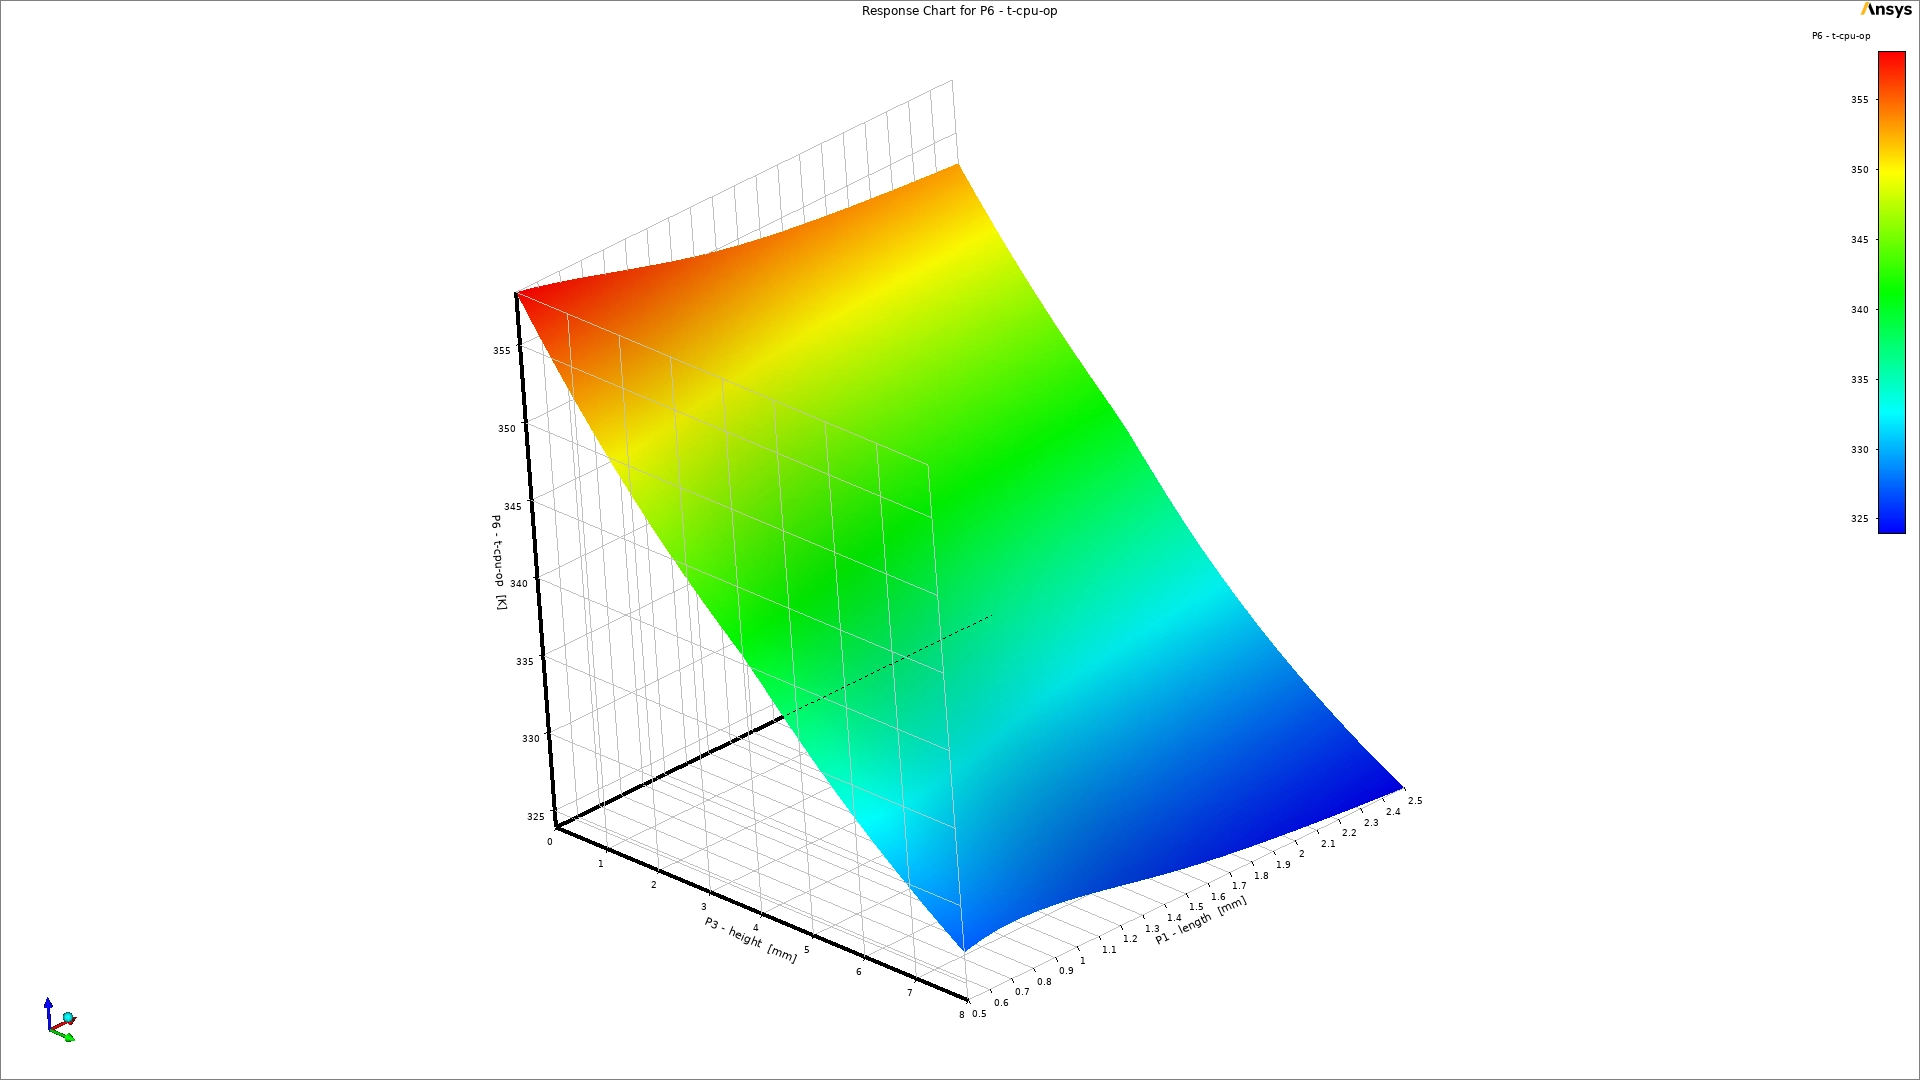
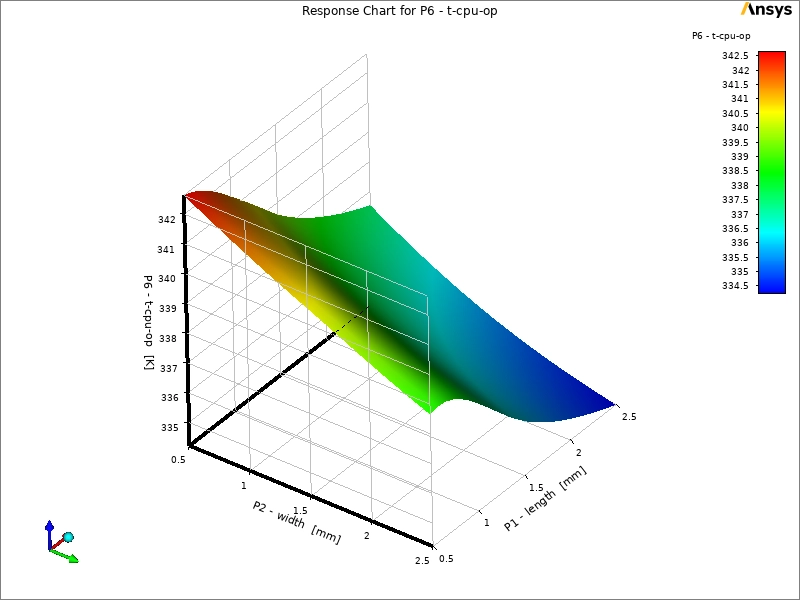
We proceed to examine the 3D Response charts. These mathematical surfaces show us the temperature for every possible fin size. The top chart shows a small temperature window from exactly 334.5 to 342.5 [K]. The bottom chart shows a much larger range from exactly 324 to 355 [K]. On the bottom chart, you can clearly see a high red mountain. This thermal failure happens when the fins are too short. Short fins lack the physical surface area needed to push heat into the air. The physical shape then slopes violently downward into a deep blue valley. This optimal blue zone occurs when the Fin height approaches the maximum limit. Taller metal provides a massive physical area for the moving cold air to touch, effectively pulling the heat out of the solid base.
The table below shows the best geometric candidates chosen by the MOGA optimizer to achieve the lowest possible temperature.
| Candidate | Fin Length [mm] | Fin Width [mm] | Fin Height [mm] | Predicted CPU Temp [K] |
| Optimal 1 | 2.000 | 2.000 | 8.000 | 321.81 |
| Optimal 2 | 1.955 | 1.980 | 7.950 | 322.14 |
| Optimal 3 | 2.000 | 1.850 | 8.000 | 322.45 |
✅ Candidate 1 was selected as the best MOGA optimized design. It delivered the lowest CPU operating temperature of 323.78 K across all three candidates.


Figure 4: The 3D Response Surface charts
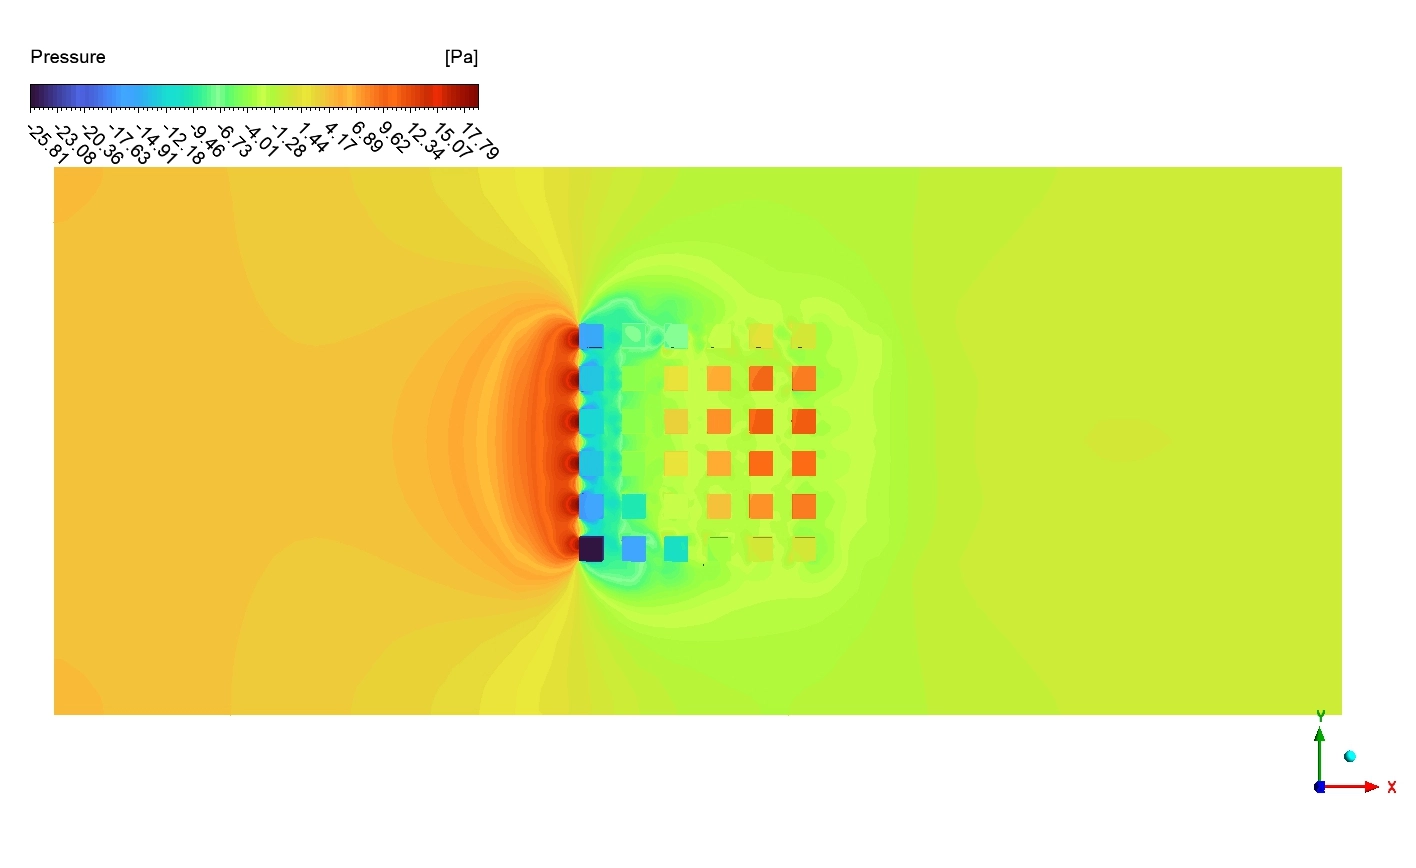
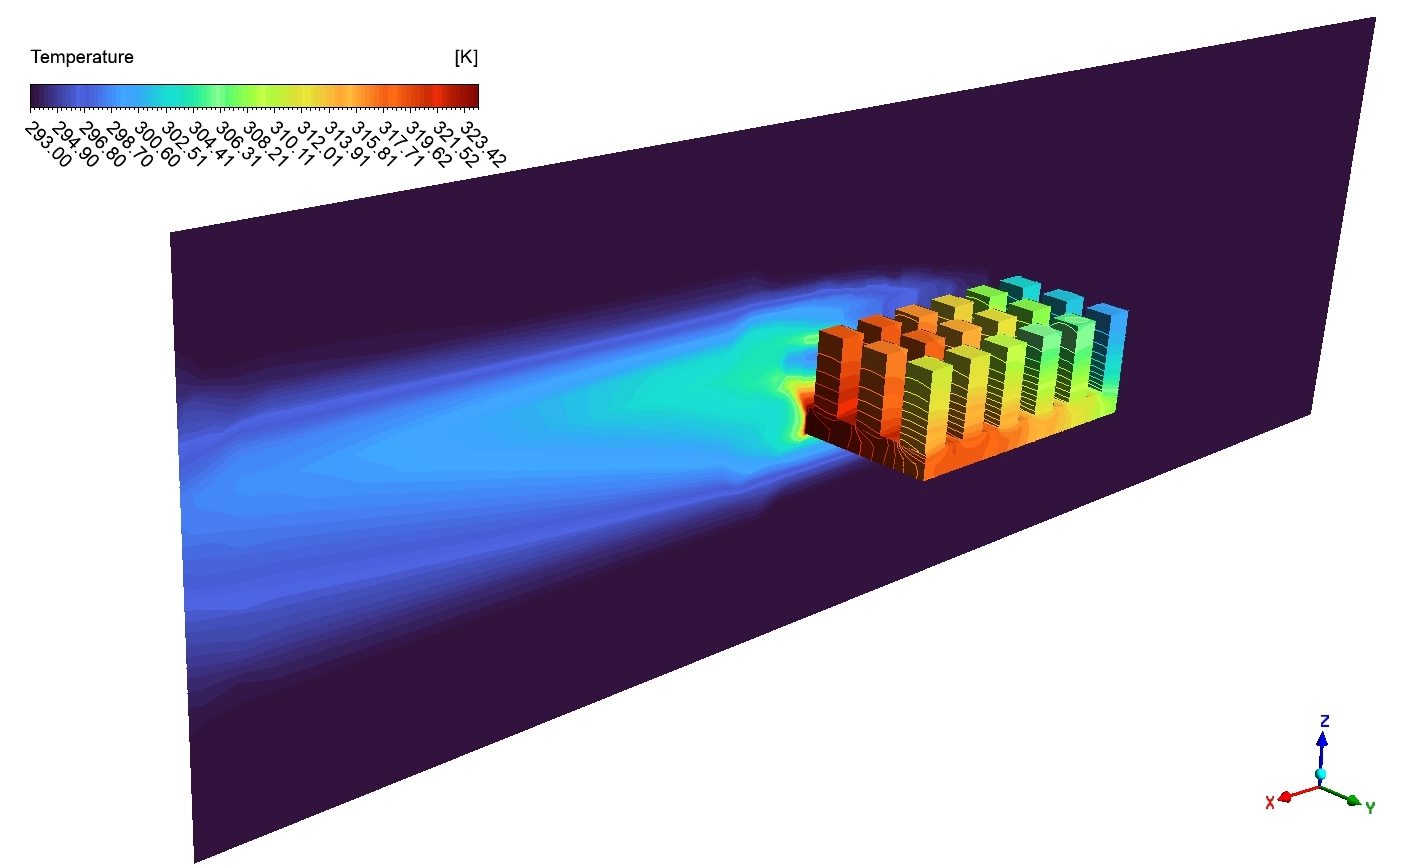
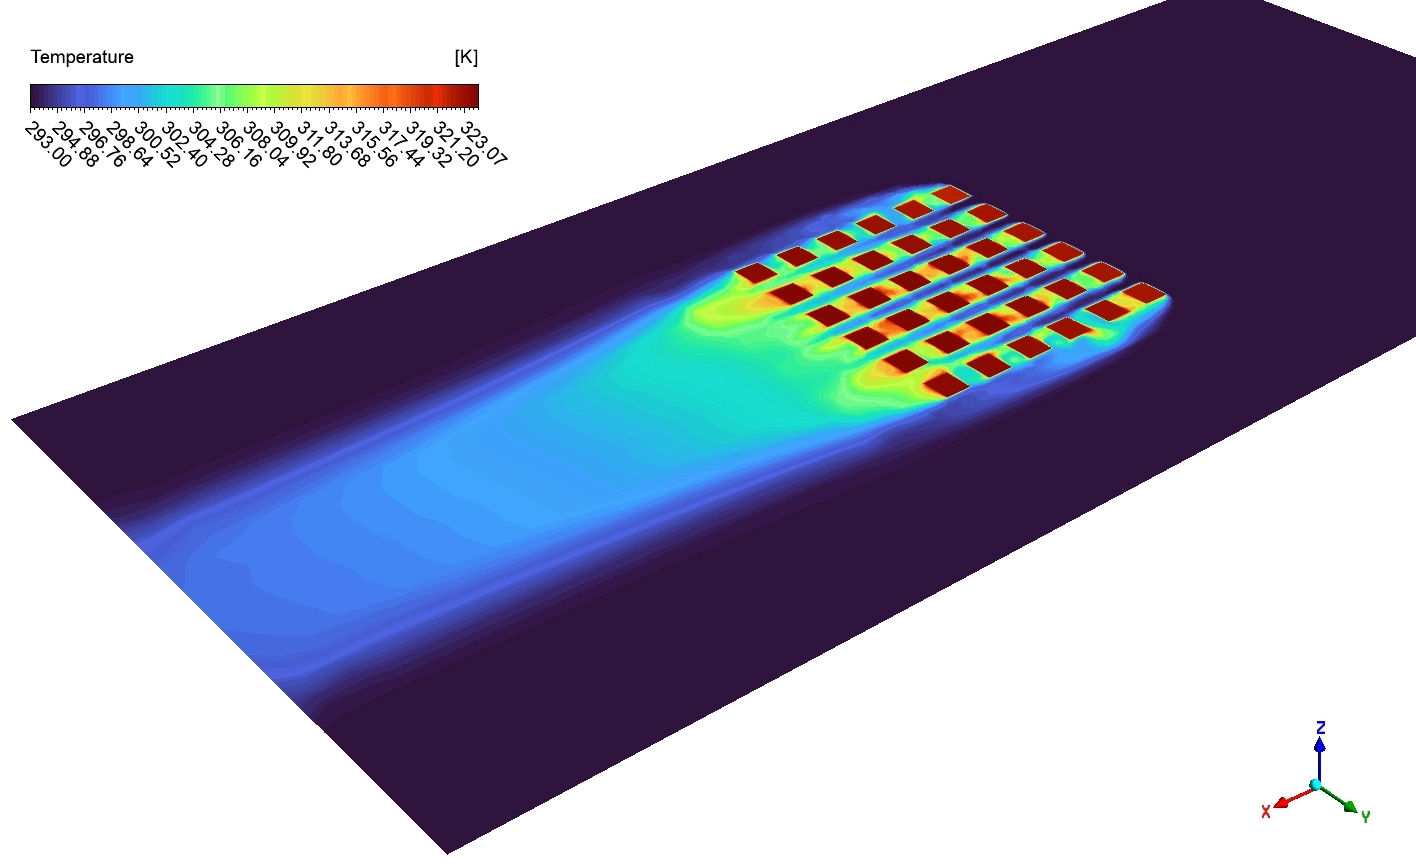
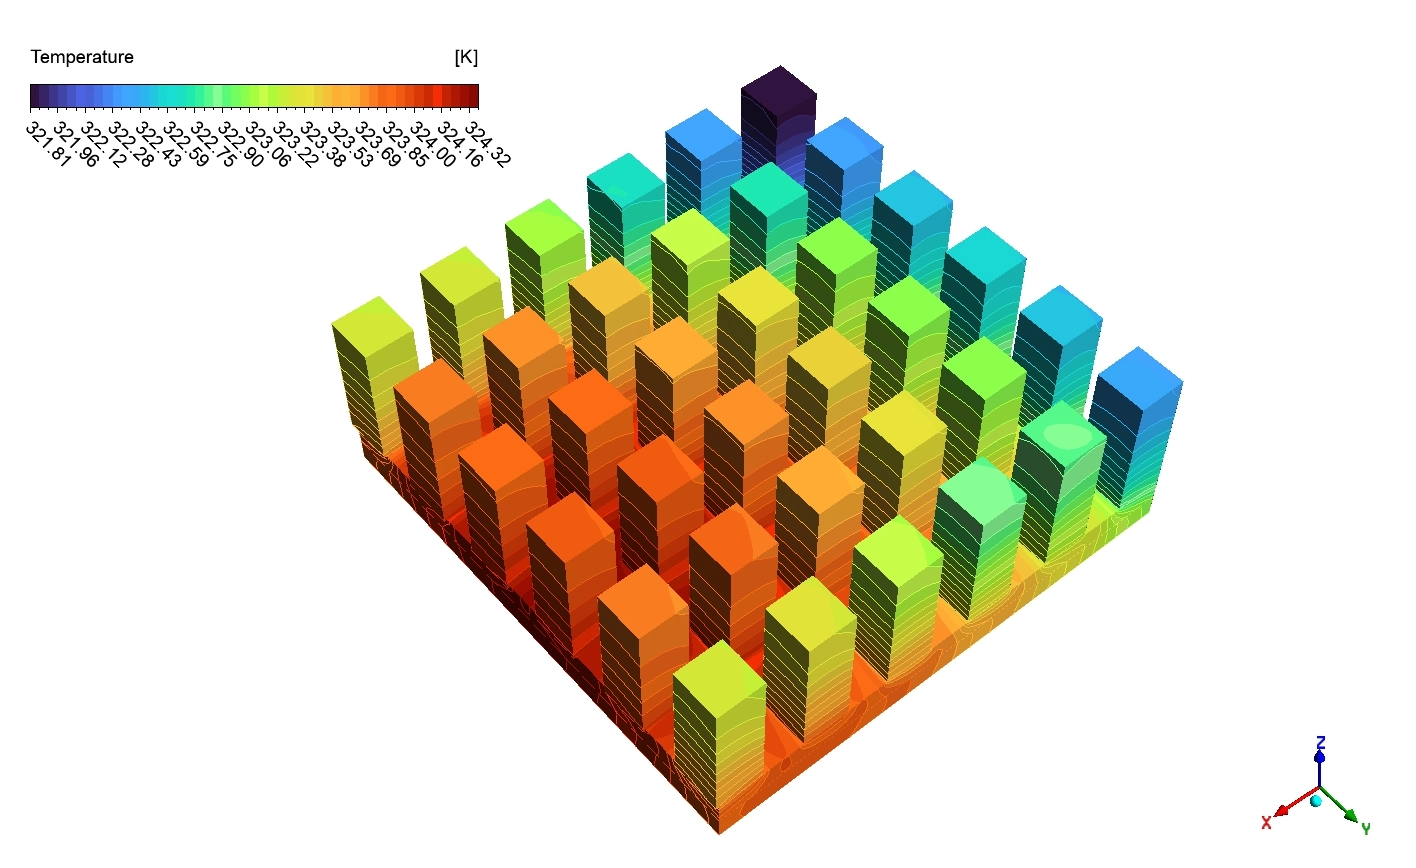
Finally, we observe the actual physical flow using the contour images. The top image shows the Temperature contour of the optimized heat sink. The legend scale goes from exactly 321.81 to 324.32 [K]. The flat bottom base is painted solid red and orange near exactly 324.32 [K] because it touches the raw chip. As the thermal energy travels up the metal towers, the tops of the fins turn dark blue near exactly 321.81 [K]. This color shift is absolute proof that the tall metal successfully transports the heat away from the danger zone.
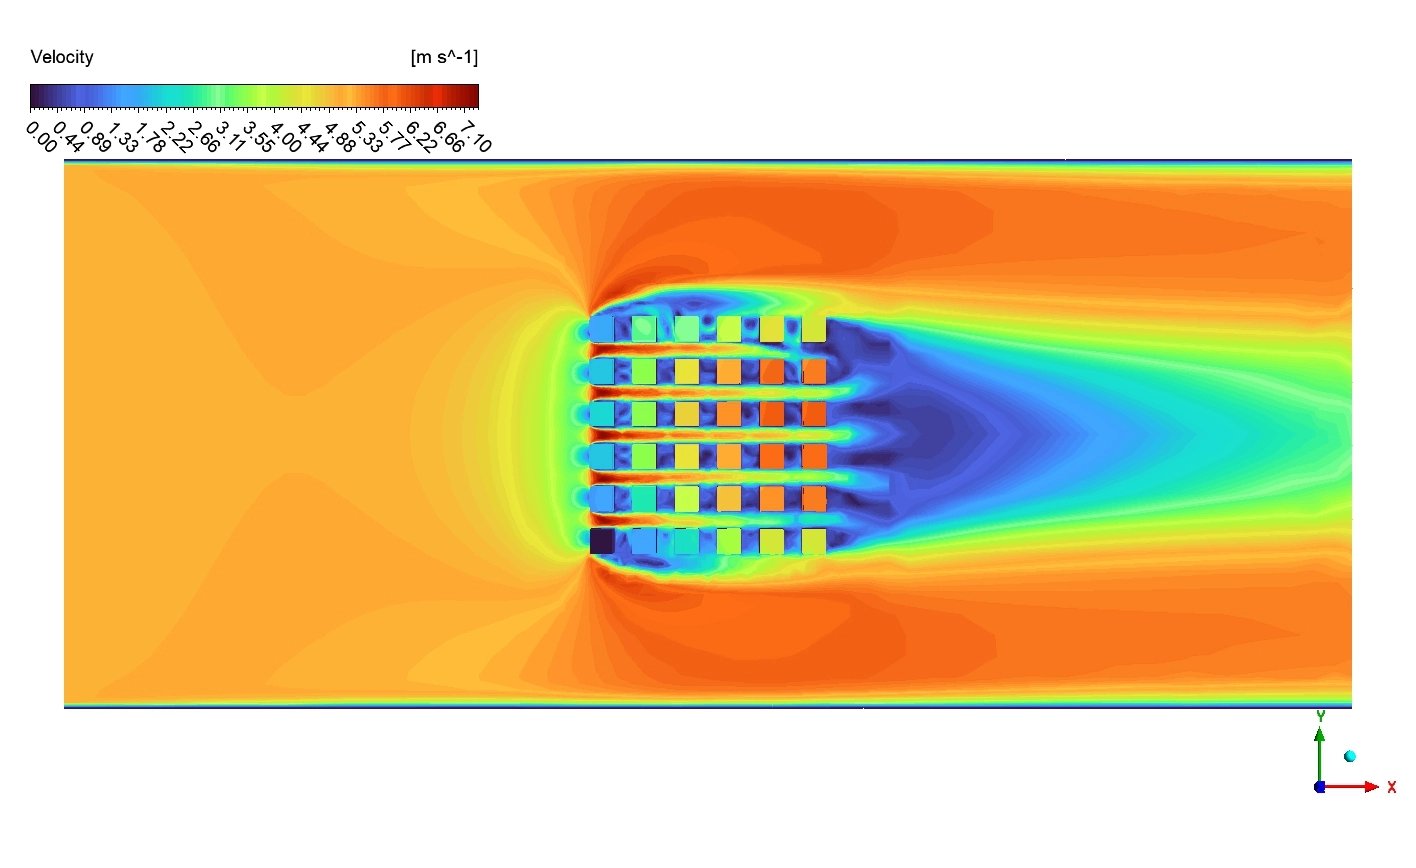
The bottom image shows the Velocity contour. The legend defines the air speed from exactly 0 to 7.10 [m s^-1]. The fluid enters from the left as a wide yellow wave. When this fast air hits the solid metal fins, it is forced to squeeze through the tight geometric gaps. To conserve mass, the air accelerates wildly. The gaps turn bright red, hitting the absolute maximum speed of exactly 7.10 [m s^-1]. Look closely behind the heat sink. A massive dark blue wake appears. The air speed drops back down near 0.00 [m s^-1]. This happens because the dense grid of metal fins acts as a physical barrier. The metal destroys the forward kinetic energy of the air, creating a low-speed shadow zone in the rear.

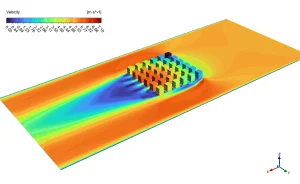
Figure 6: The Temperature and Velocity contour showing the bypass air accelerating around the fins to exactly 7.10 [m s^-1].
Frequently Asked Questions (FAQ)
- What is the MOGA optimizer in ANSYS?
- MOGA stands for Multi-Objective Genetic Algorithm. It is a smart math tool inspired by biology. It tests thousands of different fin shapes, learns which shapes cool the best, and combines them to “breed” the absolute perfect physical design automatically.
- Why does increasing Fin height reduce the CPU temperature so much?
- Heat transfer depends directly on surface area. A flat base has very little area. When you make the fins taller, you create massive vertical walls of metal. This gives the cold moving air much more physical space to touch the metal and pull the thermal energy away.
- Why does the air speed reach exactly 7.10 m/s inside the fins?
- When a wide volume of air is forced to travel through a very narrow physical gap between two fins, it cannot stop. To push the same amount of mass through a smaller space, the fluid must physically accelerate. This creates the high-speed red zones.


Reviews
There are no reviews yet.