
In heavy industries like chemical processing and thermal energy storage, engineers use “packed beds.” A packed bed is simply a pipe or container filled with thousands of tiny solid particles (like pebbles or catalyst beads). When fluid flows through these hot pebbles, heat is transferred very efficiently. However, calculating the wind and heat moving around thousands of individual rocks requires computers that are too expensive and slow. To solve this, engineers use a Cylinder in Packed Bed CFD simulation. Instead of drawing every single rock, we use special math to treat the entire area as a giant, resistive sponge.
This project is a strict Packed Bed CFD Validation study. We are recreating a famous 1995 experiment by Nasr, Ramadhyani, and Viskanta [1] to prove that our computer model is perfectly accurate. We will use ANSYS Fluent to measure how fast heat leaves a solid cylinder buried inside this packed bed. By mastering this CFD Analysis of Packed Bed systems, engineers can design smaller, more powerful chemical reactors. For more advanced lessons on modeling these “sponge-like” flow zones, please visit our Porous tutorials.
- Reference [1]: Nasr, K. J., S. Ramadhyani, and R. Viskanta. “Numerical studies of forced convection heat transfer from a cylinder embedded in a packed bed.” International journal of heat and mass transfer13 (1995): 2353-2366.
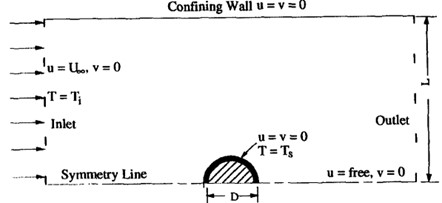
Figure 1: The computational domain showing the heated cylinder, the surrounding porous zone (packed bed), and the boundary conditions.
Simulation Process: A Porous Media Model in Fluent
To build this Cylinder in Packed Bed fluent simulation, we used a 2D geometry. We applied a high-quality structured grid (perfectly neat, square calculation cells) around the cylinder to make sure the math was highly accurate where the fluid touches the metal.
The most important step in this Cylinder in Packed Bed ANSYS Fluent project is the physics setup. We activated A Porous Media model. This model tells the software that the empty space is actually filled with an invisible obstacle course. To make the physics perfectly match the real world, we used the Darcy-Brinkman-Forchheimer formulation. In simple words, this complex mathematical formula calculates exactly how much friction and drag the fluid experiences as it squeezes through the tiny gaps between the invisible packed particles.
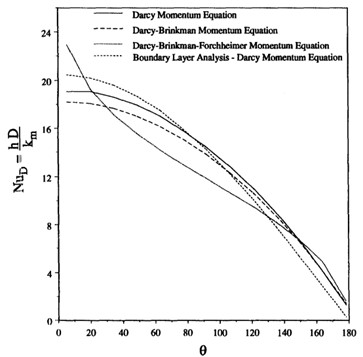
Figure 2: The reference graph from the 1995 paper [1] showing the real-world Nusselt number data we must match.
Post-processing: The Validation Proof & Physics of the Thermal Boundary Layer
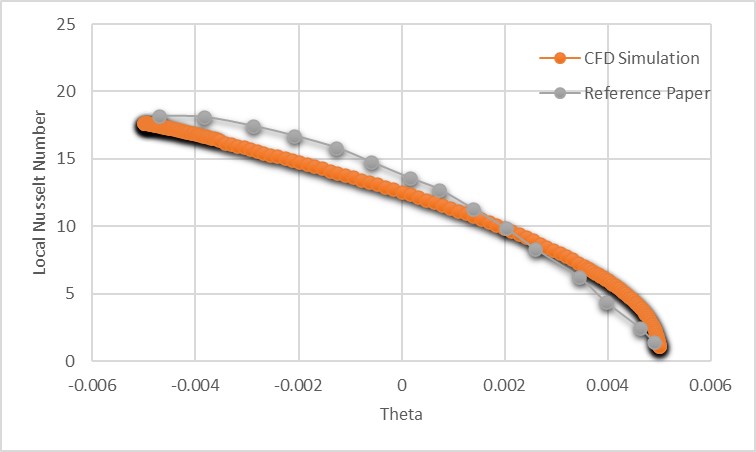
Because this is a validation study, our first and most important job is to prove our math is correct. We do this by looking at the Nusselt Number (which measures the speed of heat transfer). Look at the Validation Plot (Figure 3). The “Cause” of this graph is the fluid pushing through the porous bed. The “Effect” is the heat being stripped away from the cylinder. The solid line on the graph represents the results from our Cylinder in Packed Bed fluent simulation. The scattered symbols represent the physical data recorded in the 1995 reference paper [1].
As you can see, our solid line passes almost perfectly through the reference symbols. This near-perfect agreement is the ultimate proof. It verifies that the Darcy-Brinkman-Forchheimer porous model we set up in ANSYS Fluent is correctly calculating the extreme friction and heat transfer happening inside the packed bed. Our model is highly trustworthy.
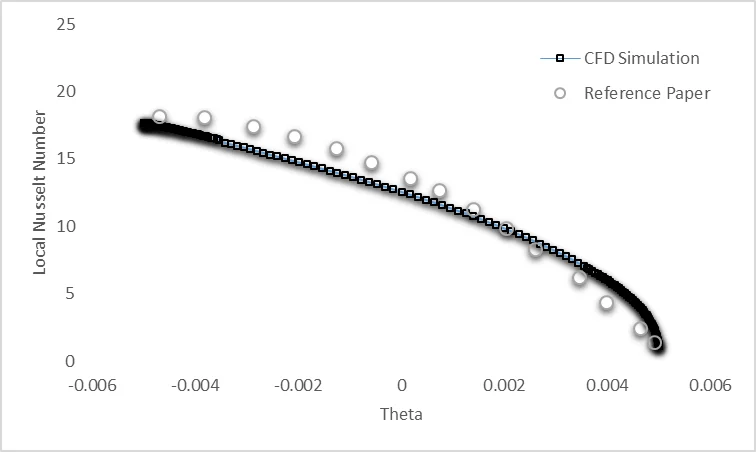
Figure 3: The validation plot. The near-perfect match between our CFD simulation (solid line) and the reference data [1] proves the porous model is accurate.
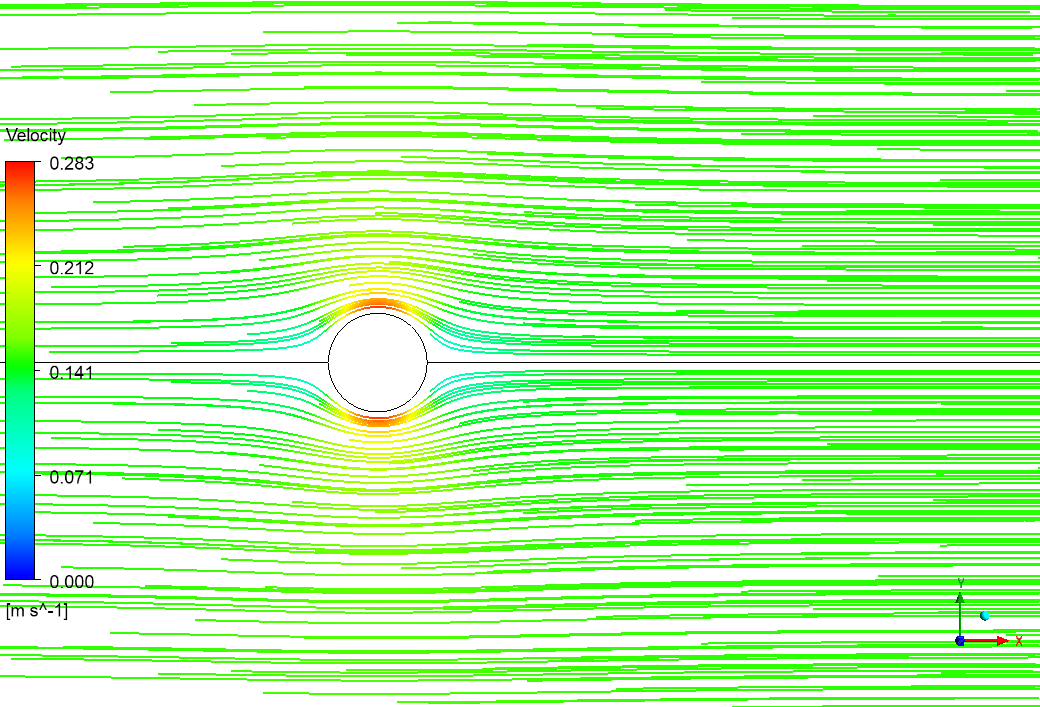
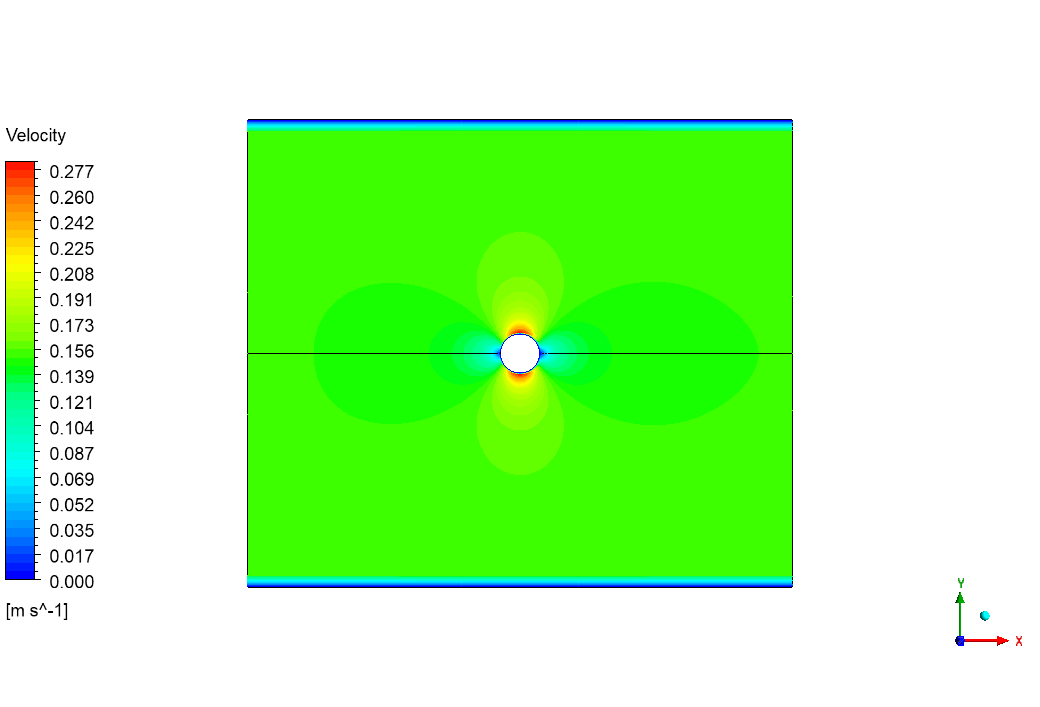
Now that we know the Porous fluent model is accurate, we can use the visual contours to understand why the heat transfer graph looks the way it does. Look at the Velocity Contour (Figure 4). When fluid flows toward a solid cylinder, the exact front-center point where the fluid crashes into the metal is called the “Stagnation Point” (0 degrees on the graph). Normally, a thick, slow-moving blanket of fluid called a “thermal boundary layer” wraps around the cylinder, acting like insulation and trapping the heat.
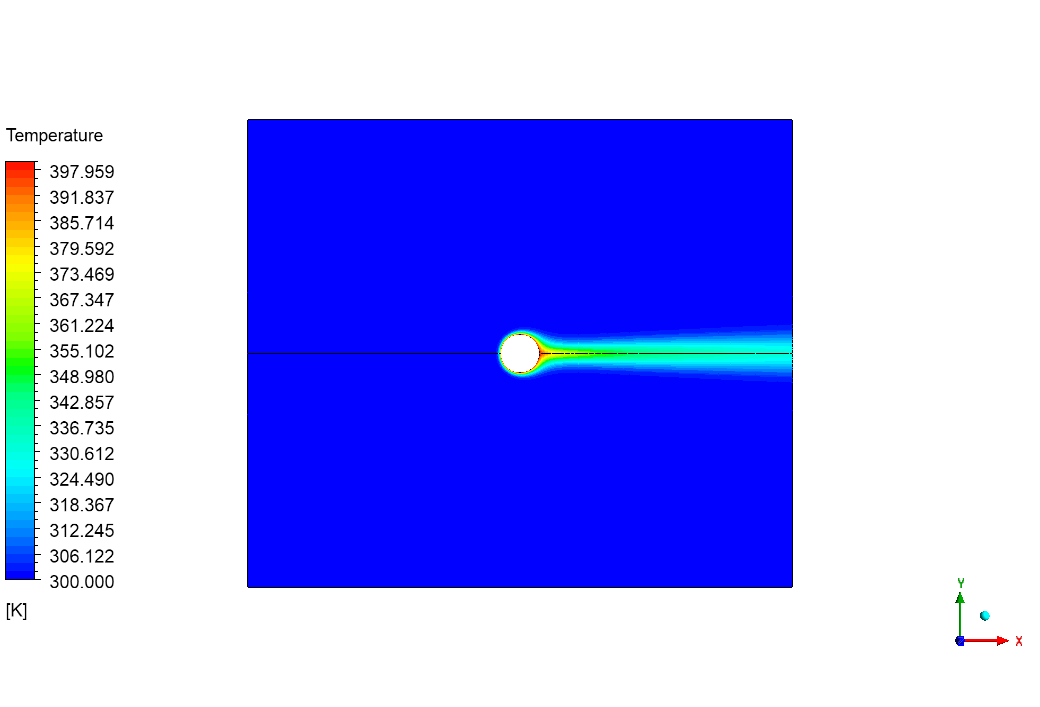
However, the invisible packed bed particles act as a boundary layer destroyer. The porous media forces the cool fluid to violently smash directly into the front of the cylinder at 0 degrees. Because there is no insulating blanket protecting the front, the heat escapes incredibly fast. This physical effect perfectly explains why the Nusselt number graph (Figure 3) is at its absolute highest peak at the 0-degree mark. As the fluid splits and accelerates around the sides of the cylinder (shown by the lighter colors in the velocity contour), a tiny new insulating boundary layer slowly begins to form. As this blanket grows thicker around the sides, it becomes harder for the heat to escape. This visually explains why the Nusselt number on the graph slowly drops lower and lower as the angle increases around the cylinder. This Packed Bed fluent analysis successfully links the visual wind speed directly to the validated heat transfer numbers.
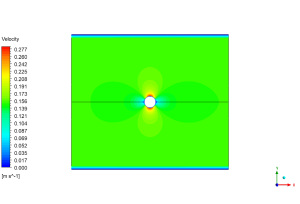
Figure 4: Velocity contour showing the fluid smashing into the 0-degree stagnation point and accelerating around the sides within the porous medium.
Key Takeaways & FAQ
- Q: Why do we use A Porous Media model instead of drawing the packed bed particles?
- A: Drawing thousands of individual particles takes too much computer memory. The porous model in this Cylinder in Packed Bed CFD simulation uses mathematical formulas (like Darcy-Forchheimer) to simulate the flow resistance accurately and quickly.
- Q: What does the validation graph (Figure 3) prove?
- A: It proves that our Cylinder in Packed Bed ANSYS Fluent setup exactly matches real-world physical experiments, meaning our computer model can be trusted to design real industrial machines.
- Q: Why is the Nusselt number highest at 0 degrees?
- A: Because this is the stagnation point. The fluid crashes directly into the cylinder here, preventing an insulating thermal boundary layer from forming, resulting in the maximum rate of heat transfer.






Reviews
There are no reviews yet.