


A Savonius turbine is a vertical machine that captures energy from moving water or wind. It uses simple curved blades. When fluid hits the hollow side of the blade, it pushes the structure forward. This continuous pushing creates a strong rotational force. Engineers call this twisting force torque. The main problem with this simple machine is its low energy efficiency. Much of the moving fluid escapes around the outside of the blades without doing any work. To fix this problem, engineers must find the perfect mathematical blade curve.
Testing thousands of physical metal blades in a laboratory is too expensive and slow. Therefore, engineers solve this problem using ANSYS Fluent software. We simulate the fluid flow and use mathematical optimization algorithms to find the best design automatically. If you want to master fluid energy extraction, exploring our Renewable Energy CFD tutorials is your best next step. Today, you will learn exactly how geometric parameter changes maximize hydraulic torque and improve turbine efficiency.
- Reference [1]: Kerikous, Emeel, and Dominique Thévenin. “Optimal shape of thick blades for a hydraulic Savonius turbine.” Renewable energy134 (2019): 629-638.
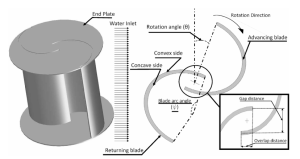
Figure 1: The standard geometrical features defining the advancing blade, returning blade, and overlap distance of the turbine. [1]
Simulation Process: Optimal Performance Data
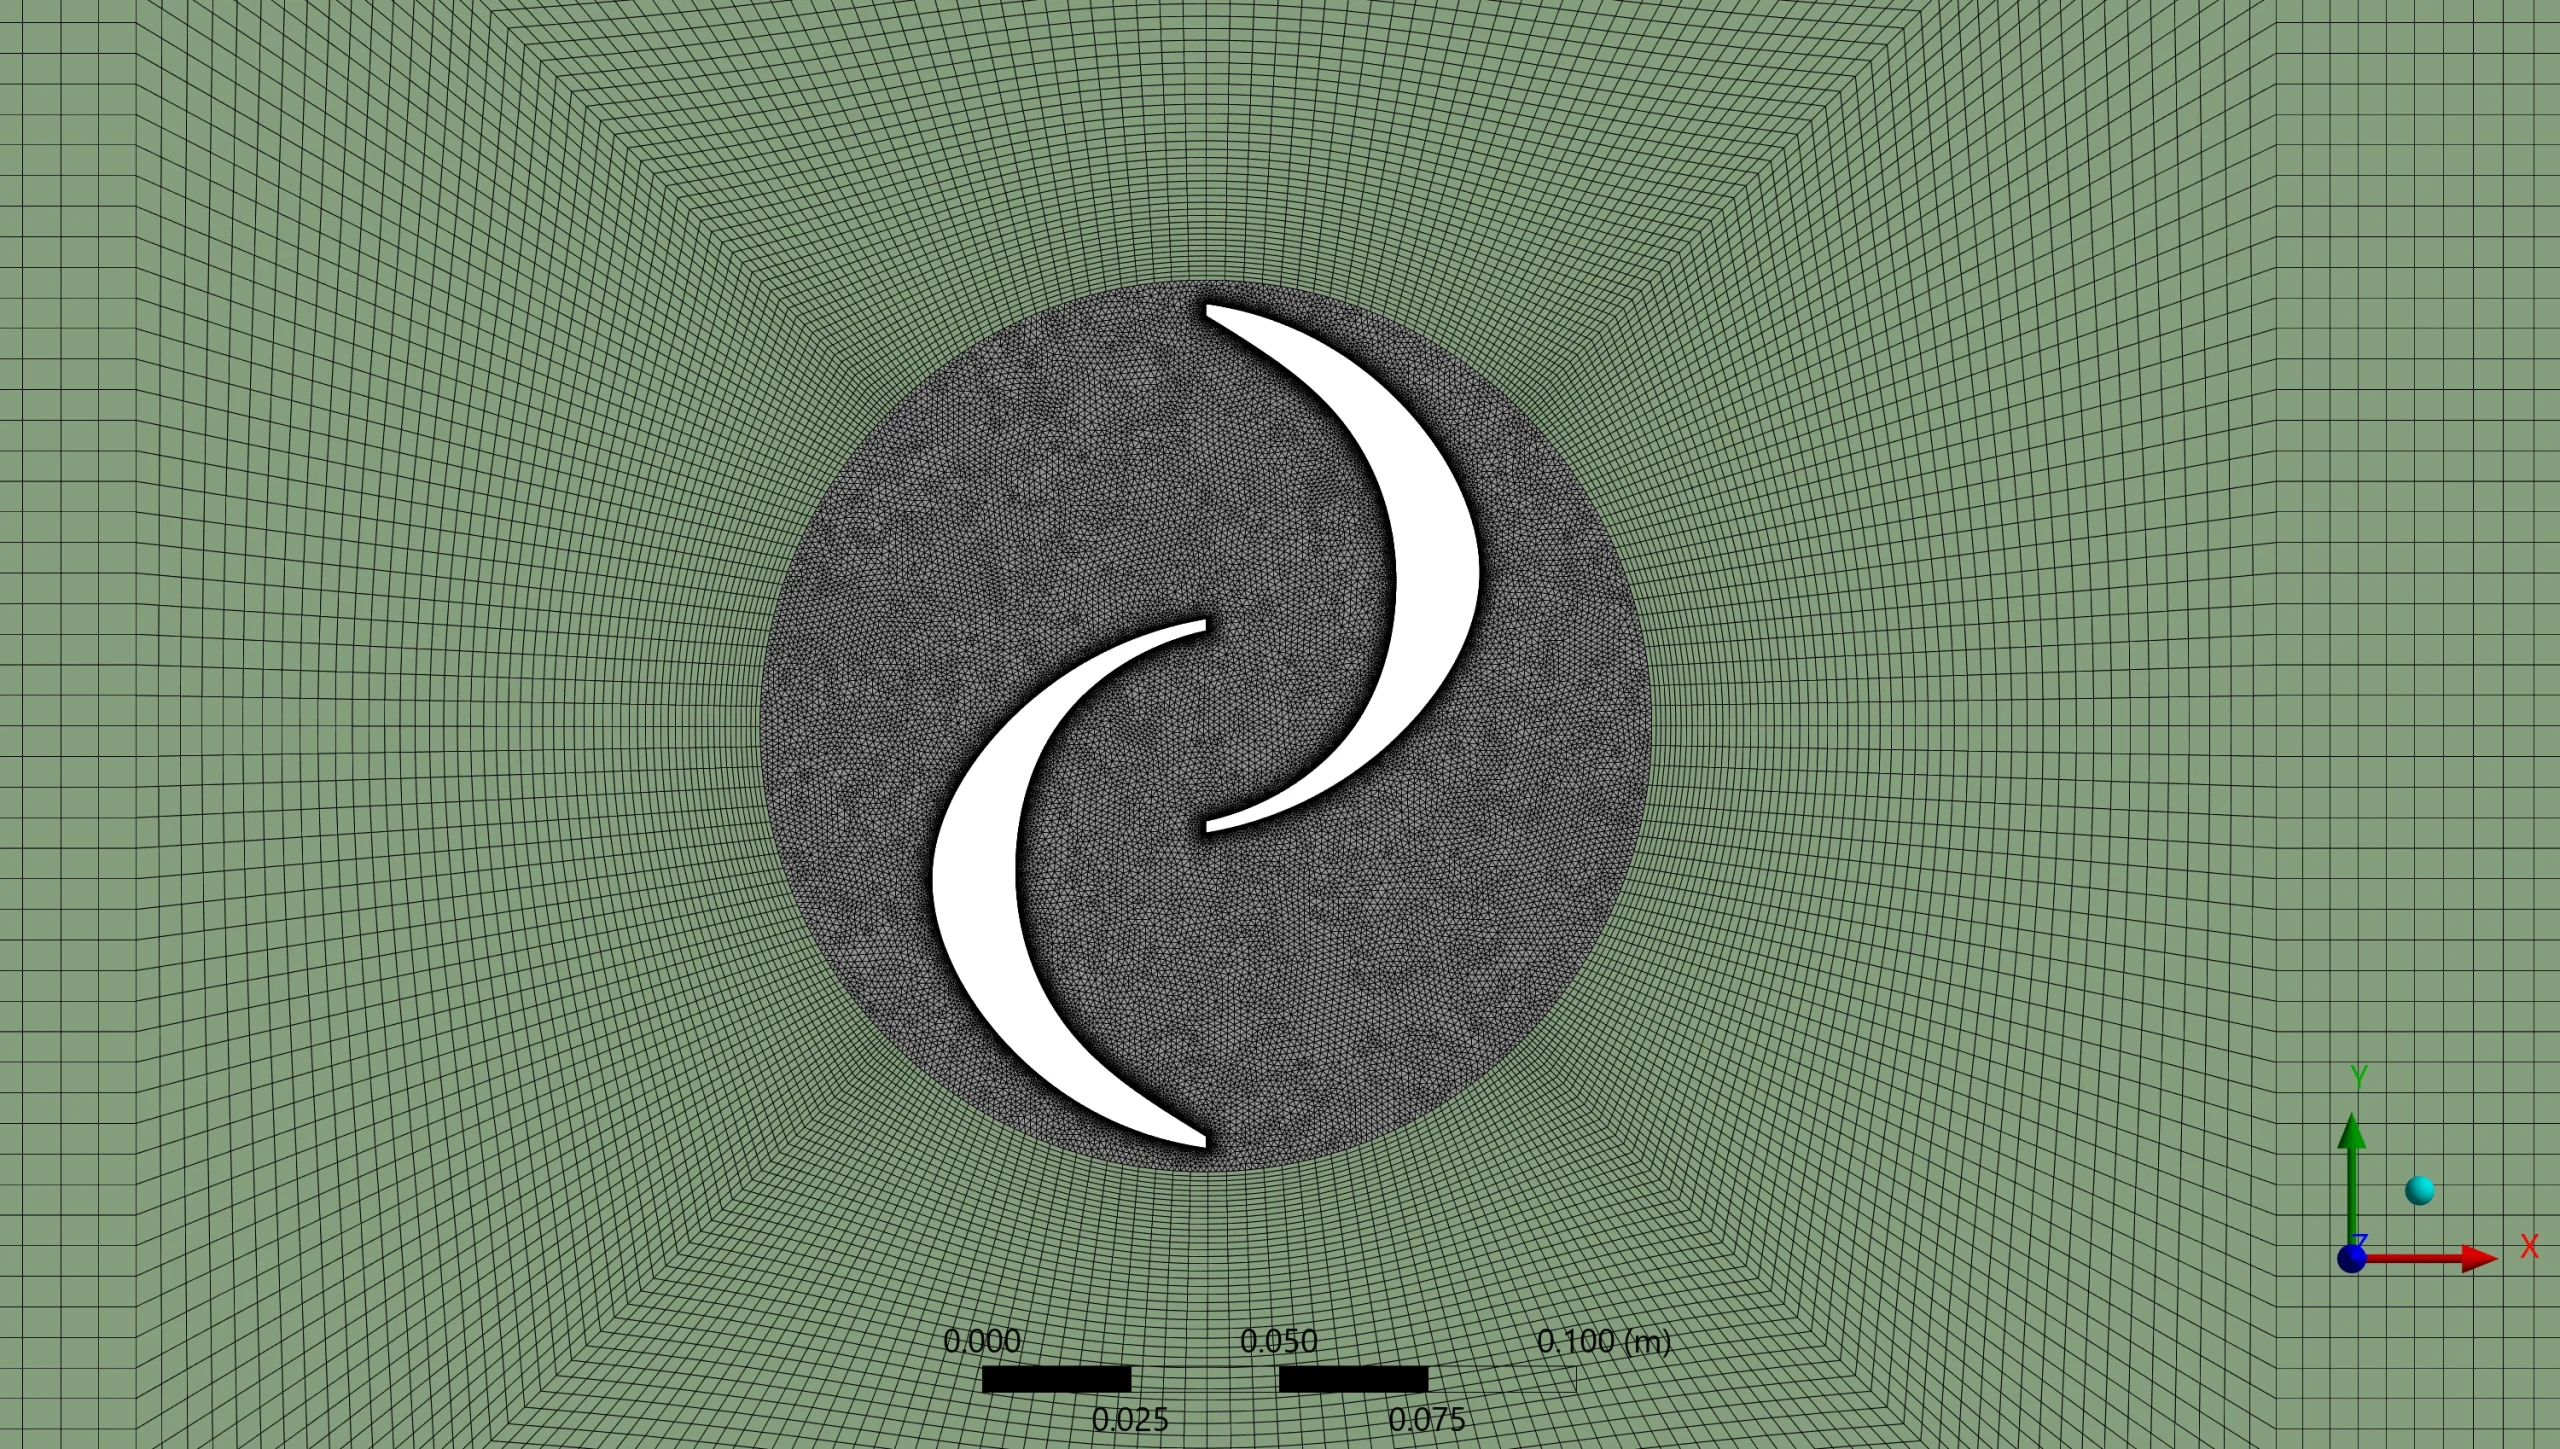
The hydraulic Savonius turbine CFD simulation was built as a 2D domain in ANSYS Fluent divided into two zones: a rotating inner domain around the Savonius rotor and a large fixed outer domain. A sliding mesh technique was applied to model the rotor rotation at 65 RPM, allowing the two mesh zones to slide relative to each other at each time step. The hybrid grid contains roughly 154,587 cells with an unstructured triangular mesh in the rotating zone near the blade surfaces and a structured quadrilateral mesh in the fixed outer domain, as shown in the figure.
The blade geometry was parameterized using 10 geometric input variables controlling the concave and convex blade profile positions via spline points, with constraints applied to prevent blade collision, wall overlap, and shape distortion during optimization. The ANSYS Workbench optimization framework used DOE with CCD algorithm to generate 150 design points, followed by RSM with Genetic Aggregation to build the response surface, and finally the Screening algorithm to identify the best candidates with generated torque set as the single maximization objective.
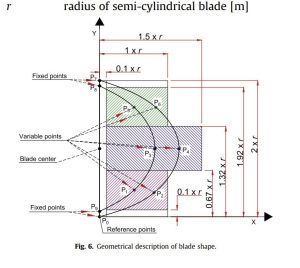
Figure 2: The geometrical description using 10 strict variable points to define the precise curvature of the blade profile. [1]
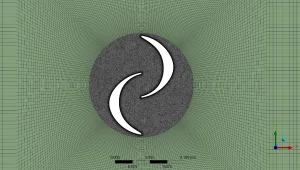
Figure 3: The generated computational grid utilizing high mesh density to capture boundary layer friction around the solid rotor.
Post-processing: Analysis of Optimization and Physics
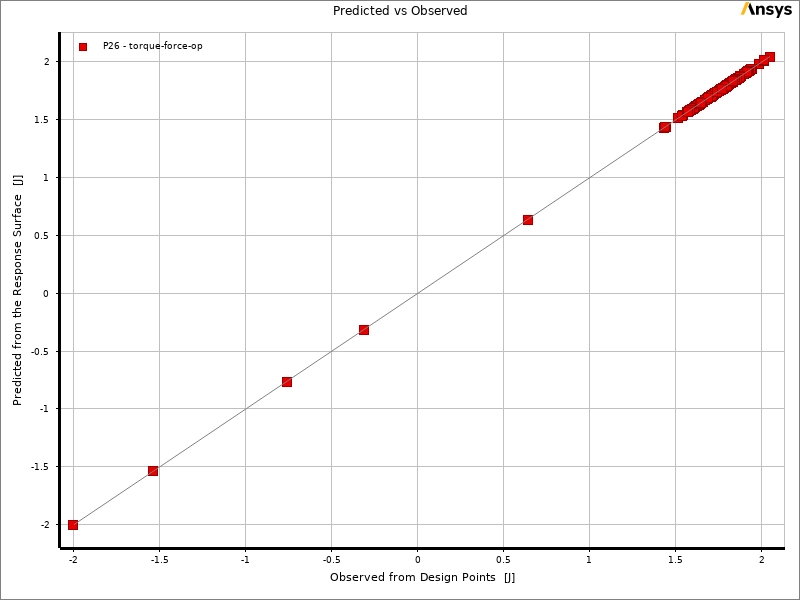
We must analyze the mathematical optimization data and the final fluid physics carefully to understand why this specific shape performs best. The predicted versus observed chart proves the mathematical accuracy of this specific model. The simulated torque data points stretch across a range from exactly -2.0 J to +2.1 J. Every single point sits perfectly on the diagonal reference line. This exact alignment proves the software predicts the generated torque flawlessly, allowing the optimizer to trust the mathematical model without running a full flow simulation for every microscopic shape change. We now examine exactly how the specific geometric points change the turbine power output.

Figure 4: The predicted versus observed chart proving the mathematical surrogate model accurately predicts torque up to +2.1 J.
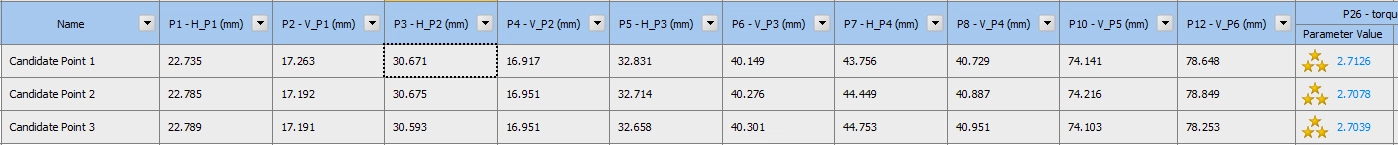
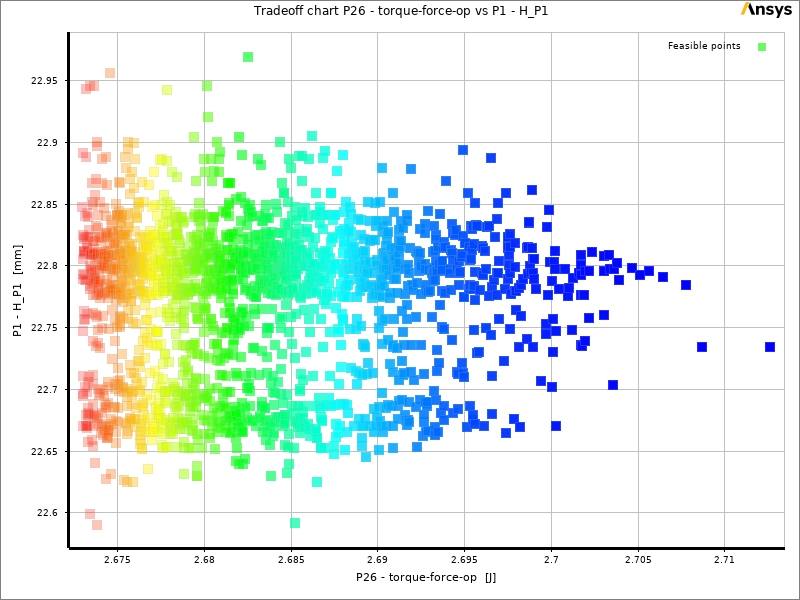
The tradeoff chart maps all the feasible design points against the specific geometric input parameters. As the algorithm shifts the physical design points, the generated torque increases significantly. The data points converge tightly at an absolute maximum torque value of exactly 2.7126 J. The vertical spread of the parameters narrows sharply at this peak, proving the software found a highly specific optimal region. The samples chart reveals the complex interaction paths of all 10 input parameters simultaneously. These lines show clear peak performance zones hitting high torque values between 2.05 J and 2.1 J. Conversely, poor parameter combinations drop into deep valleys, producing a weak torque of only 1.3 J to 1.5 J. This massive difference proves that even small geometric shape changes alter the hydraulic efficiency drastically.
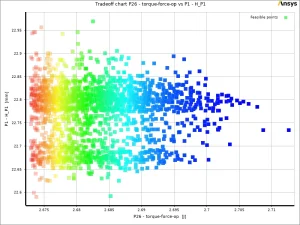
Figure 5: The tradeoff chart proving the algorithm narrows the geometric parameters to converge at a peak torque of exactly 2.7126 J.
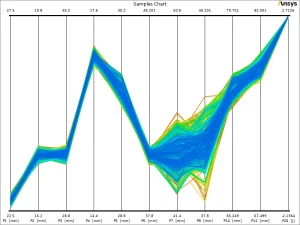
Figure 6: The samples chart mapping all 150 design points to reveal peak performance zones and weak torque valleys.
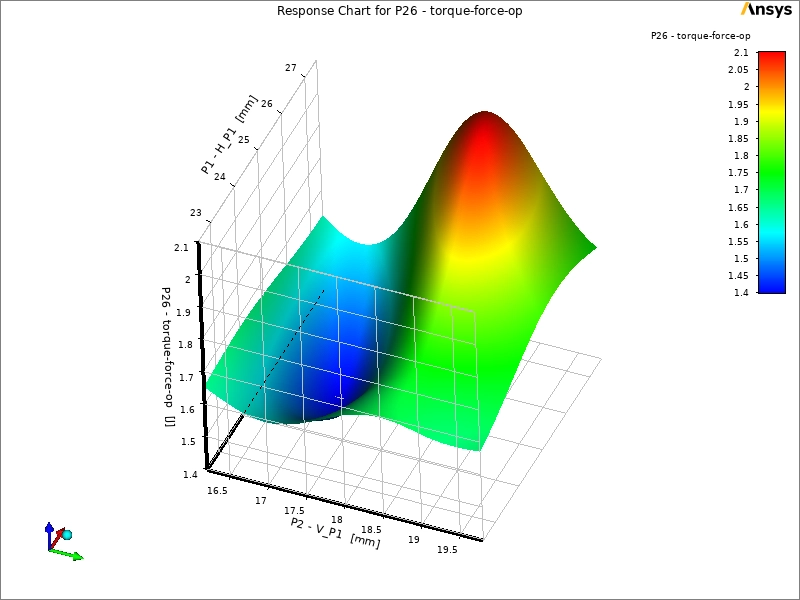
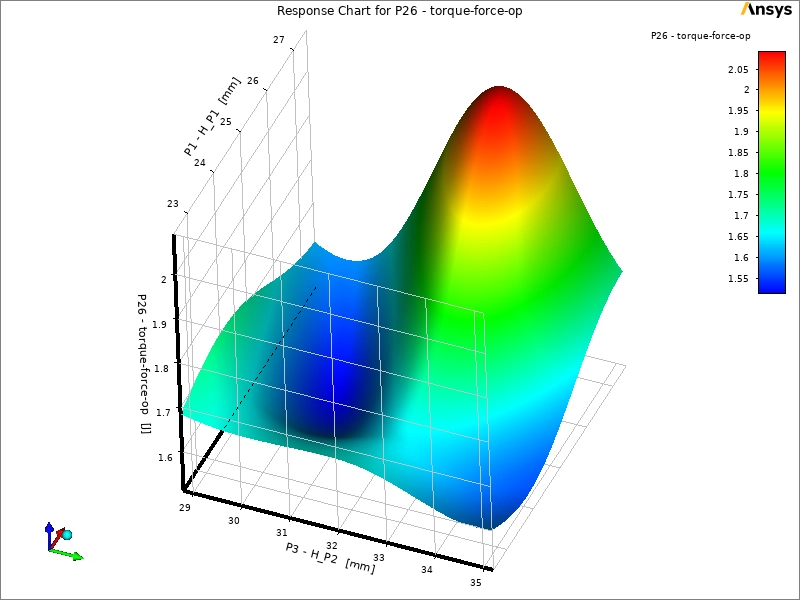
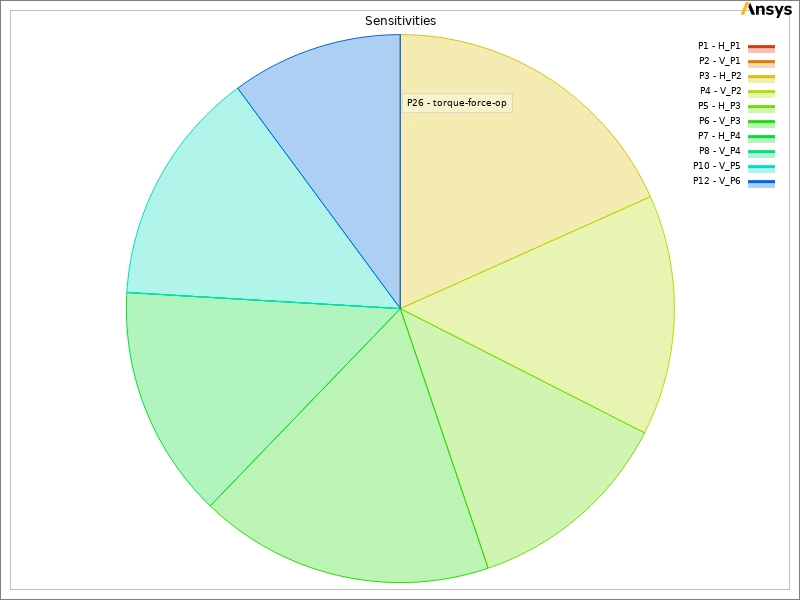
To isolate the most important shape changes, we evaluate the response surfaces and the parameter sensitivity. The three-dimensional response surface plots confirm that certain parameter combinations produce smooth, well-defined single-peak shapes. This is a critical mathematical achievement. It means there is one true optimal design path, preventing the optimization algorithm from getting trapped on a false maximum. The sensitivity pie chart breaks down the exact physical influence of each geometric point on the final torque. The mid-blade parameters dominate this chart completely, contributing roughly equal shares of exactly 12 % to 16 % to the total power output. The endpoint coordinates have very little influence on the performance. Because the optimizer knows exactly which middle points matter most, it focuses its effort there. This focused effort successfully generates the final optimized two-blade rotor profile shown in the geometry plot.
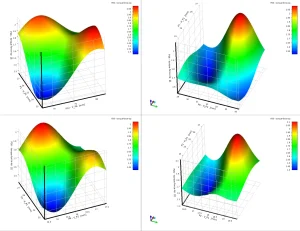
Figure 7: The three-dimensional response surface plots confirming smooth parameter interactions with a single distinct optimal peak.
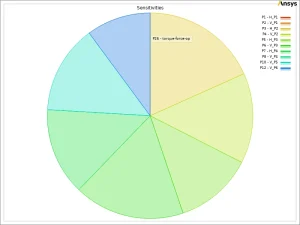
Figure 8: The sensitivity pie chart proving the mid-blade parameters control up to 16 % of the total generated torque individually.
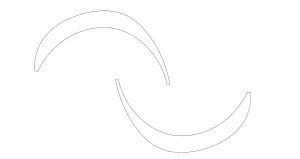
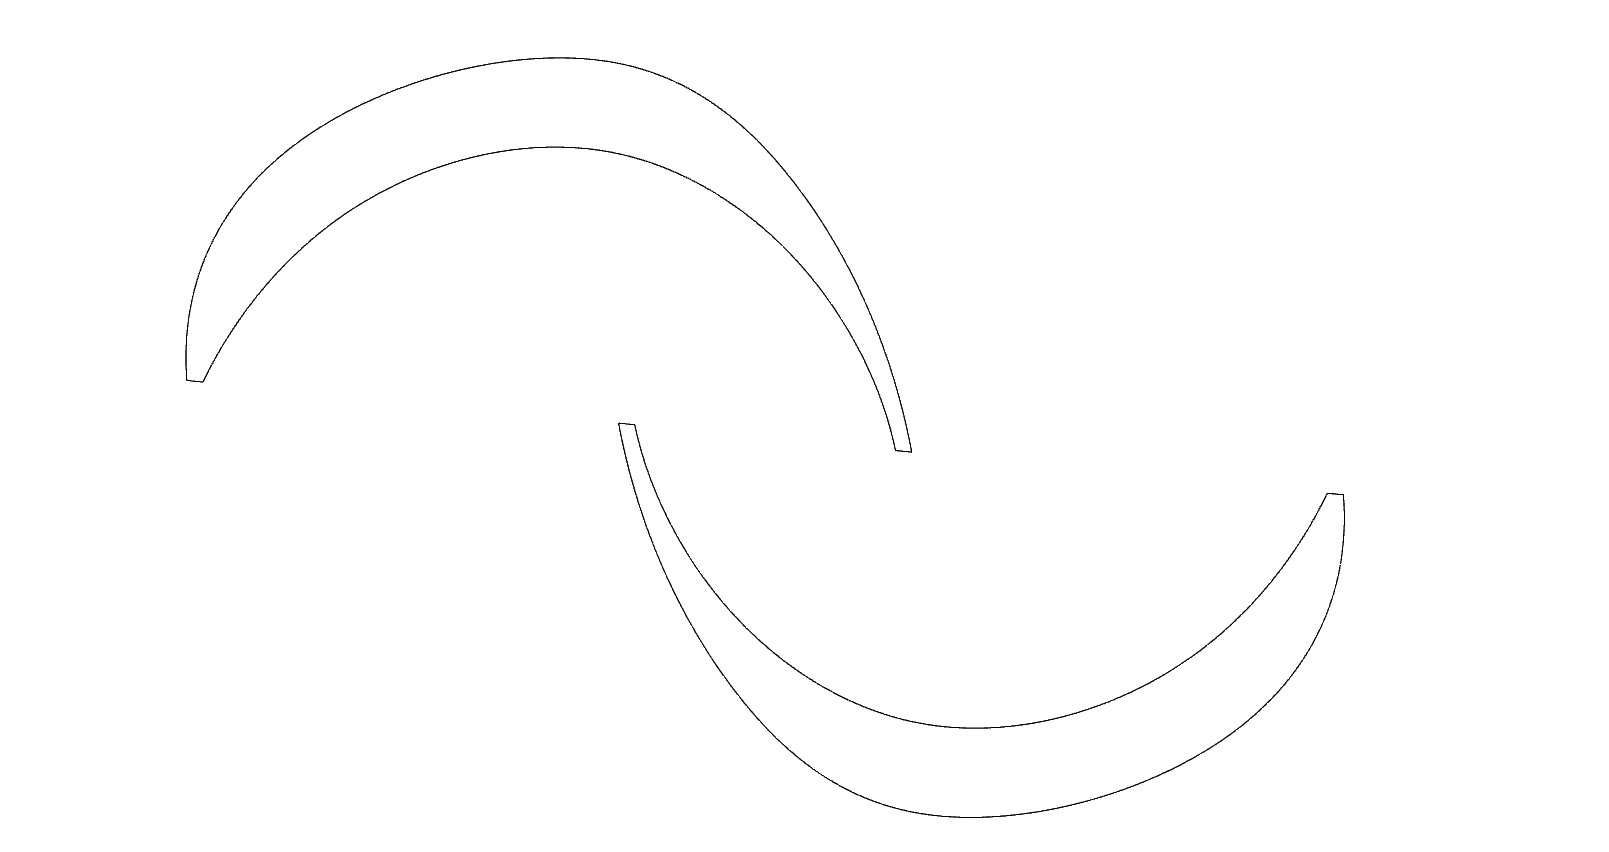
Figure 9: The final optimized two-blade Savonius rotor profile generated from the highest performing geometric data points.
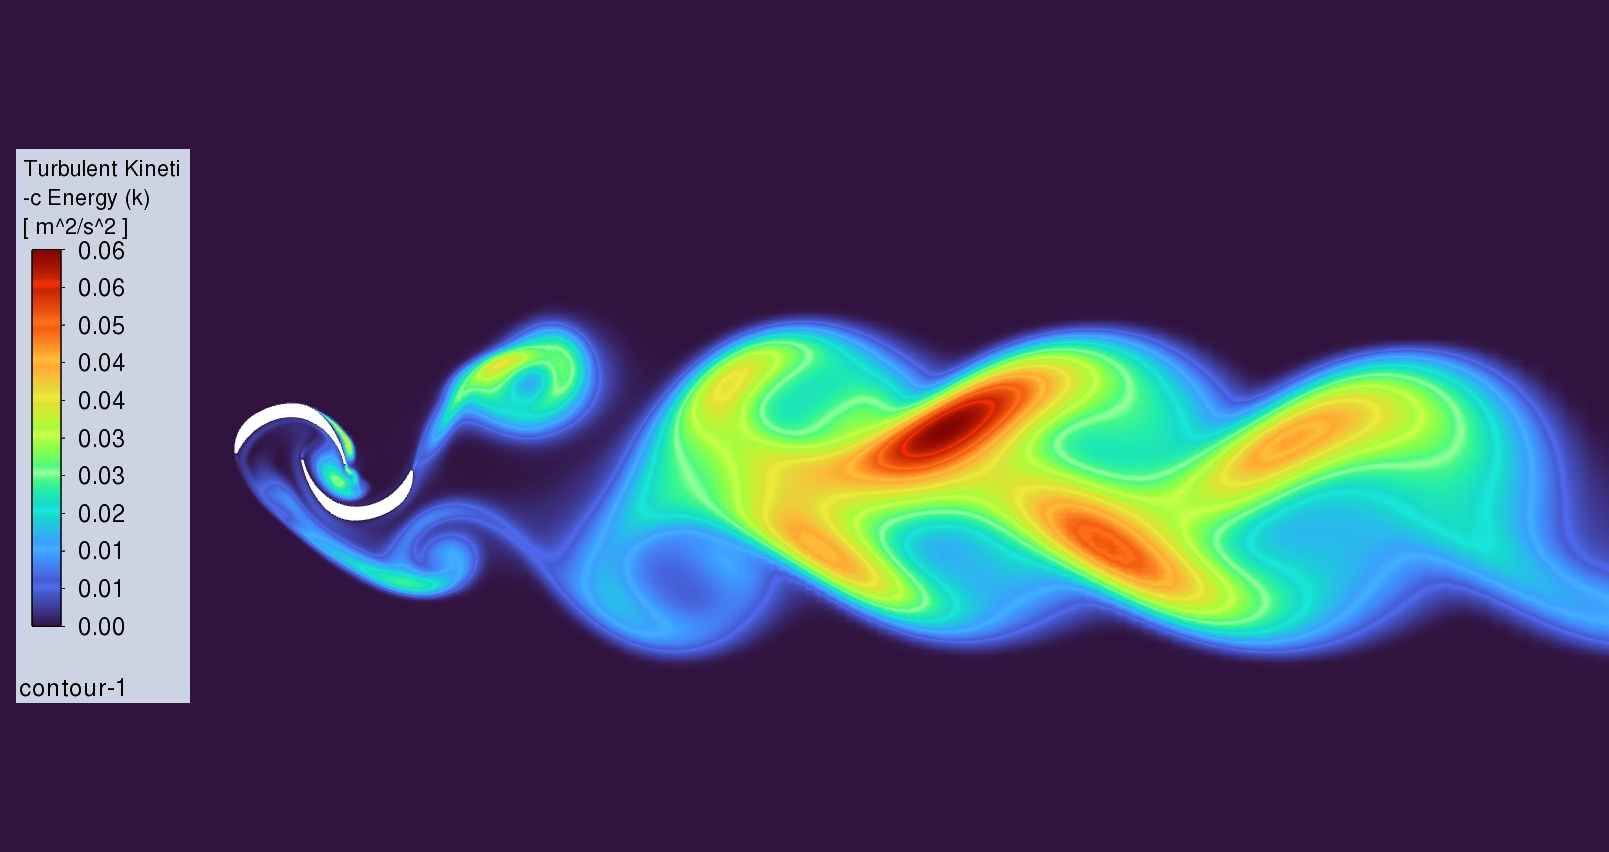
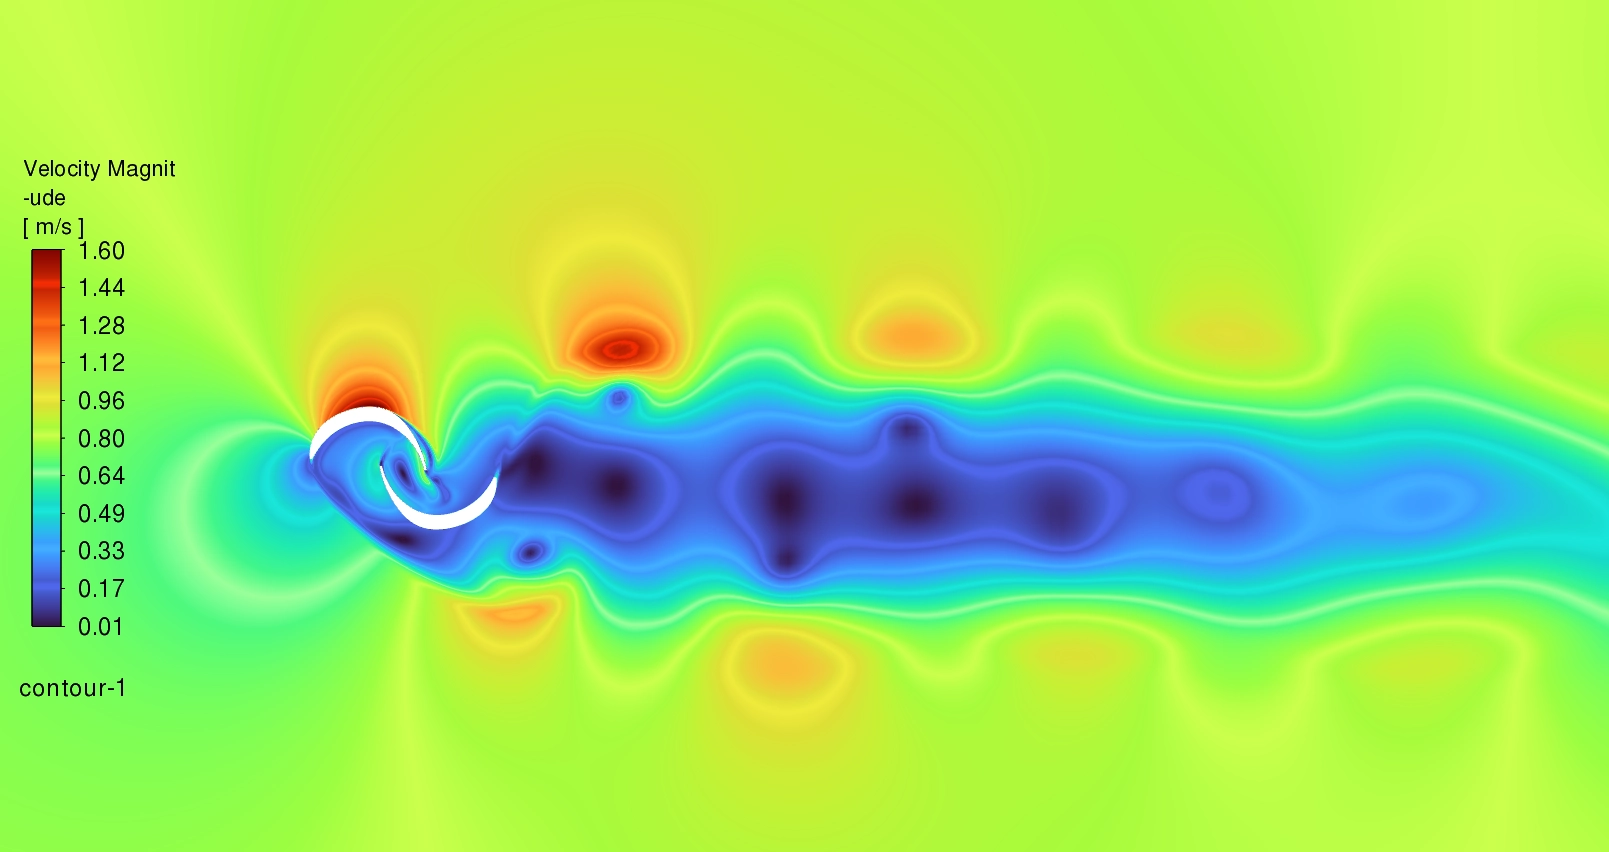
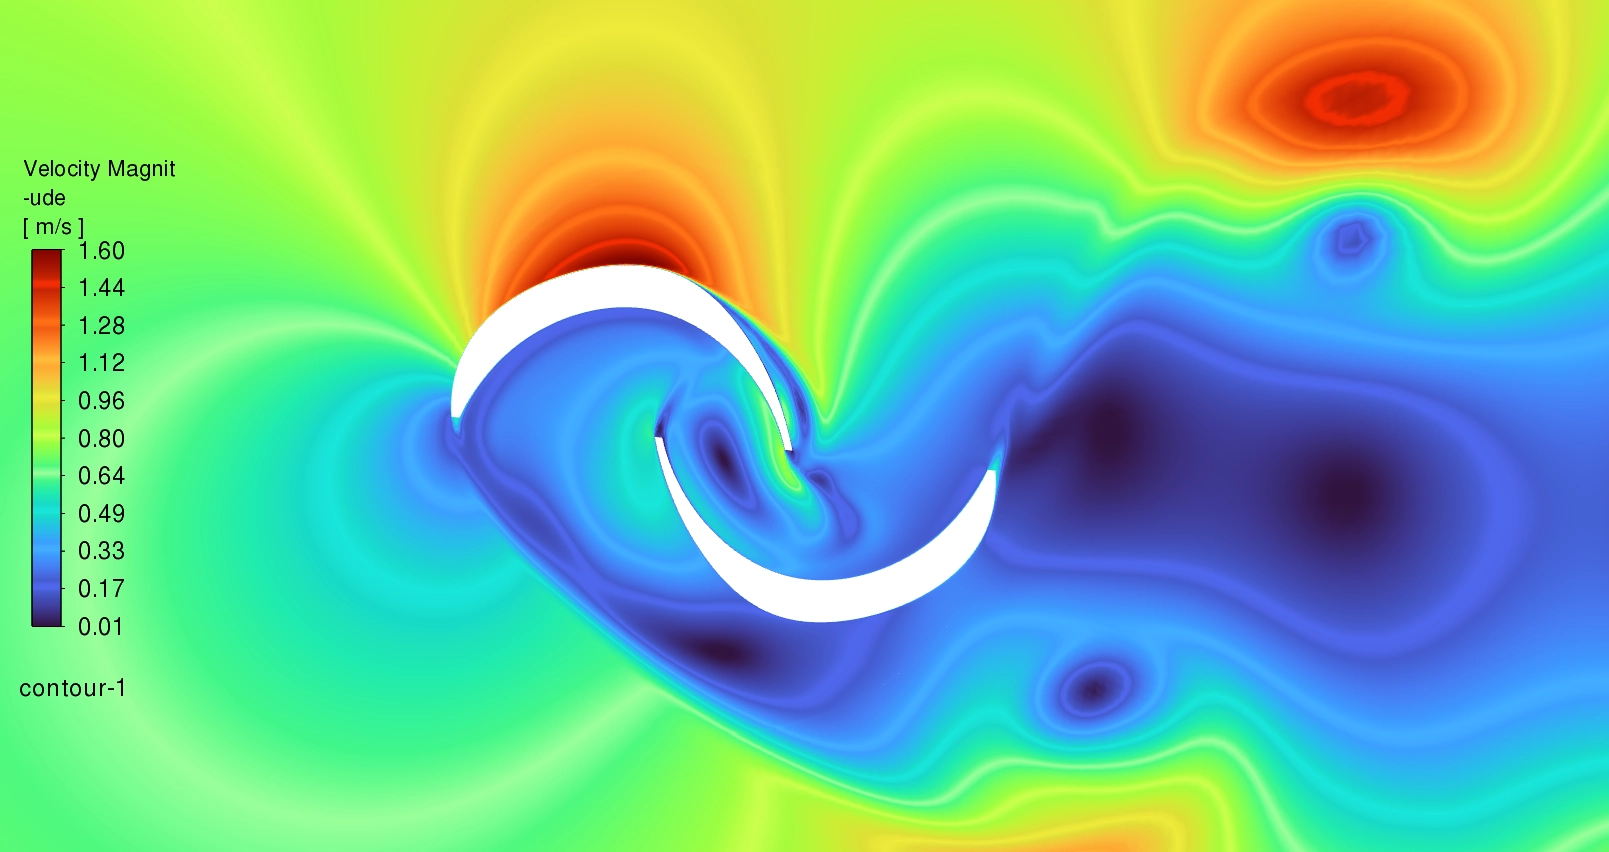
Finally, we must verify the physical fluid mechanics acting upon this new optimal shape. The velocity magnitude contour visualizes the moving water interacting with the spinning rotor. The highest fluid velocity reaches exactly 1.60 m/s around the outer tips of the advancing blade. The fluid pushes smoothly into the concave bowl of the blade. Because the optimized shape catches the water perfectly, the fluid transfers its kinetic energy directly into rotational torque. Behind the spinning turbine, the turbulent kinetic energy contour reveals the exact wake structure. The flow separates from the blades and creates an alternating von Karman vortex street. The maximum turbulent energy reaches exactly 0.06 m2/s2 exclusively in the core of these shedding downstream vortices. However, near the actual solid blade surfaces, the turbulent energy stays extremely low. This low turbulence at the wall proves that the new optimal shape keeps the fluid attached cleanly to the metal. It minimizes energy lost to chaotic drag and maximizes the pure pushing force, resulting in a highly efficient renewable energy system.

Figure 10: The velocity magnitude contour proving the fluid accelerates to exactly 1.60 m/s as it drives the advancing blade.
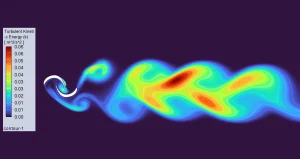
Figure 11: The turbulent kinetic energy contour revealing vortex shedding while proving turbulence remains near zero along the blade walls.
Frequently Asked Questions (FAQ)
- How does a Savonius turbine extract energy?
- It operates strictly on aerodynamic or hydraulic drag. As the moving fluid strikes the hollow side of the curved blade, the fluid pushes it physically. This pushing force turns the central shaft, converting the straight fluid motion into rotational mechanical power.
- Why does the shape of the blade matter so much?
- If the curve is too shallow, it cannot catch enough water. If the curve is too deep, the water gets trapped inside the bowl and resists the spinning motion. The optimization algorithm finds the exact mathematical curve that catches the maximum pushing force while letting the used water exit smoothly.
- What does the response surface model do?
- Running a full fluid simulation for thousands of different blade shapes would take months. The response surface model uses the first 150 simulations to build an advanced mathematical equation. The software uses this equation to instantly predict how any new shape will perform, finding the absolute best design in minutes instead of months.


Reviews
There are no reviews yet.