

If you want to see if a Computational Fluid Dynamics (CFD) calculation of the lid-driven cavity flow matches reality, this report has it. The lid-driven cavity problem is an iconic instance of a benchmark case in fluid dynamics. It has simple geometry and boundary conditions, but the flow becomes quite complicated, especially when the Reynolds number is high. It has a square hole filled with a fluid that can’t be squished. The lid on top of the box moves at a constant pace, but the other three walls stay still. This makes a flow that goes circularly inside the hole. The flow patterns get more complicated as the Reynolds number goes up. This validation study is the same as the work that Ghia, and Shin (1982) wrote about in a published paper called “High-Re Solutions for Incompressible Flow Using the Navier-Stokes Equations and a Multigrid Method” focusing on verifying whether the simulation results match the velocity profiles and streamline/vorticity contours that were found in the paper. The goal of the present research is to show that current CFD tools can reproduce these benchmark results, thanks to ANSYS Fluent.
- Reference [1]: Ghia, U. K. N. G., Kirti N. Ghia, and C. T. Shin. “High-Re solutions for incompressible flow using the Navier-Stokes equations and a multigrid method.” Journal of computational physics3 (1982): 387-411.
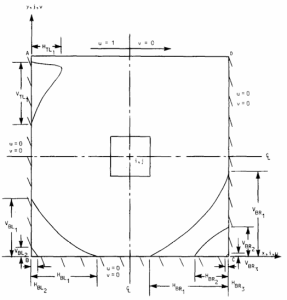
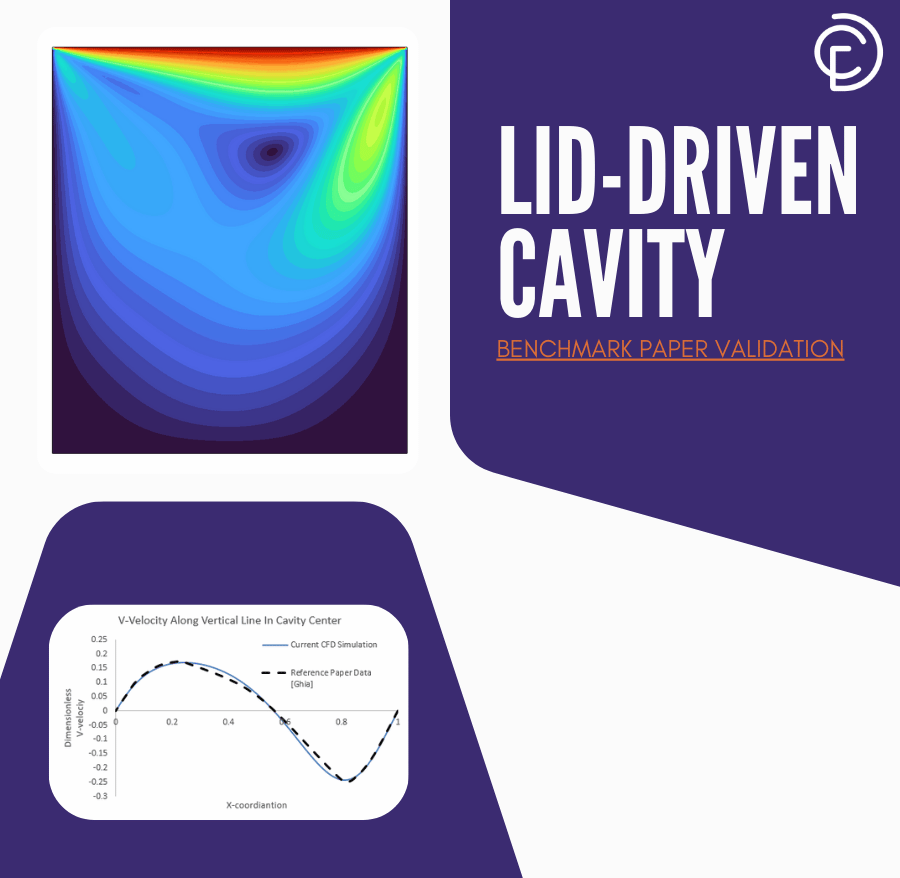
Figure 1: Cavity flow configuration and boundary conditions
Results & Analysis
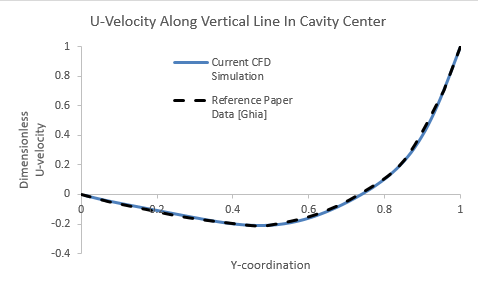
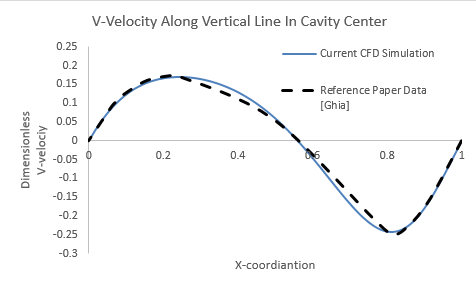
The simulation was performed at a Reynolds number of 100, employing air as the working fluid in a 1m x 1m square cavity. To maintain dimensional consistency with the benchmark data, the problem was formulated in a dimensionless form. This required choosing suitable parameters for velocity, length, and viscosity to attain the desired Reynolds number. The boundary conditions were established based on the lid-driven cavity problem: the upper wall (lid) moved with a constant velocity, while the other walls remained stable (no-slip condition). The flow regime was classified as laminar and incompressible, in accordance with the conditions outlined in the Ghia et al. study for Re=100. An appropriate mesh was created to accurately capture the flow characteristics. The simulation outcomes were subsequently contrasted with the data presented in Tables I and II of the Ghia et al. publication. The tables display the dimensionless U-velocity along the vertical centerline and the V-velocity along the horizontal centerline of the cavity.
The graphs contrasting the resulting velocity profiles with the reference data provide a strong agreement, so validating the precision of the present CFD simulation. The strong correlation between the simulated findings and the benchmark data for both U and V velocity components verifies that the simulation accurately represents the flow dynamics within the cavity at Re=100. This agreement indicates that the selected numerical methods and mesh resolution are sufficient for accurately capturing the flow characteristics at this Reynolds number.
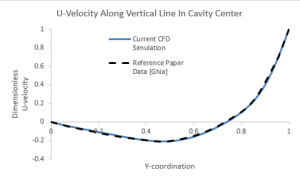

Figure 2: U-velocity & V-velocity along central lines in Lid-driven cavity
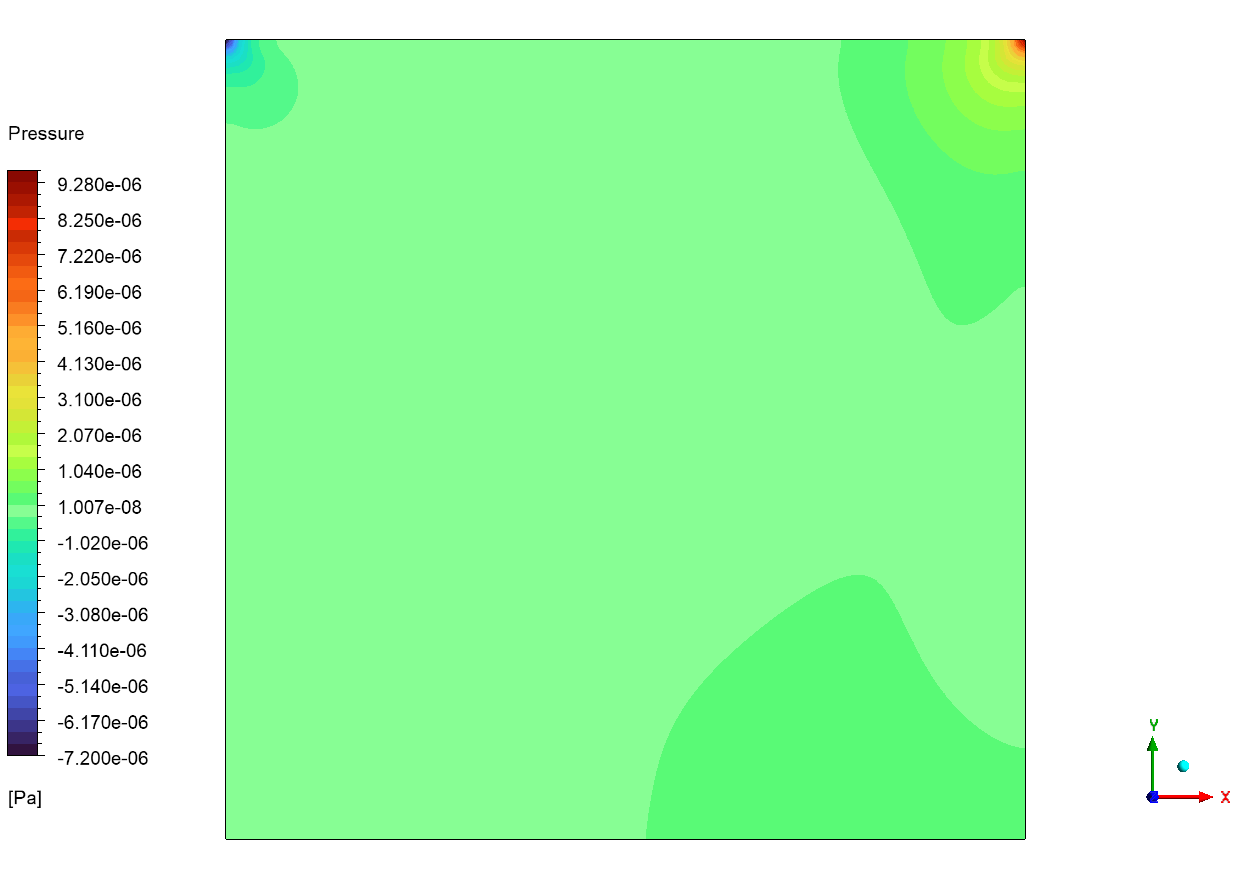
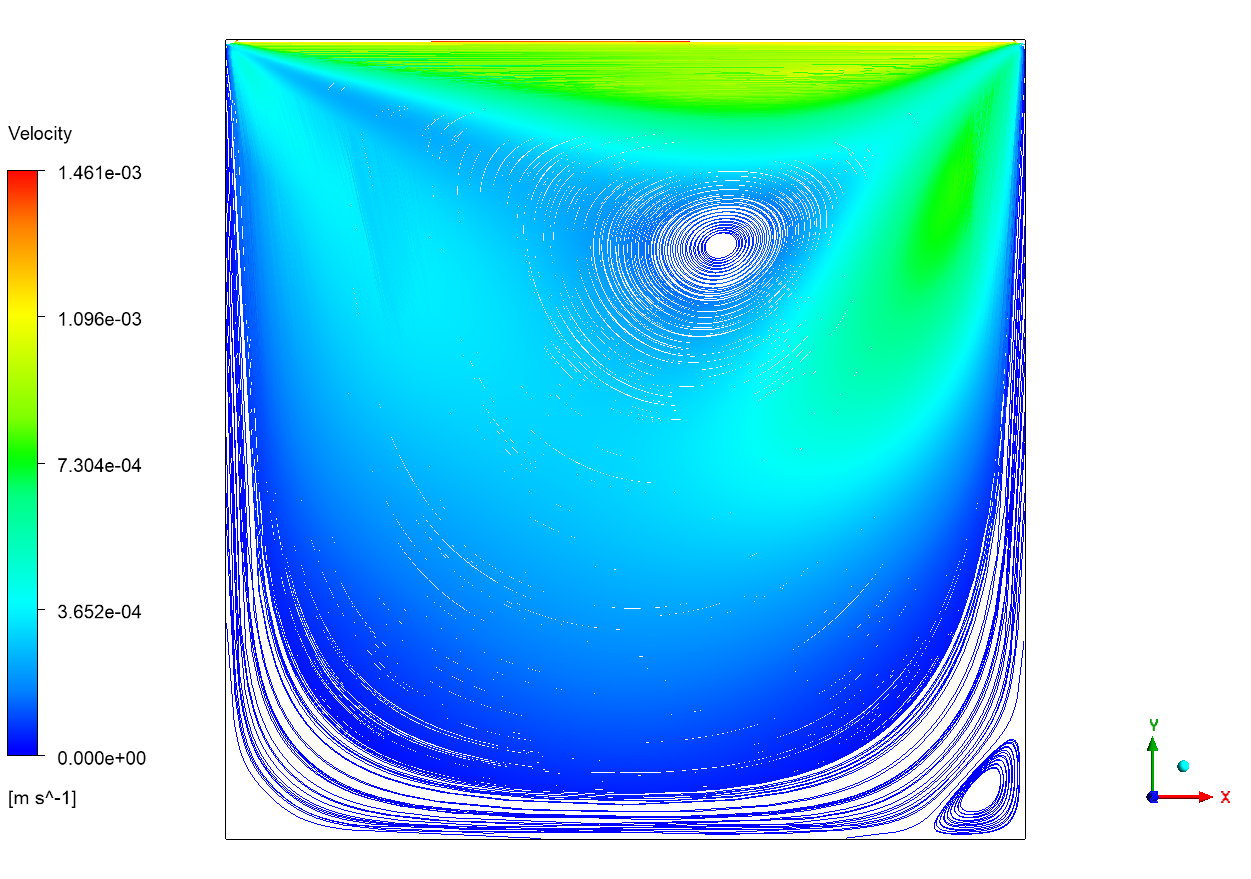
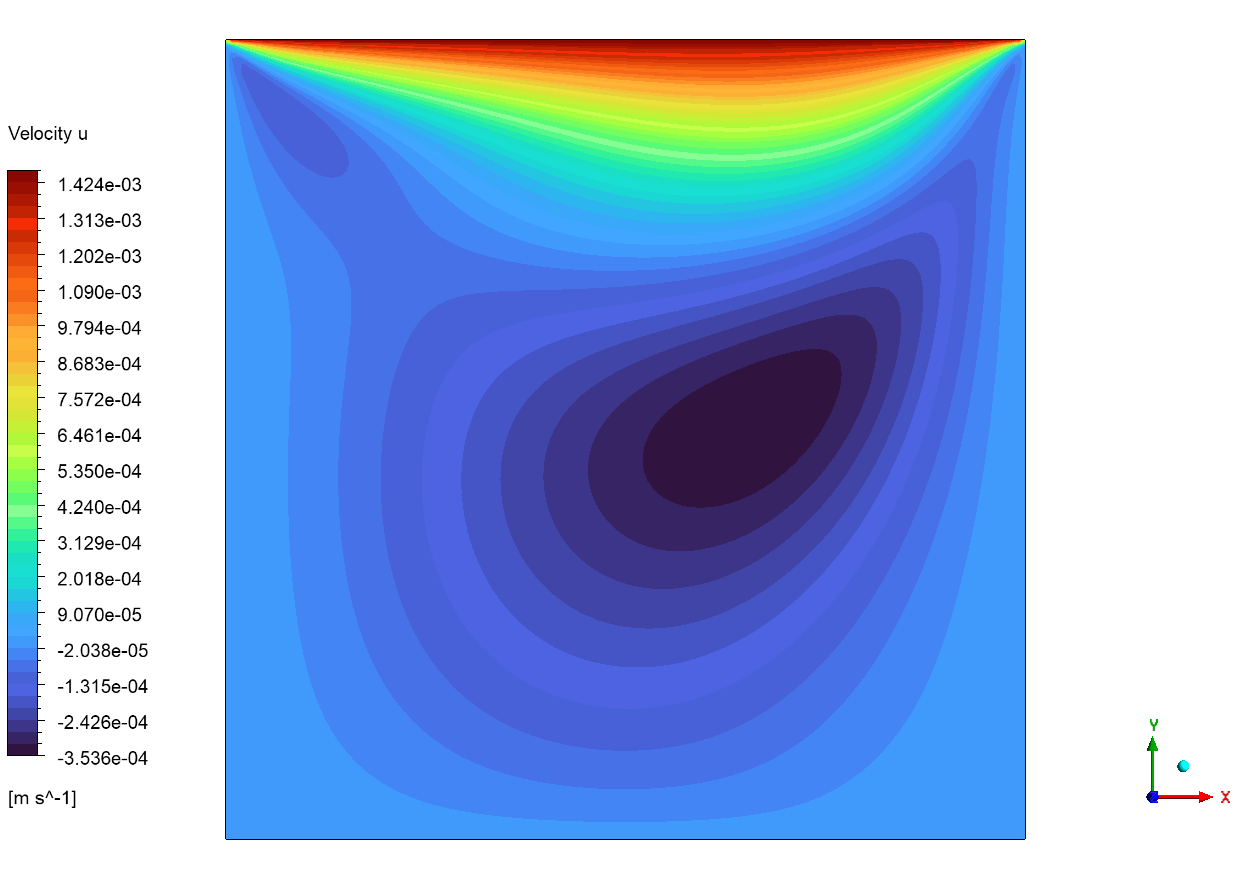
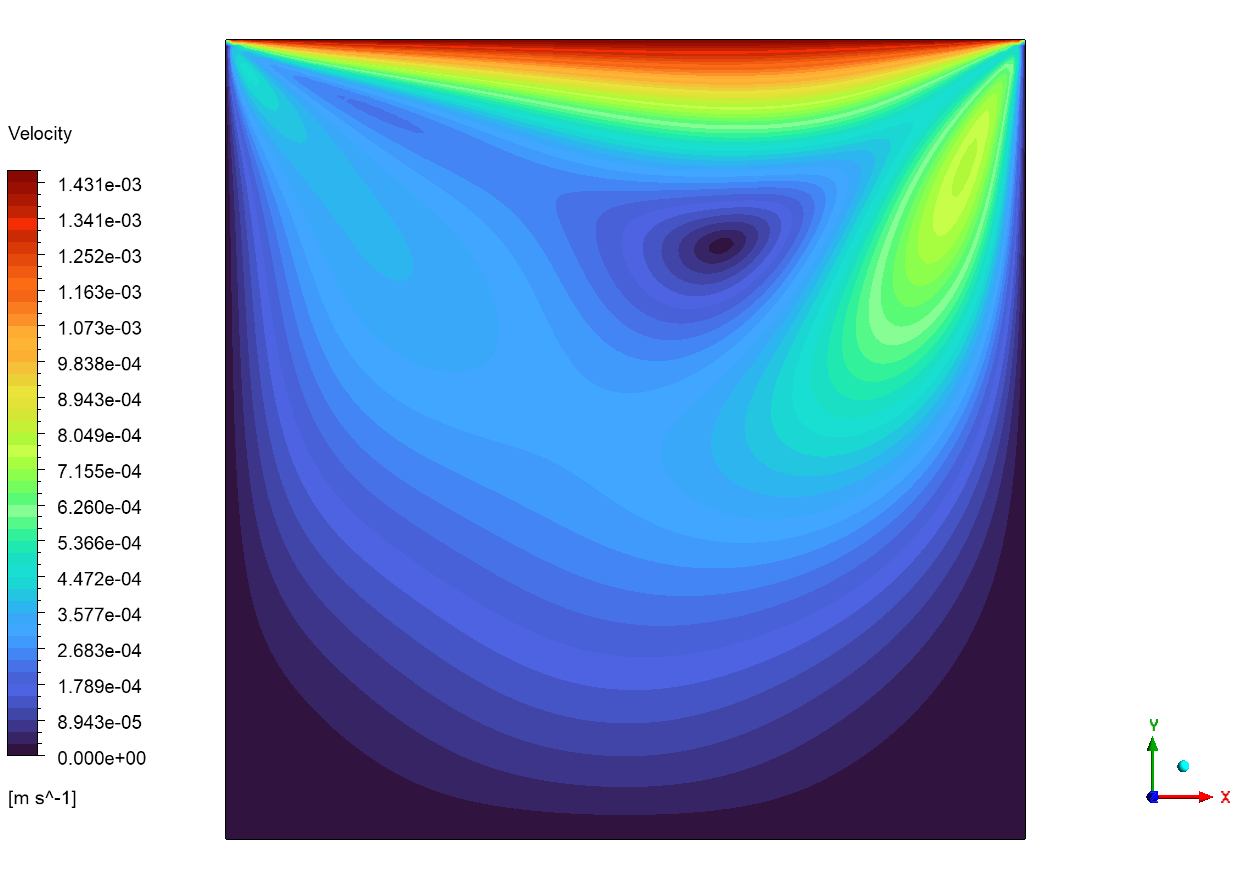
The velocity contours (Figures 3, 4, and 5) visually depict the flow field within the cavity. Figure 3, showing the velocity magnitude contour, illustrates the maximum velocities adjacent to the sliding lid and the rise of a primary vortex, somewhat moved from the center, with falling velocities towards the bottom. The smooth shifts in the contour lines signify a well-defined flow field. Figures 4 and 5 illustrate the U-velocity (horizontal) and V-velocity (vertical) components, respectively, providing more insight into the flow patterns. The U-velocity contour displays positive values near the lid, signifying fluid movement towards the lid, and negative values in the lower half, indicating recirculation. The V-velocity contour indicates the vertical fluid flow induced by the vortex, with positive values adjacent to the right wall and negative values near the left, so indicating a symmetrical distribution around the vertical centerline.

Figure 3: Velocity field in Lid-driven cavity CFD simulation
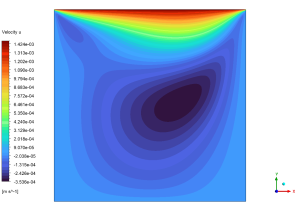
Figure 4: U-velocity in Lid-driven cavity CFD simulation
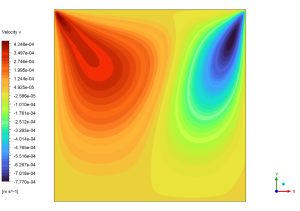
Figure 5: V-velocity in Lid-driven cavity CFD simulation


Reviews
There are no reviews yet.