
A photovoltaic facade is a building wall that makes electricity from the sun. When solar panels replace standard walls, they face a serious physical problem. The sun heats them up. High heat drops their electrical power output. To fix this, engineers design a ventilated gap behind the panels. The air moves through this gap and naturally cools the system.
This study validates a CFD model against experimental data. We base our work on the reference paper: Gonçalves, Juliana E., Twan van Hooff, and Dirk Saelens. “Simulating building integrated photovoltaic facades: Comparison to experimental data and evaluation of modelling complexity.” Applied Energy 281 (2021): 116032. We verify the physics of this ventilated PV facade design to ensure our calculations are reliable for future projects. You can find more studies on clean power in our Renewable Energy tutorials.
- Reference [1]: Gonçalves, Juliana E., Twan van Hooff, and Dirk Saelens. “Simulating building integrated photovoltaic facades: Comparison to experimental data and evaluation of modelling complexity.” Applied Energy281 (2021): 116032.
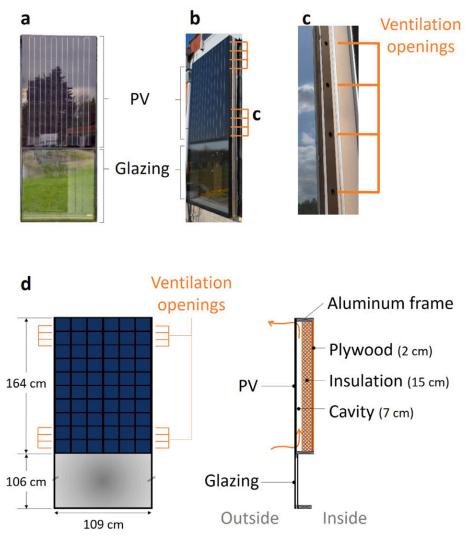
Figure 1: Schematic of the building integrated photovoltaics element, detailing the structural layers including the 15 cm insulation and 7 cm air cavity.
Simulation process: Structured Grid and Solar Radiation
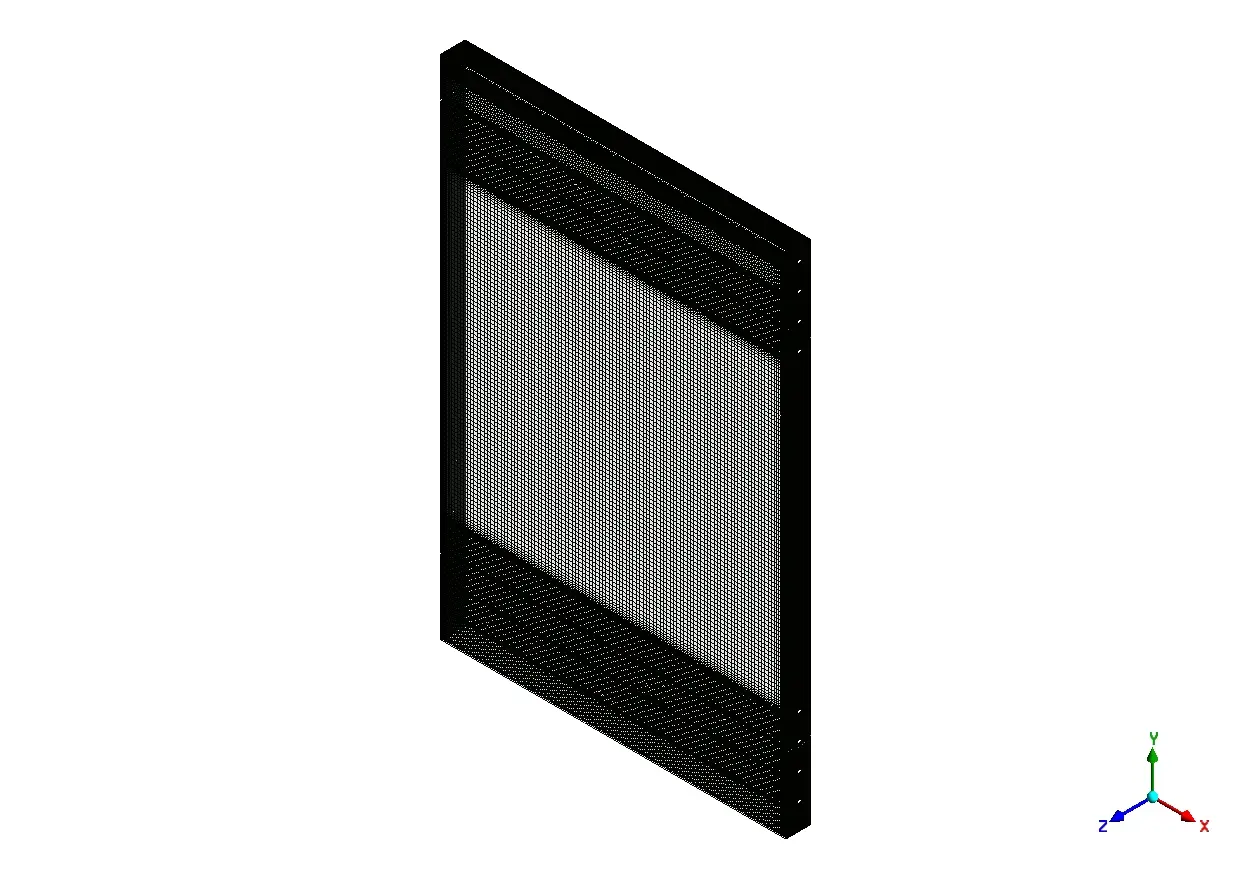
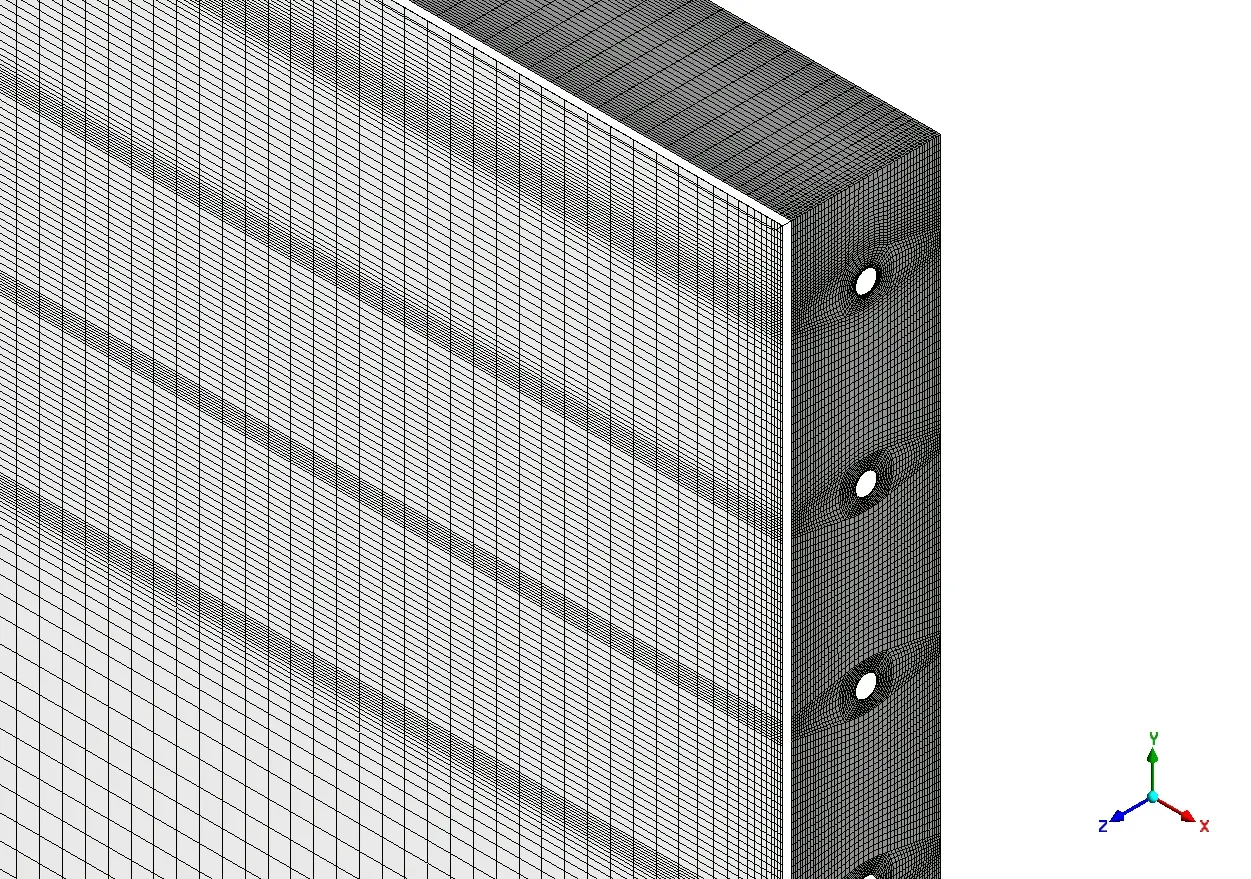
We build a physical model using the structural dimensions from the reference paper. The geometry includes the front panels, a 7 cm air cavity, a 2 cm plywood layer, and 15 cm of solid insulation. The total height of the top panel section is 164 cm. We divide this empty space into a mathematical grid using ANSYS ICEM. We created a highly organized structured mesh. A structured mesh aligns perfectly with flat walls. This straight alignment helps the solver calculate the fluid friction near the solid surfaces without mathematical errors.
To simulate the sun, the setup uses the Discrete Ordinates (DO) radiation model. The sun does not only shine in a straight line. The sky scatters the light in many directions. This specific model calculates both the direct sunlight and the scattered sky radiation hitting the PV facade. This ensures the thermal energy entering the wall matches real weather conditions.
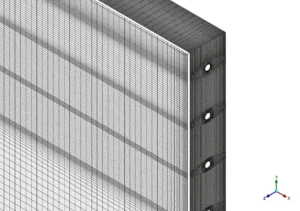
Figure 2: The structured mesh generated by ANSYS ICEM, designed to calculate the air flow safely near the panel boundaries.
Post-processing: Chimney Effect and Validation Data
We compare our calculation numbers directly to the experimental paper in the table below. Our mathematical model assumes the air cavity has perfectly smooth walls. However, the real physical wall has small bumps and dust that block the air slightly. Because of this, our model predicts slightly better cooling and higher power. The difference remains tightly between 5.57 % and 14.18 %. This small margin falls well within safe engineering limits, proving the physics are correct.
Table 1. Comparison of experimental measurements and computed results for the photovoltaic building facades performance.
| Date | Parameter | Our Simulation | Experiment | Difference |
|---|---|---|---|---|
| May 4 | Module Temp (°C) | 58.8 | 63.0 | -4.2 (7.14%) |
| PV Power (W) | 155.8 | 133.7 | +22.1 (14.18%) | |
| May 5 | Module Temp (°C) | 60.6 | 64.0 | -3.4 (5.57%) |
| PV Power (W) | 159.7 | 138.5 | +21.2 (13.28%) | |
| May 9 | Module Temp (°C) | 57.9 | 65.8 | -7.9 (13.66%) |
| PV Power (W) | 151.8 | 131.8 | +20.0 (13.17%) |
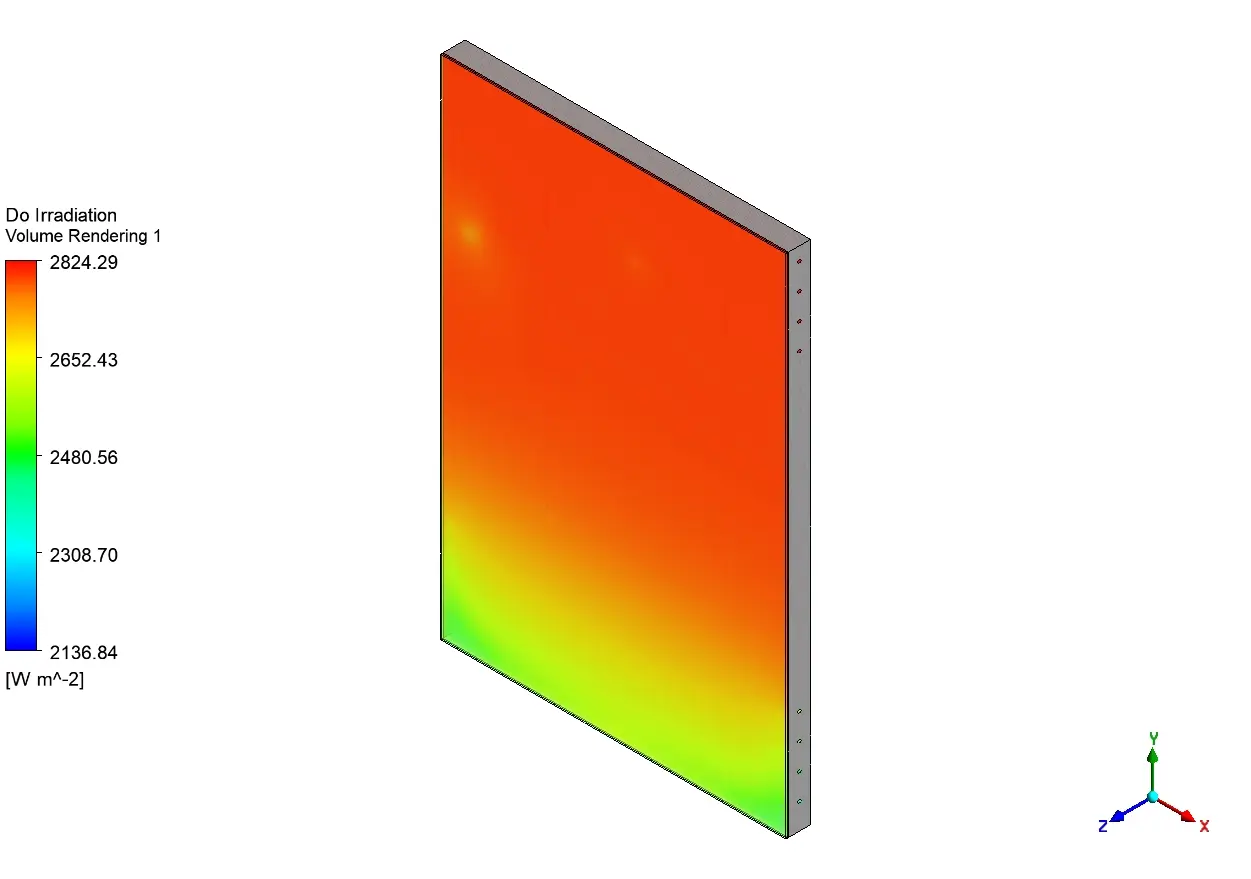
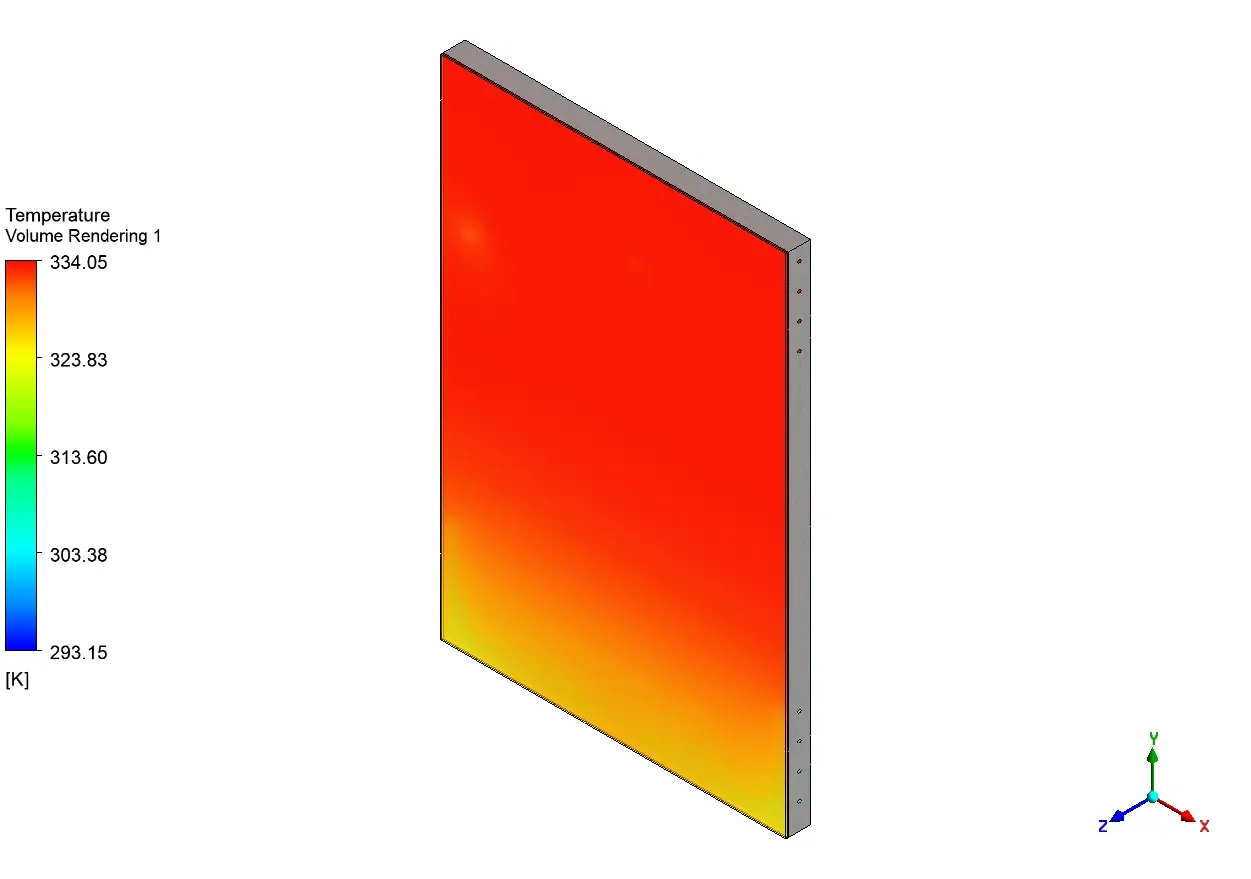
We analyze the heat and the moving air together to understand the full physical process. The sun does not heat the wall equally. The irradiation contour proves the top section receives a heavy solar load of 2824.29 W m^-2. The bottom section only absorbs 2136.84 W m^-2. This uneven distribution matches the real physical angle of the sun in the sky.
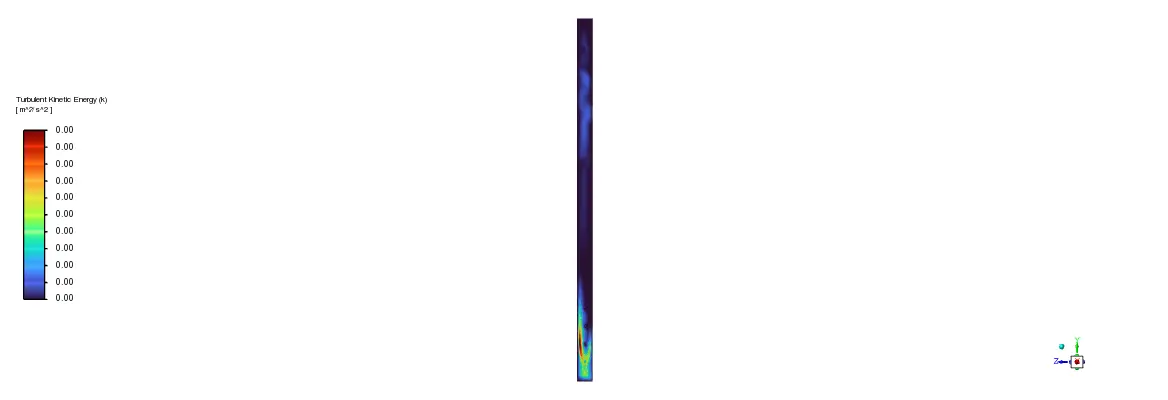
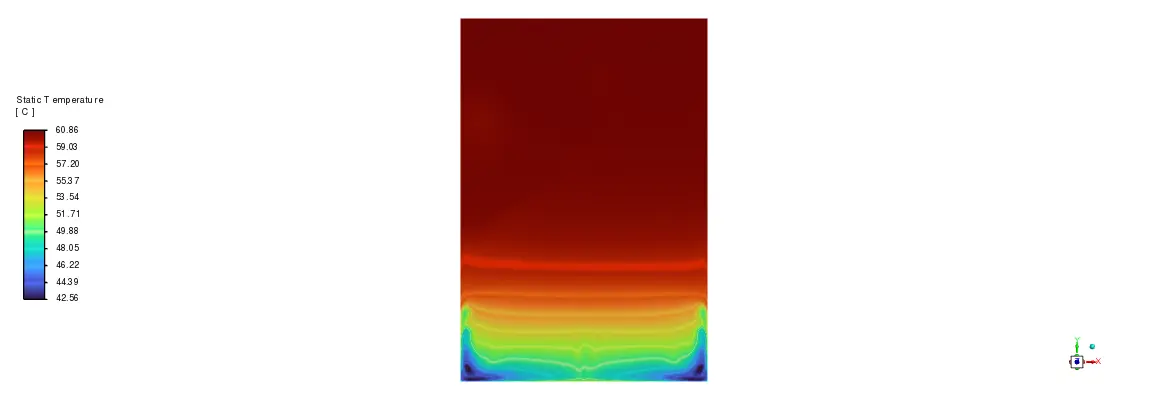
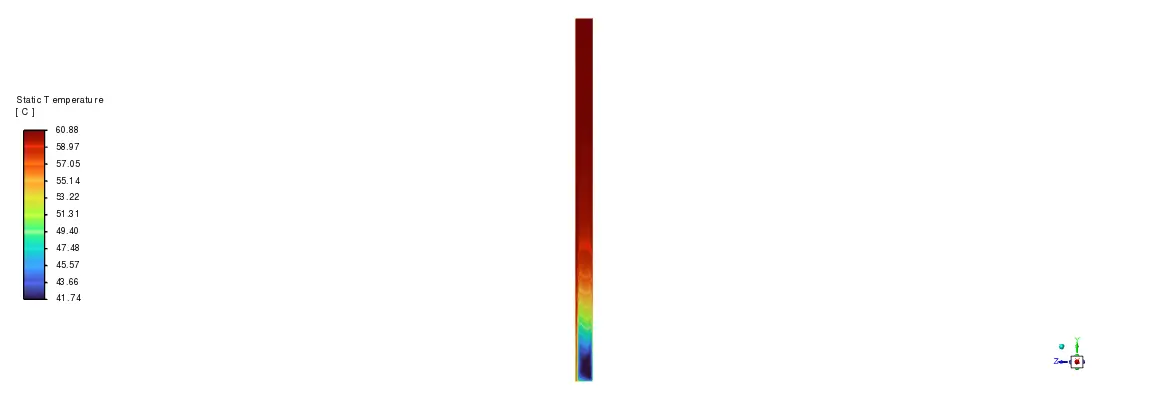
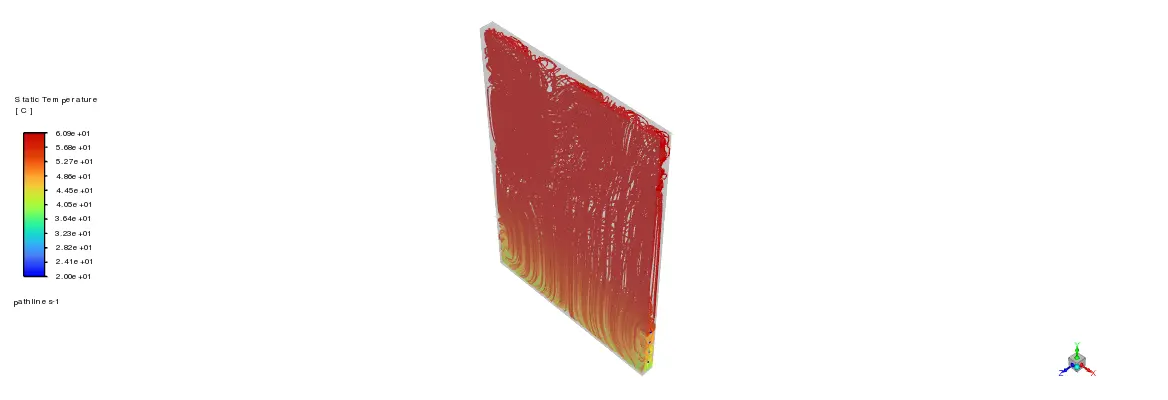
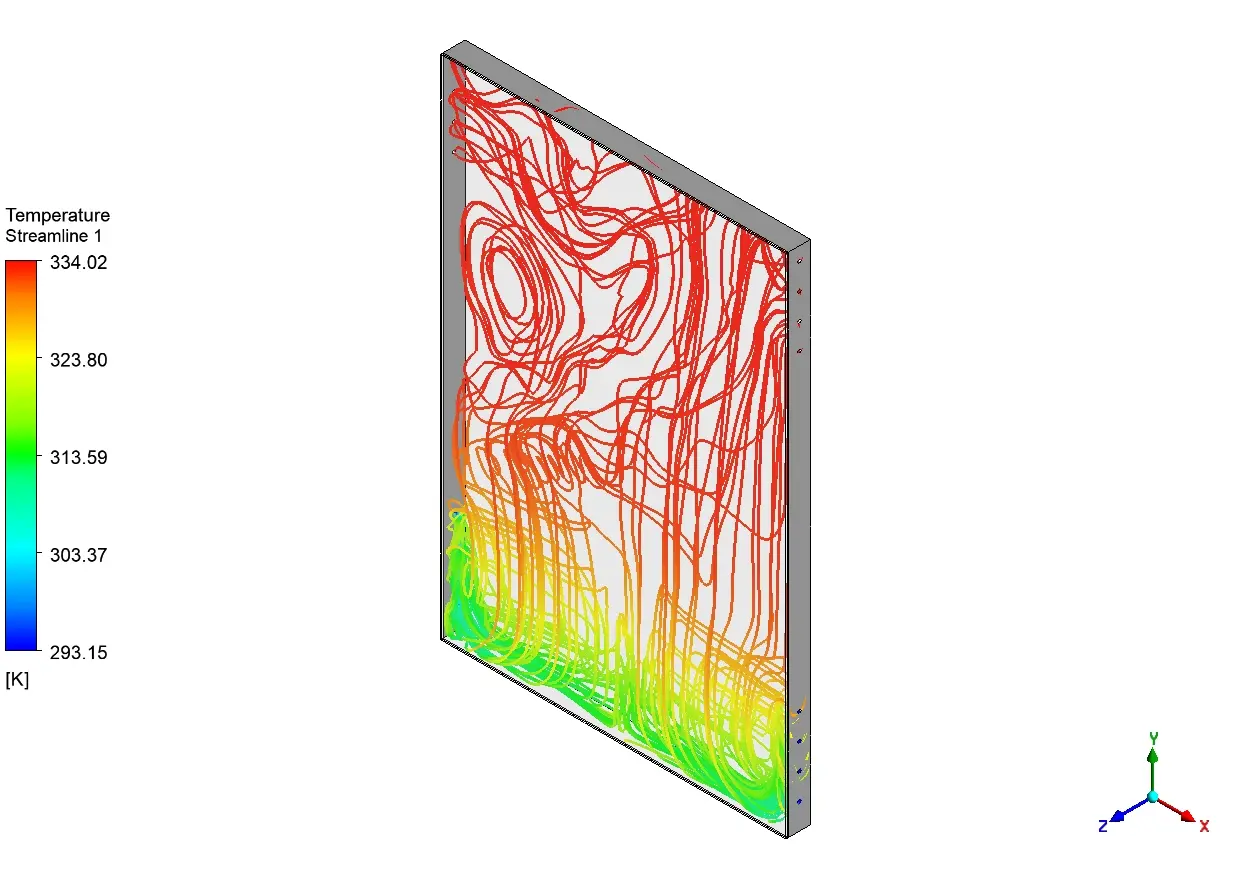
This uneven heat transfers directly into the air cavity. The temperature streamlines show cold air entering the bottom gap at 313 K (40 °C). As this cold air touches the hot back of the panels, it absorbs thermal energy. Heated air becomes physically lighter and less dense than cold air. Gravity pulls the heavy cold air down, which forces the light warm air to rise rapidly to the top. This upward motion is the natural chimney effect. Near the top exit, the hot air reaches a peak temperature of 334.02 K (61 °C) and creates swirling flow patterns as it escapes.
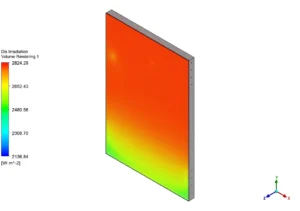
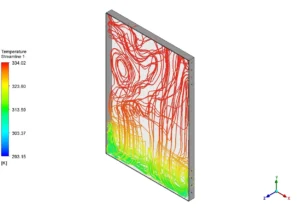
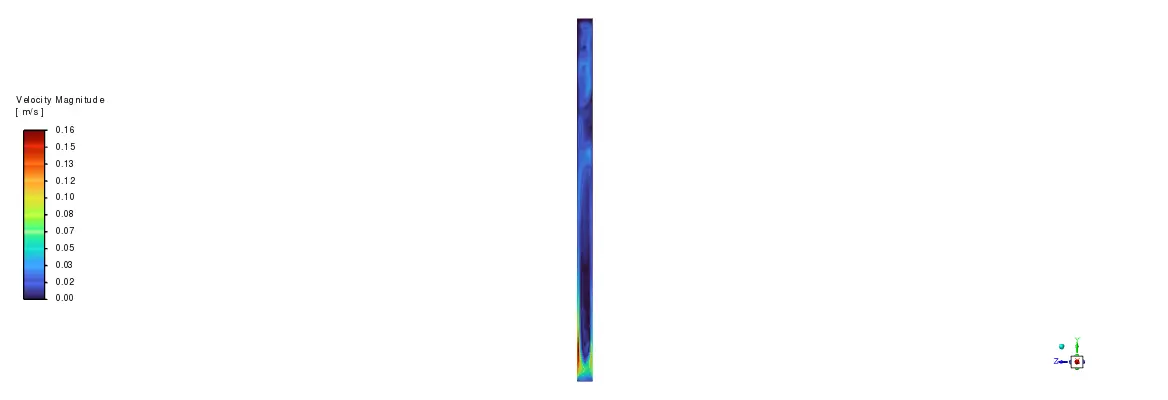
Figure 3: Irradiation distribution ranging from 2136.84 to 2824.29 W m^-2 and temperature streamlines showing the upward chimney effect inside the cavity, plus the Temperature Streamlines
This natural ventilation successfully cools the solid panels. On a day with 770 W m^-2 of sunlight, the panel temperature stops at 60.6 °C. A closed wall without ventilation would easily pass 80 °C. Because the panels stay cool, they produce more electricity. The data shows a power output of 159.7 W, which is 15 % higher than a non-ventilated design.
Frequently Asked Questions (FAQ)
- Why does a photovoltaic facade need an air gap? Sunlight heats the panels. High heat ruins their electrical efficiency. An air gap allows cold wind to flow behind the panel. This moving air absorbs the heat and carries it away, which keeps the power output high.
- What causes the chimney effect inside the wall? When air touches the hot panels, it warms up. Warm air is physically less dense than cold air. Gravity pulls the heavy cold air down. This falling action pushes the light warm air up and out the top opening.
- Why did the CFD model show slightly lower temperatures than the real experiment? The mathematical grid assumes the air cavity is perfectly smooth. Real physical walls have dust, screws, and rough spots that block the cooling air slightly. This small physical difference causes a normal error margin below 15 %.








Reviews
There are no reviews yet.