


Solar Air Heater CFD simulation is a powerful method to improve renewable energy systems. A standard Solar Air Heater (SAH) captures heat from the sun to warm up air for heating rooms or drying crops. The main problem with smooth heaters is that the air forms a thin, slow layer near the plate called the “laminar sub-layer.” This layer acts like insulation and stops heat transfer. To fix this, engineers use “artificial roughness,” such as V-shaped ribs.
In this report, we perform a Solar Air Heater CFD Validation study based on the experimental work of Rana et al. (2018). We simulate a rectangular duct with V-shaped ribs with gaps. We use Solar Air Heater ANSYS Fluent tools to check if our computer model matches real experiments. By performing a Solar heater fluent simulation, we can visualize how the ribs break the smooth air layer and mix the heat. This analysis helps manufacturers find the best rib angle to get the most heat without using too much fan power. For more details on sustainable energy modeling, please explore our Renewable Energy tutorials: https://cfdland.com/product-category/engineering/renewable-energy-cfd-simulation/
- Reference [1]: Rana, Jitesh, et al. “Computational fluid dynamics analysis of a V-rib with gap roughened solar air heater.” Thermal Science2 (2018): 963-972.
- Reference [2]: Jain, Piyush Kumar, et al. “Performance analysis of multi-gap V-roughness with staggered elements of solar air heater based on artificial neural network and experimental investigations.” Environmental Science and Pollution Research25 (2021): 32905-32920.
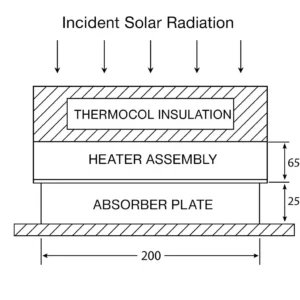
Figure 1: Figure showing the absorber plate of solar heater
Simulation Process: RNG k-ε Modeling in Fluent
The simulation process for this Solar Air Heater CFD simulation project focused on replicating the exact physics of the experimental setup. We created a 3D rectangular duct with a length of 1700 mm. The most important part of the geometry is the roughness element: V-shaped ribs with a P/e ratio of 10 and a rib height of 2 mm. To capture the complex flow around these small ribs, we generated a fine, unstructured mesh containing 5,772,353 cells. This high cell count is necessary for Solar Air Heater ANSYS Fluent validation to resolve the boundary layer accurately.
To solve the turbulent flow, we selected the RNG k-ε turbulence model. This model is superior for Solar heater CFD cases because it accurately predicts swirling flow and flow separation, which occur behind the ribs. We applied a constant heat flux of 1000 W/m² on the absorber plate to mimic solar radiation. we tested Reynolds numbers from 3,800 to 18,000. This rigorous setup allows the Solar heater fluent simulation to calculate the Nusselt number and friction factor with high precision.
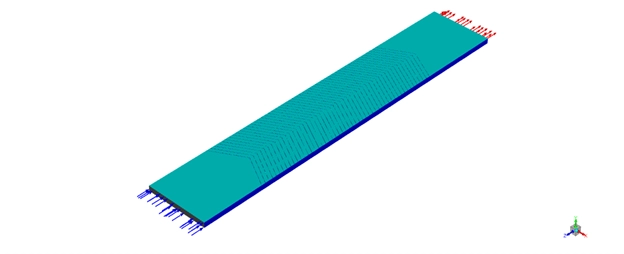
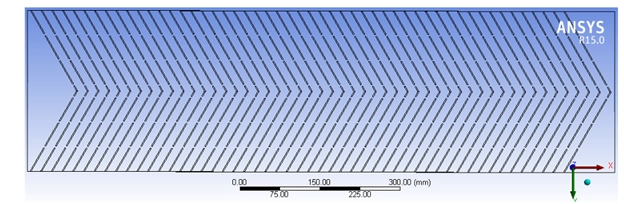
Figure 2: The detailed geometry of the V-ribs with symmetrical gaps used for the Solar Air Heater CFD study.
Post-processing: Validation and Thermohydraulic Analysis
The post-processing analysis provides a deep engineering verification of the V-rib design. We must analyze the graphs and contours to prove the simulation is valid and useful for designers First, we look at Figure 3 to validate our Solar Air Heater CFD simulation.
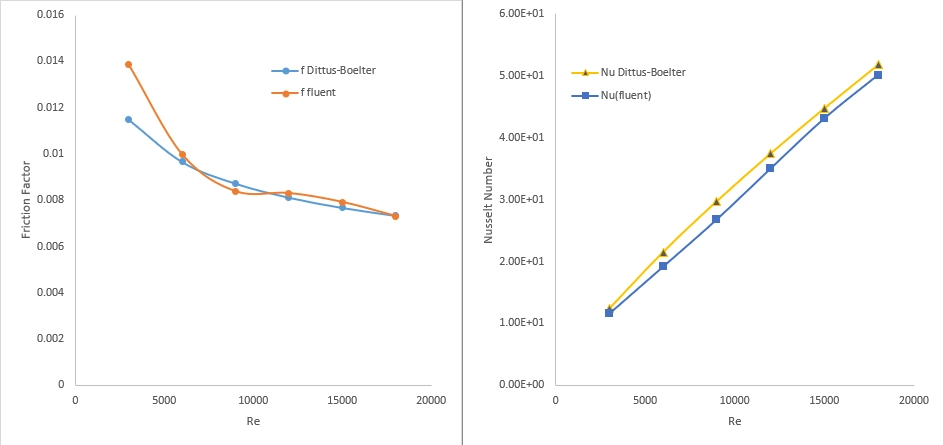
- Friction Factor: At a low Reynolds number (Re = 3,800), our Fluent result (0.0138) is higher than the theoretical equation (0.0115). This is correct because the ribs create extra resistance that the smooth-duct equation cannot predict. However, at a high Reynolds number (Re = 18,000), the difference drops to only 1.4% (0.0073 vs 0.0072).
- Nusselt Number: The right plot shows excellent agreement for heat transfer. At Re = 18,000, our simulation predicts a Nusselt number of 50.8, while the standard equation predicts 50.2. This is an error of only 1.2%. This proves that our Solar Air Heater ANSYS Fluent model captures the physics of turbulent flow perfectly.
Figure 3: Validation plots comparing the Friction factor and Nusselt number from ANSYS Fluent against the Dittus-Boelter correlation across different Reynolds numbers.
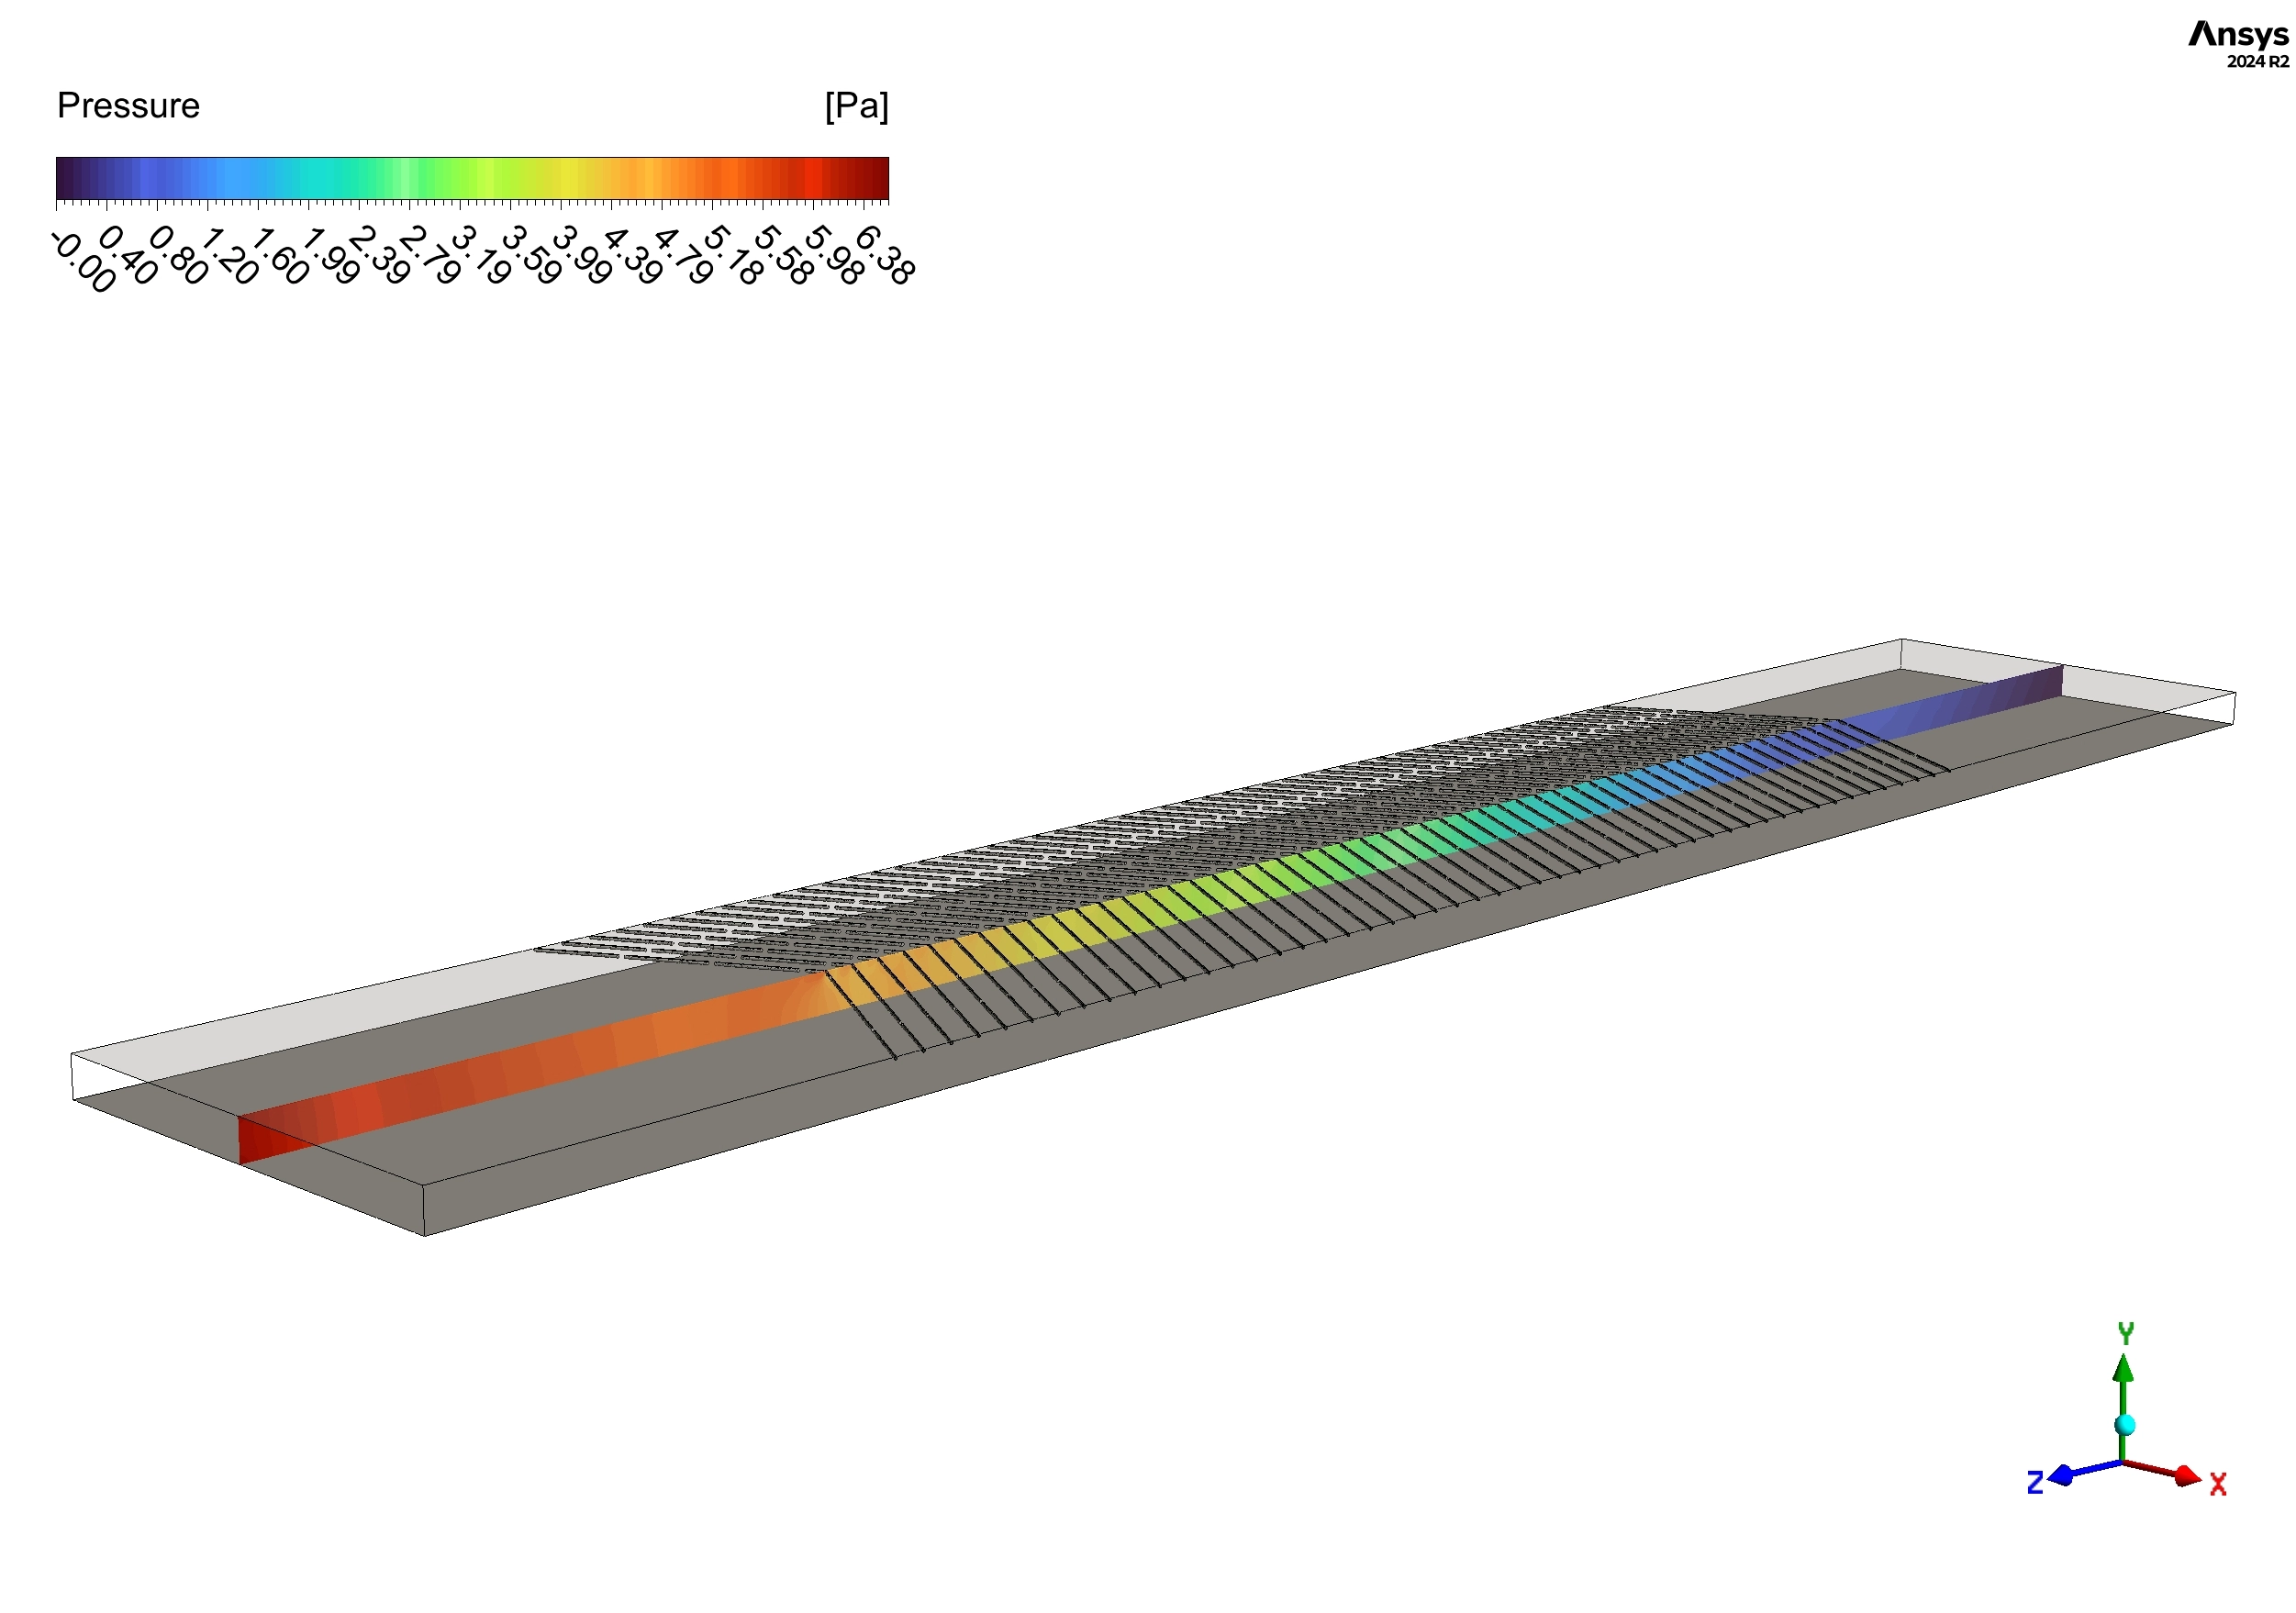
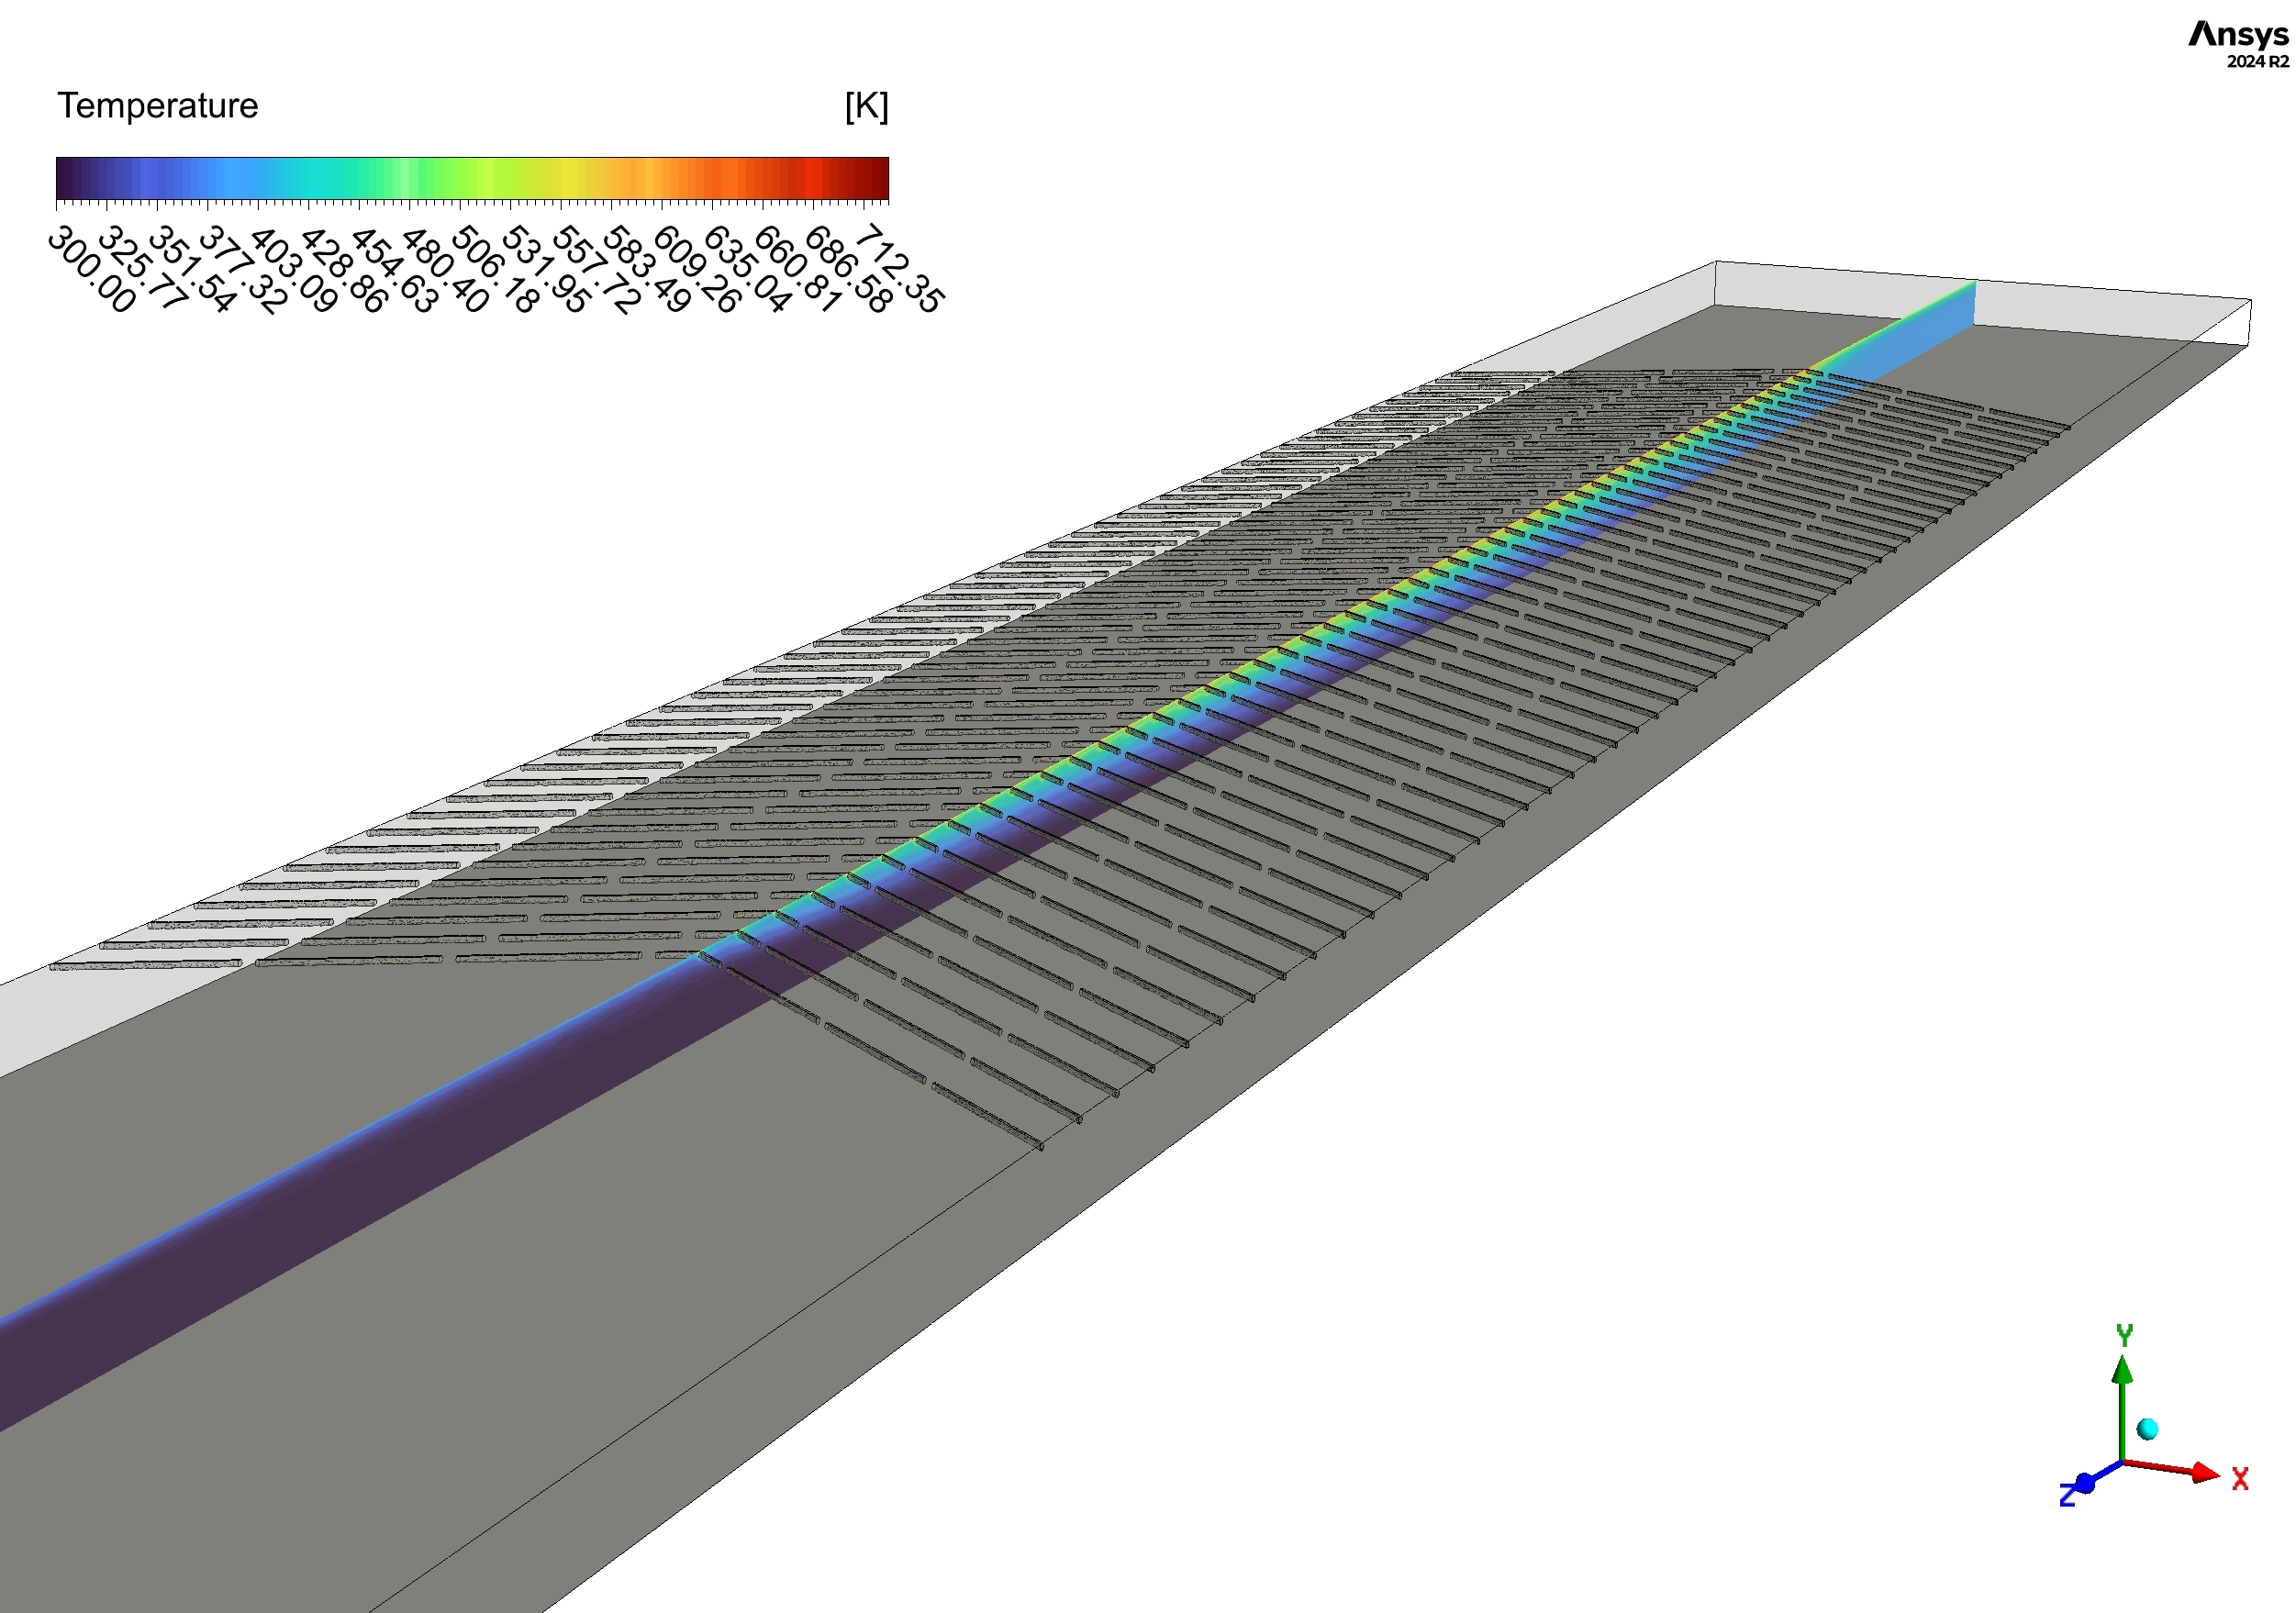
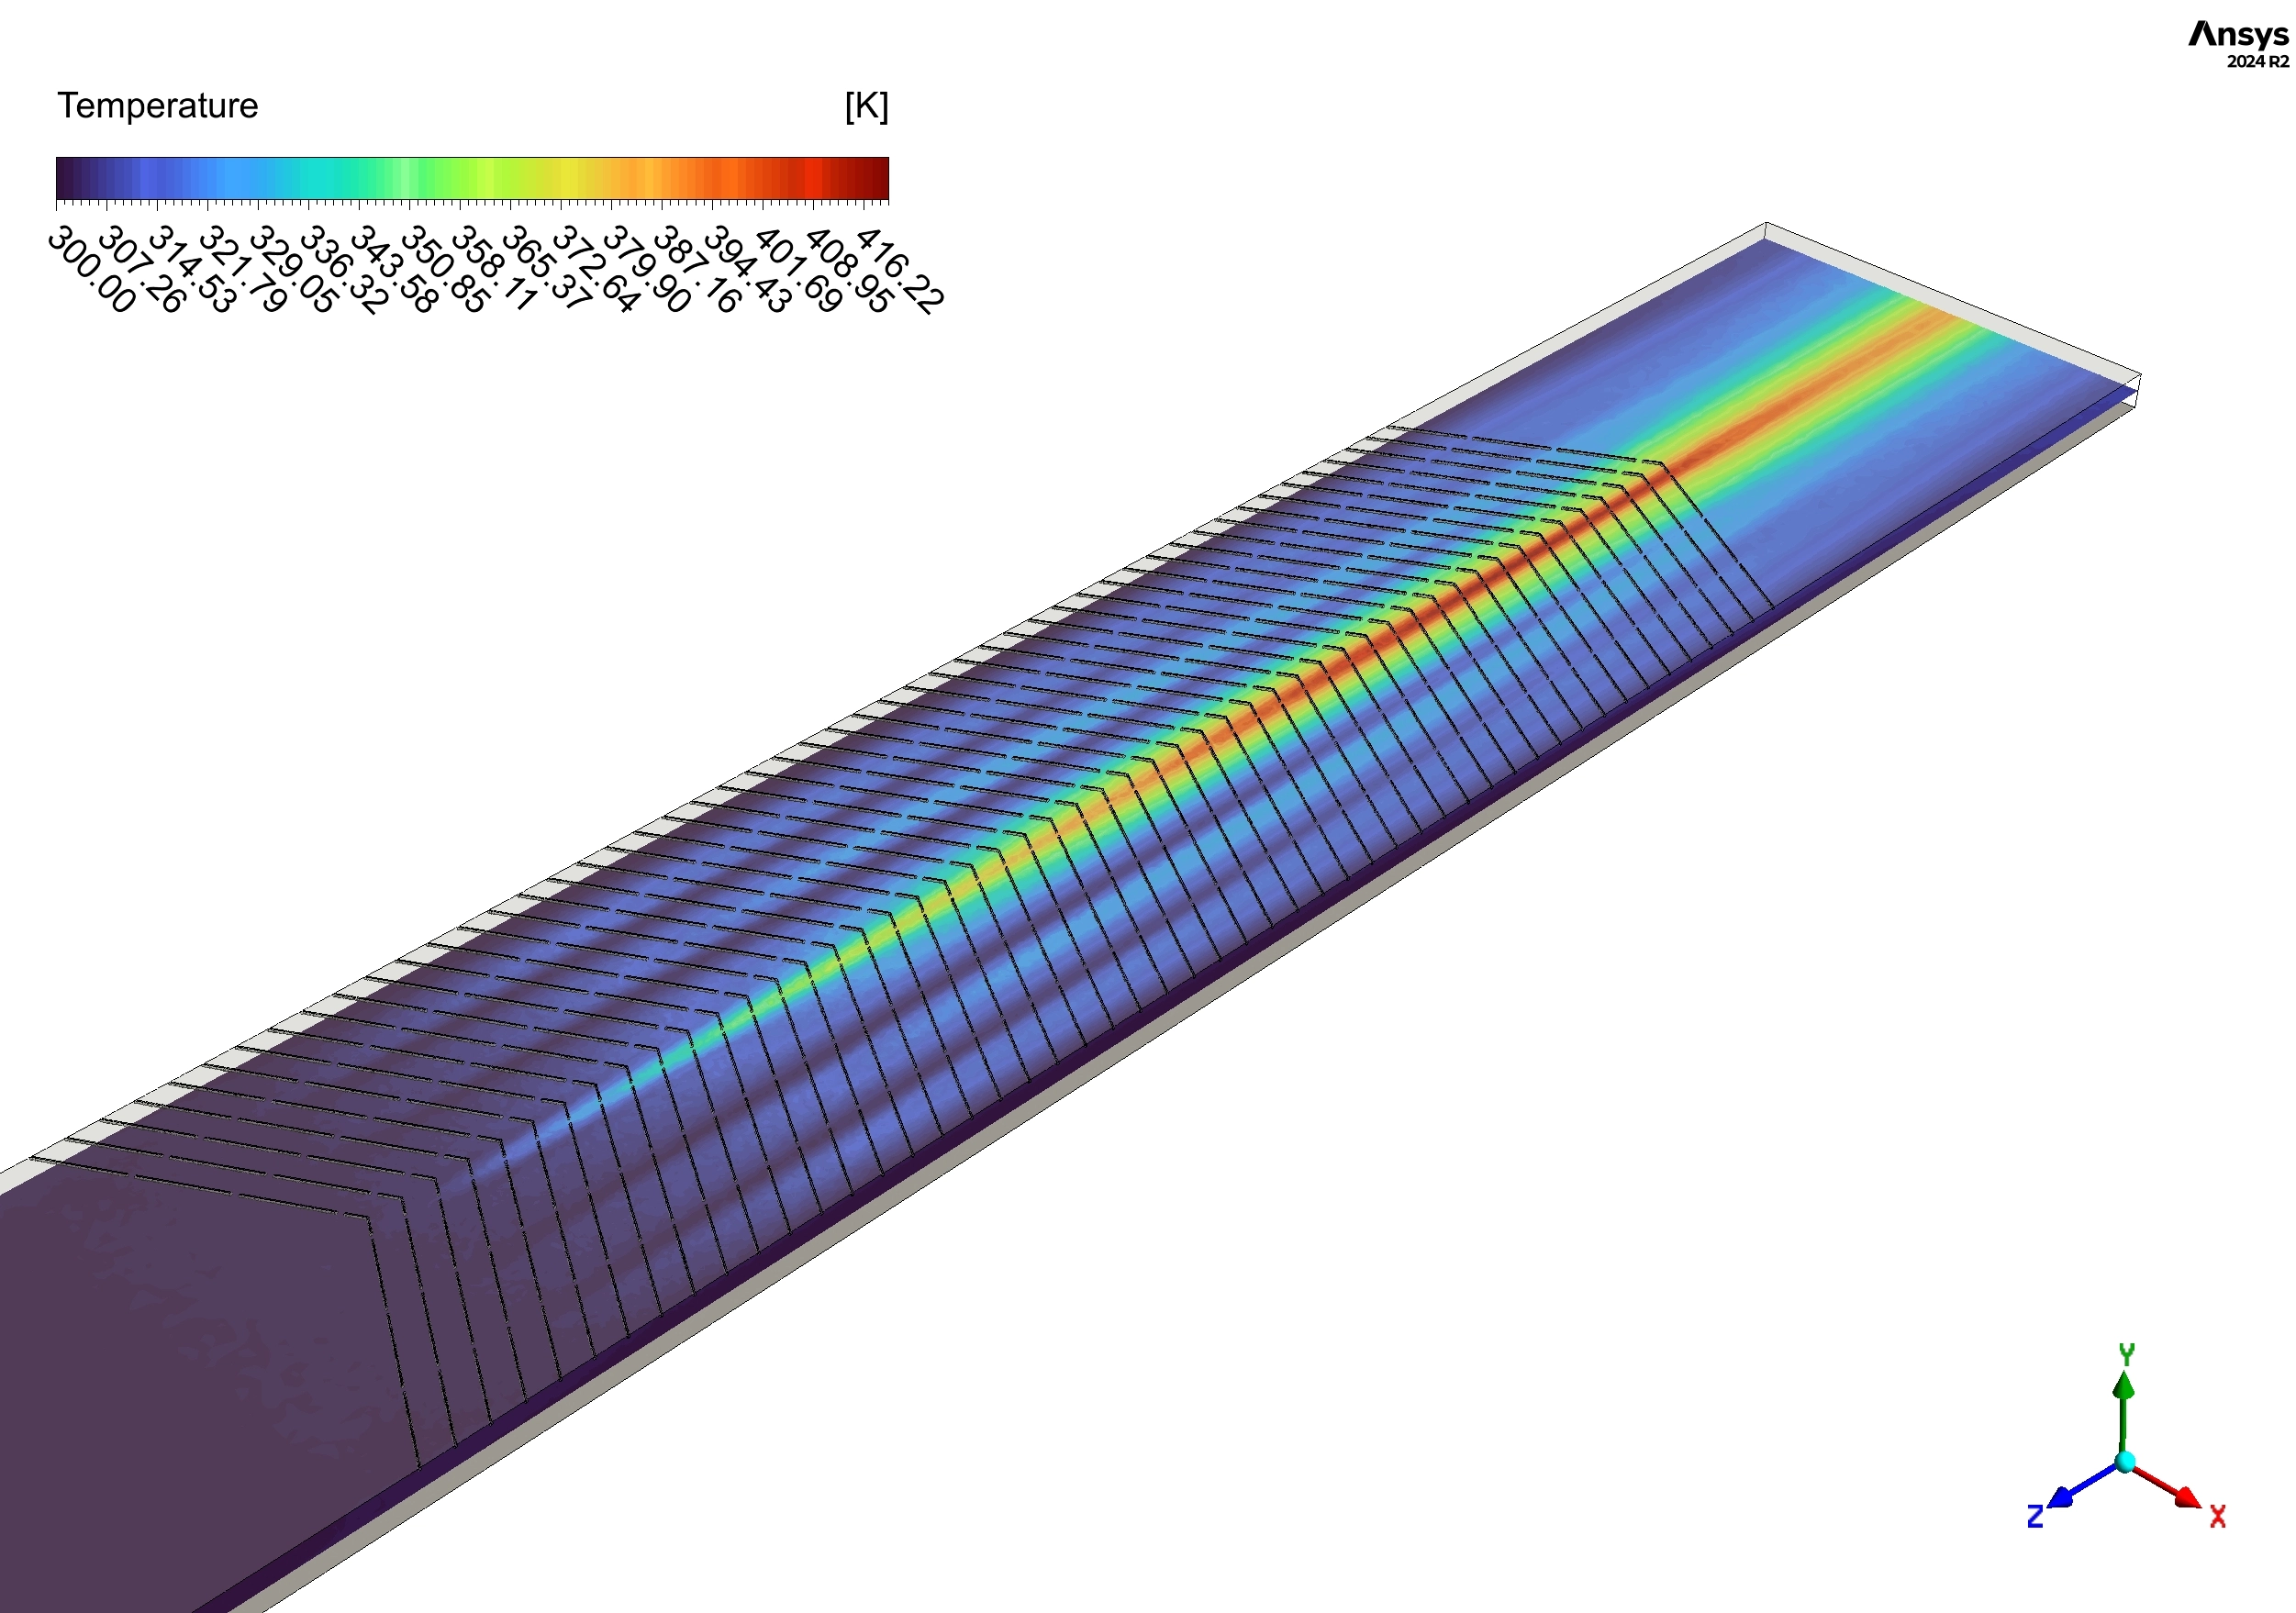
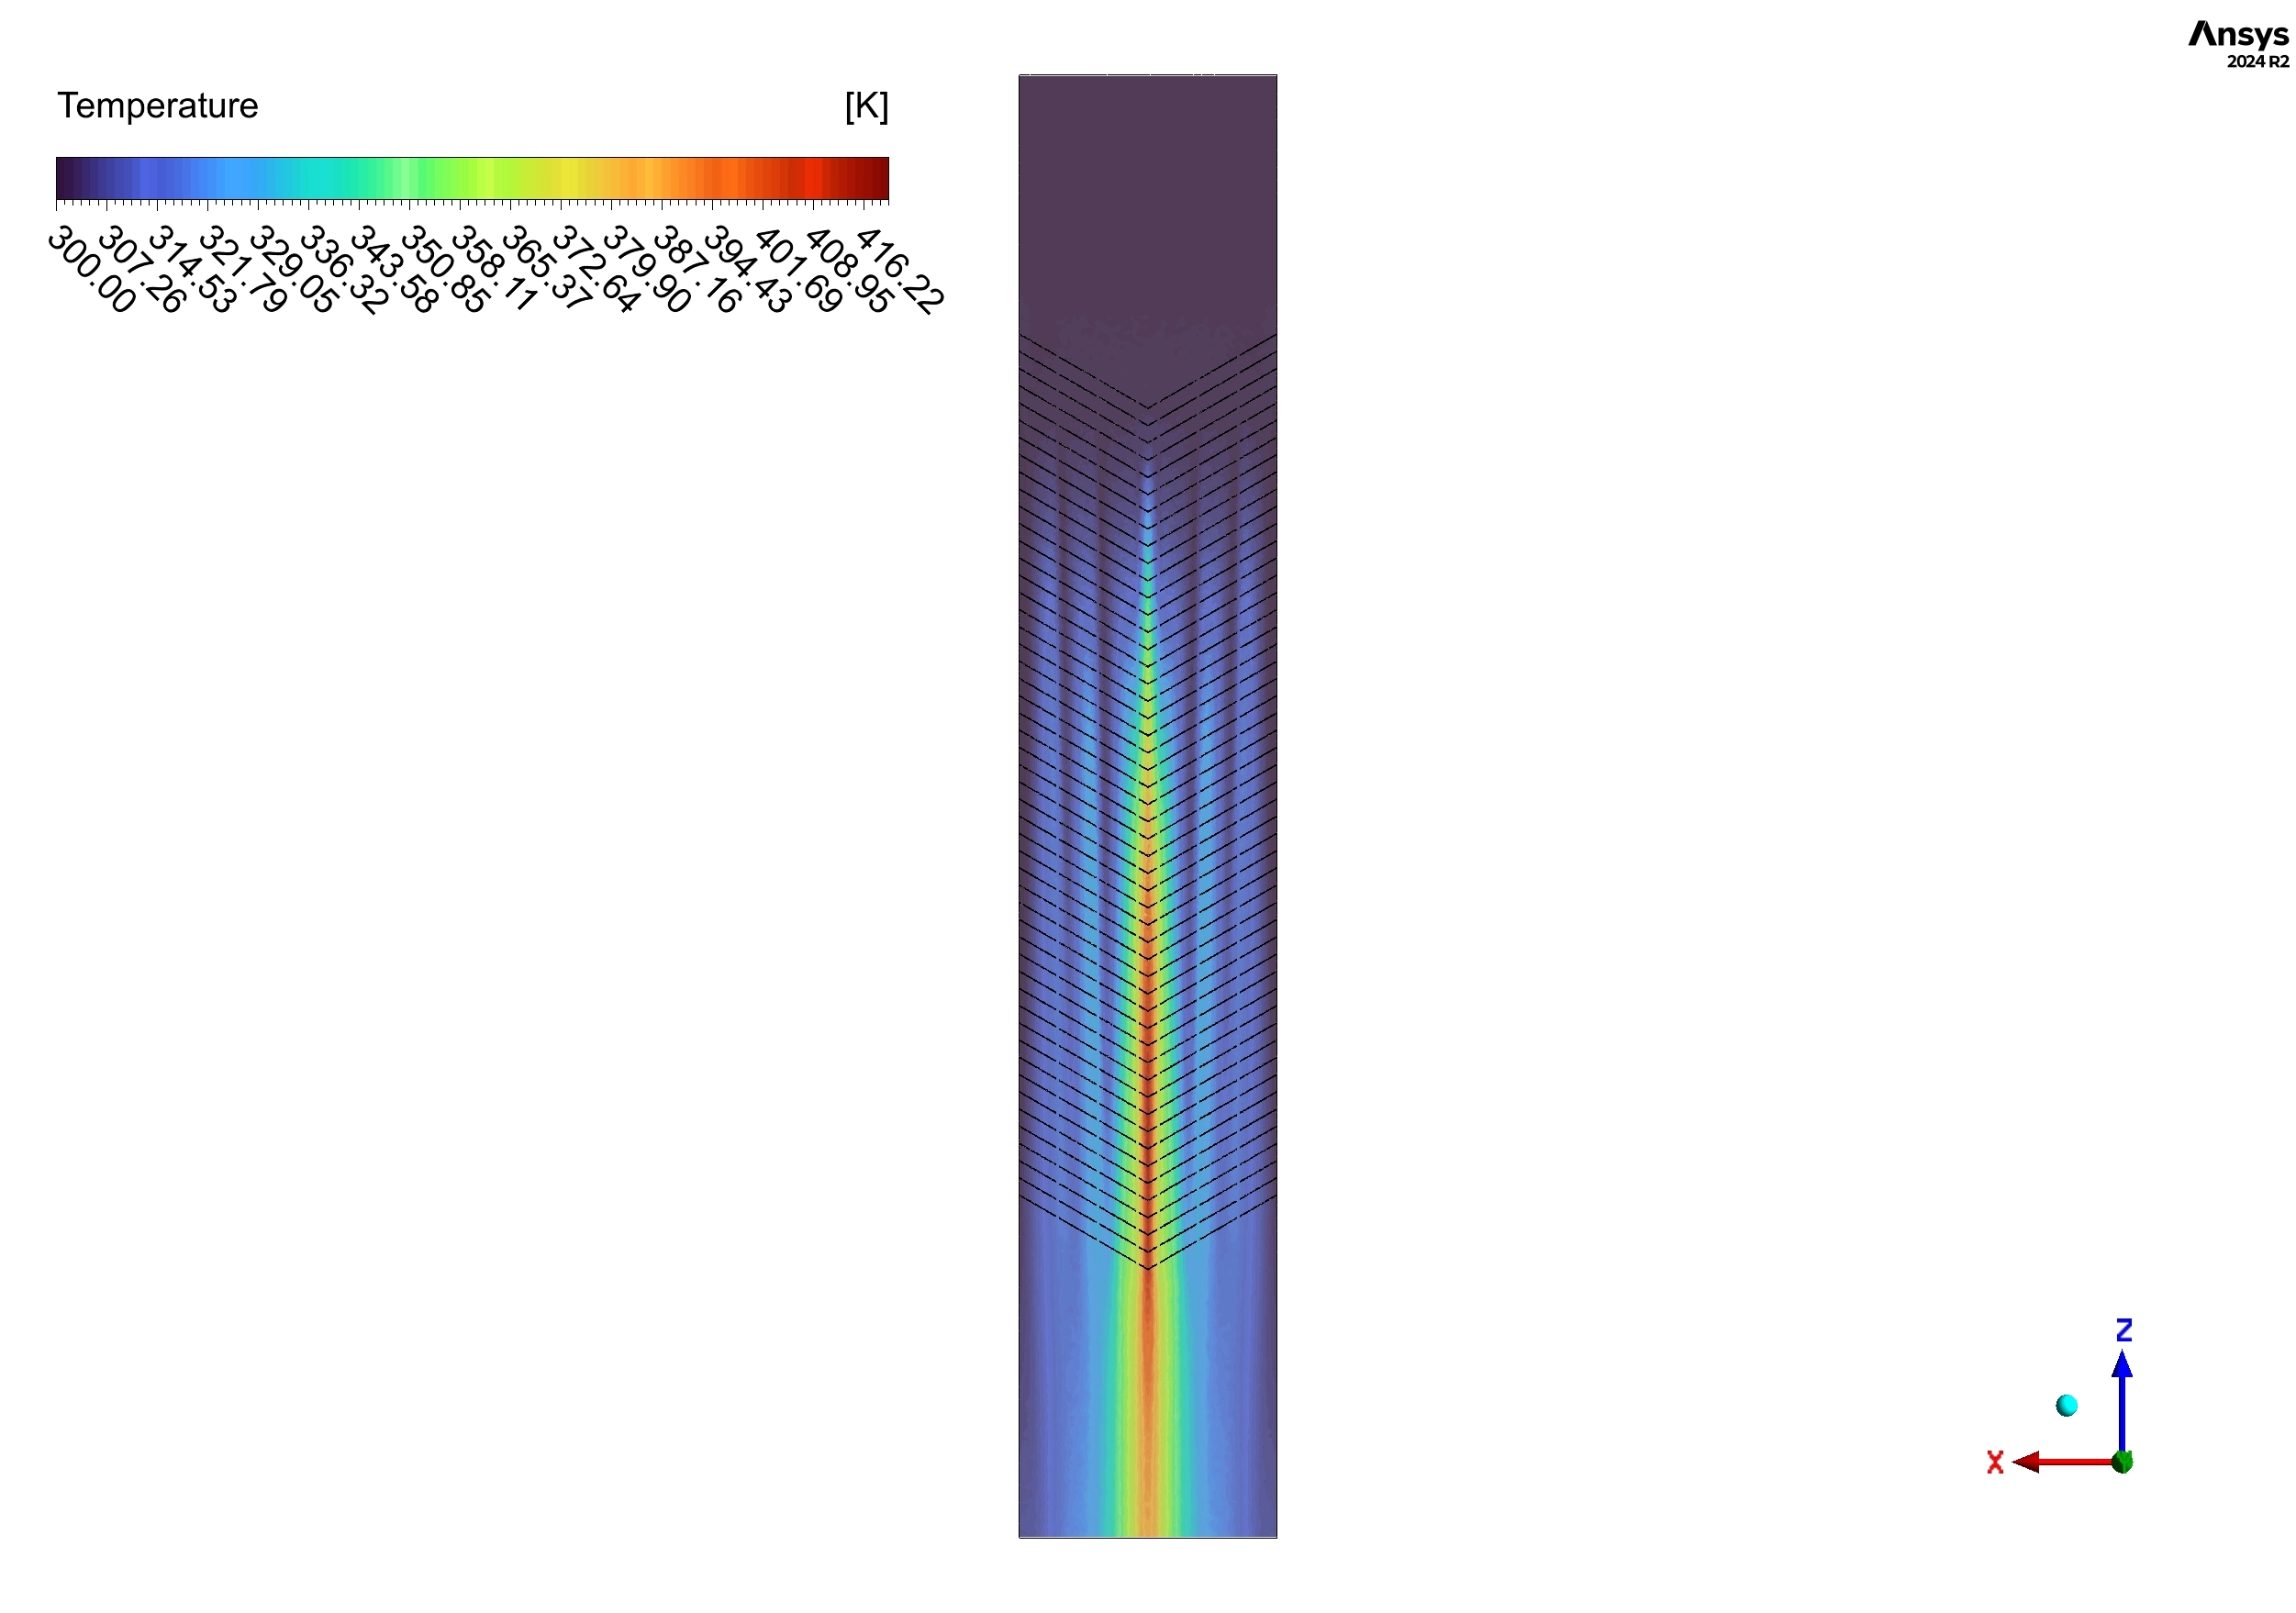
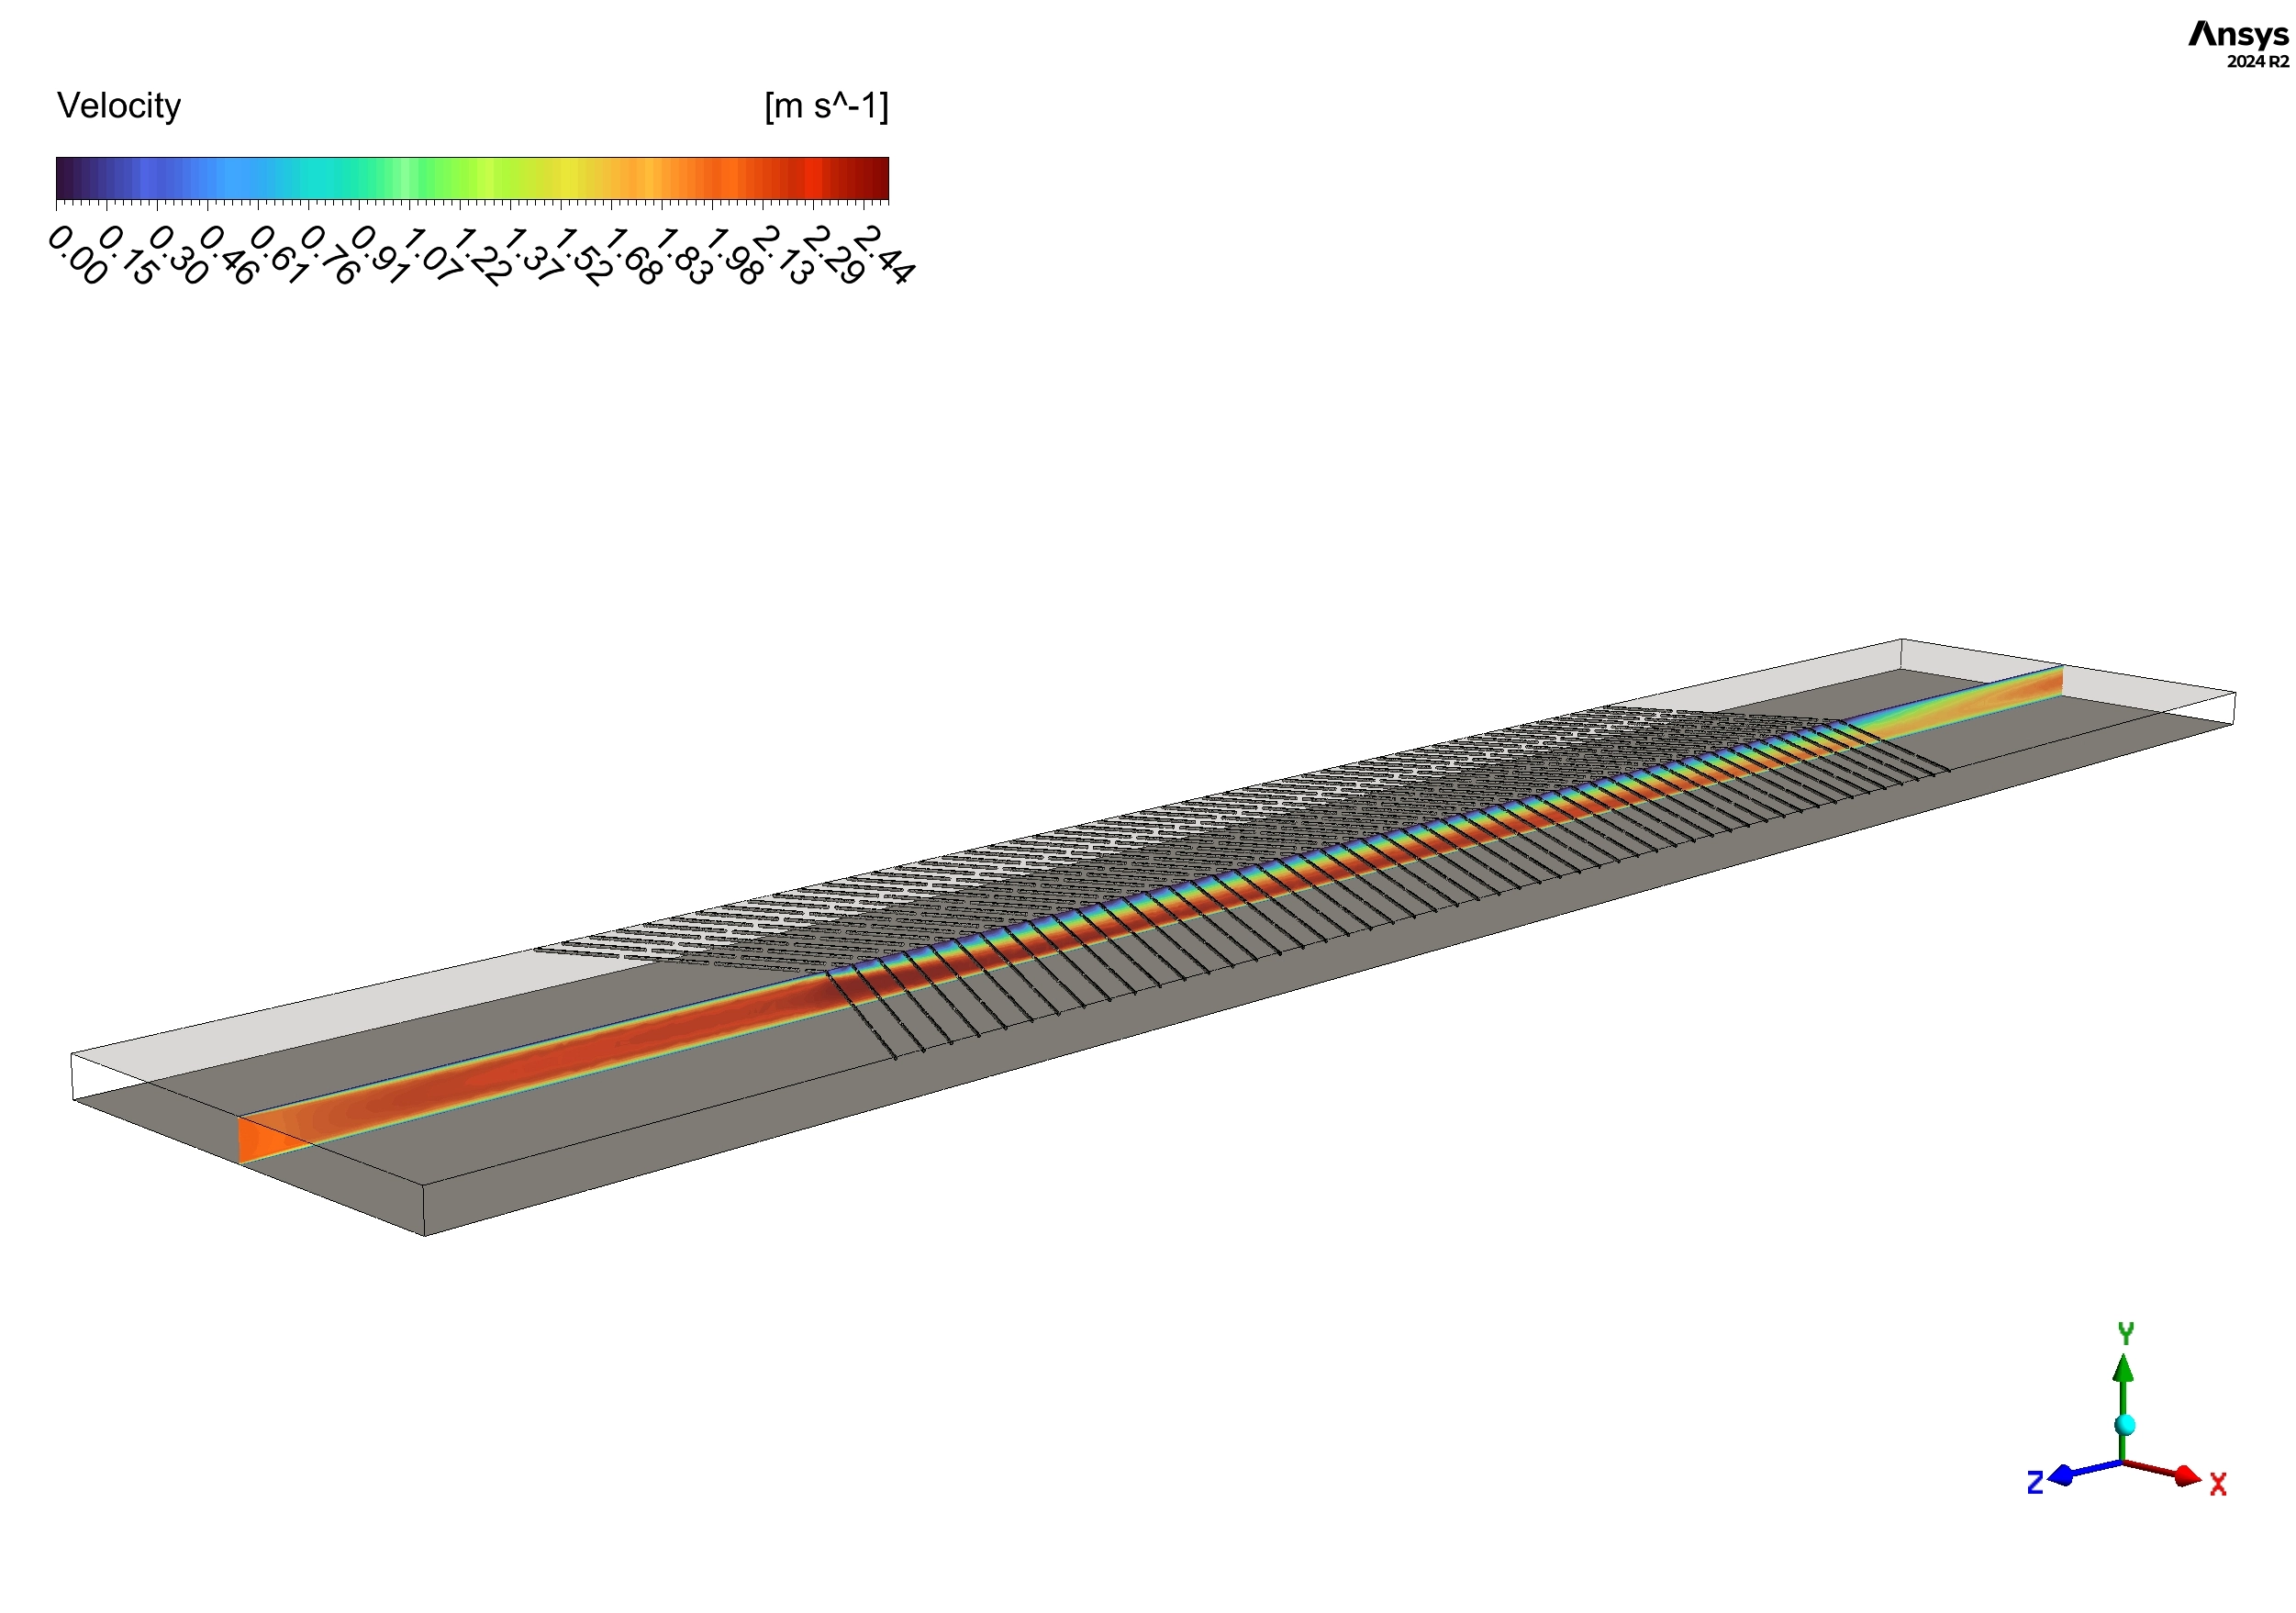
Next, we analyze the Temperature Contours in Figure 5. The color changes from blue (300 K) at the inlet to red (416 K) at the end. The most important detail is the “striped” pattern. We see yellow-orange streaks (368-372 K) right behind each rib. This happens because the air gets trapped in “recirculation zones” behind the rib. It slows down and absorbs more heat from the plate. The gradual color shift from cyan to red along the duct confirms that the air is continuously getting hotter as it passes more ribs. Finally, Figure 6 explains the mechanism. The velocity contours show the air speeding up.
- The average speed is around 0.72-0.90 m/s.
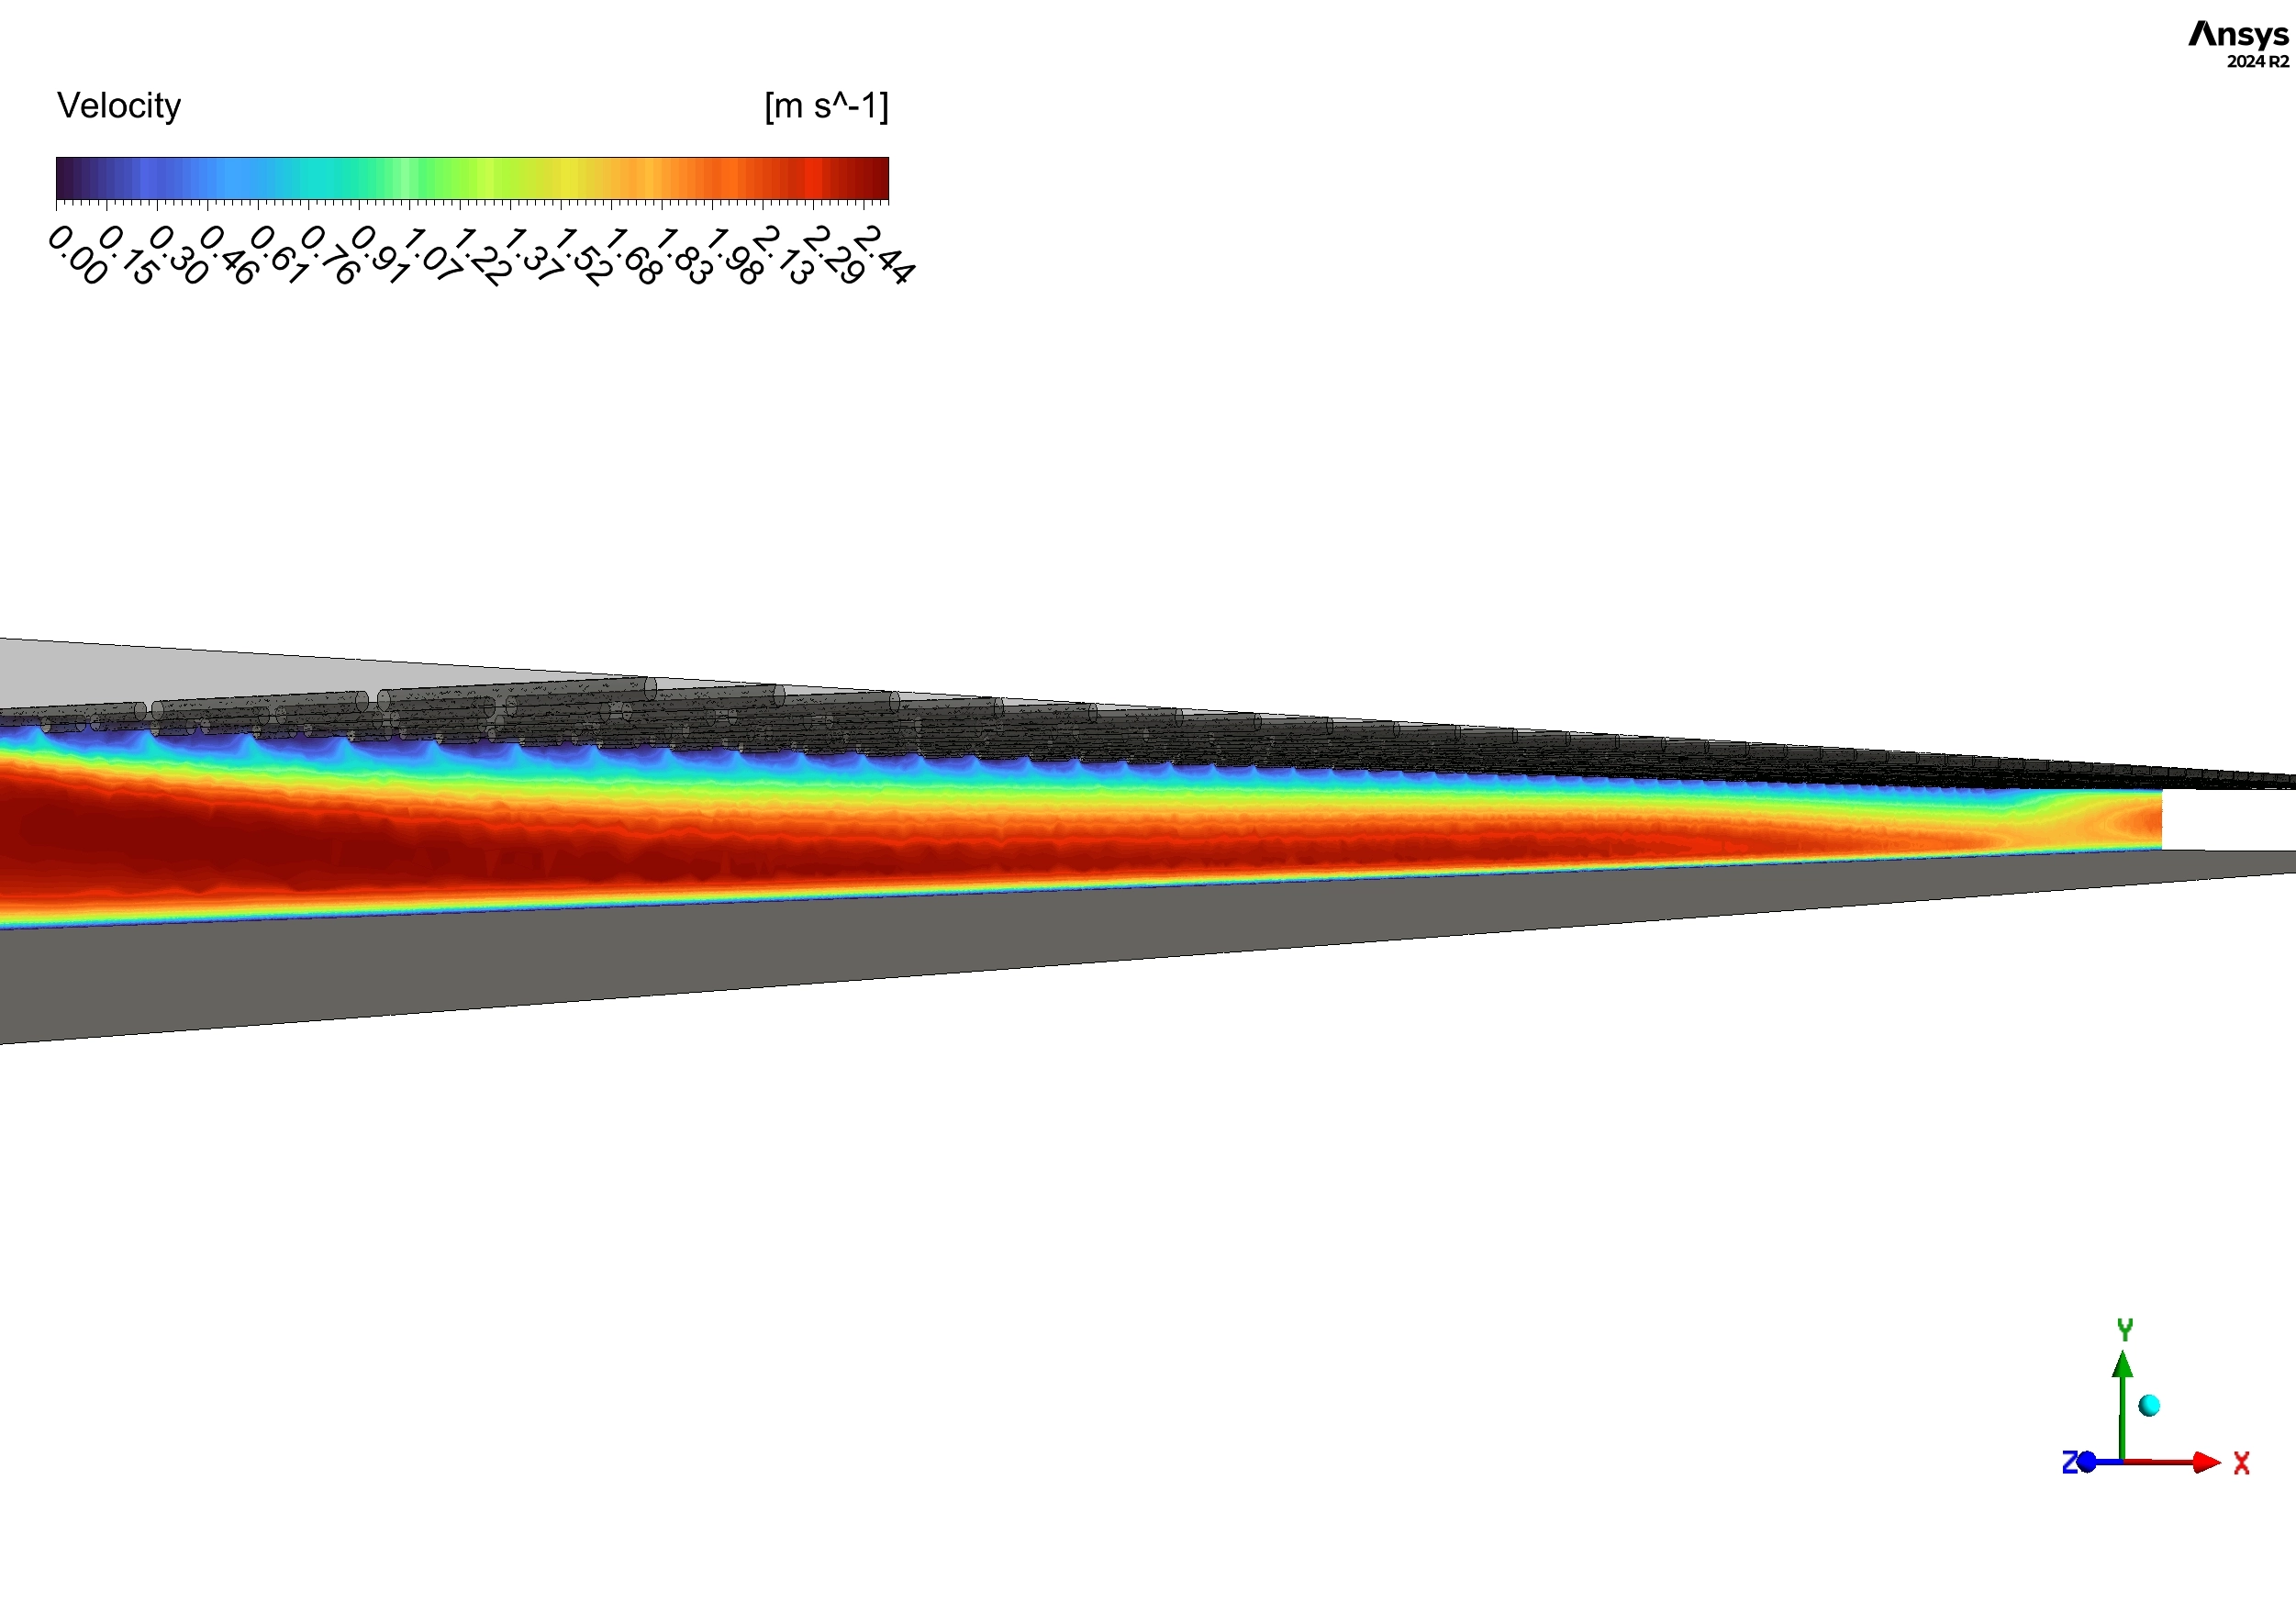
- But at the exit of the ribbed section, there is a high-speed jet of 1.35 m/s (bright yellow). The black vectors show the air curving over the ribs and forming small bubbles. These bubbles mix the hot air near the wall with the cold air in the center. This “mixing” is the secret to high efficiency. The simulation confirms that the V-ribs with gaps successfully break the laminar sub-layer, making the Solar Air Heater much more effective than a smooth plate.
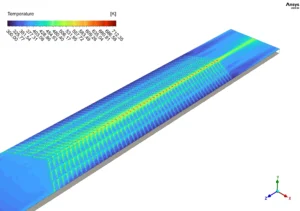
Figure 4: Temperature contours on the absorber plate surface showing the thermal development stripes created by the V-rib roughness.
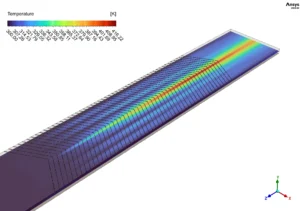
Figure 5: Temperature distribution with a rainbow color scale, visualizing the progressive air heating from 300 K to 416 K along the Solar heater CFD domain.
The V-rib pattern creates alternating hot and cold stripes running diagonally across the duct. The hottest zones appear as yellow-orange streaks with temperatures reaching 368-372 K, located immediately downstream of each V-rib. These hot spots form because the air slows down and heats up in the recirculation zones behind the ribs. Between consecutive V-ribs, we see cyan and green regions (328-351 K) where the air has moderate temperature. The exit section (right side) has uniform blue color around 306-312 K, indicating that the air has picked up heat but cooled down slightly after leaving the ribbed zone. Figure 3 presents the velocity contours with velocity vectors on the absorber plate for the Solar Air Heater CFD analysis. The entire duct appears mostly orange-red (0.72-0.90 m/s), which matches the inlet velocity for this Reynolds number case. However, right at the exit of the ribbed section, there is a bright yellow streak with velocity reaching 1.35 m/s. This high-speed jet forms because the flow accelerates as it exits the constricted ribbed region and enters the smooth exit section. The velocity vectors (black arrows) clearly show flow separation and reattachment patterns around each V-rib. Behind each rib, the vectors curve downward and form small recirculation bubbles, then reattach to the surface before the next rib. These recirculation zones are critical for heat transfer enhancement in solar air heaters because they mix hot and cold air layers. Figure 4 shows another temperature contour view with a rainbow color scale ranging from 300 K (dark blue at inlet) to 416 K (red at the hottest point). The maximum temperature of 416 K appears as a red stripe near the end of the ribbed section, where the cumulative heating effect is strongest. The temperature increases progressively along the duct length, with the first few V-ribs showing cyan-green colors (312-350 K) and the last ribs showing yellow-orange-red (368-416 K). This spatial temperature distribution from ANSYS Fluent matches the expected behavior of solar air heaters where air temperature rises continuously as it absorbs heat from the absorber plate. The animation further illustrates how temperature and velocity fields evolve along the solar air heater duct, clearly showing the beneficial effect of V-ribs on heat transfer performance in this CFD validation study.
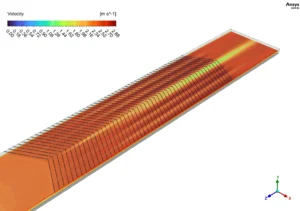
Figure 6: Velocity contours with vector overlays, showing flow separation, acceleration zones (1.35 m/s), and reattachment patterns behind the ribs.


Reviews
There are no reviews yet.