
Solar Water Desalination is a green technology that turns salty ocean water into clean drinking water. It uses the sun’s energy to heat water, turn it into vapor, and then collect it as fresh liquid. This is vital for dry areas with no fresh water. However, the physics inside these units, involving evaporation and condensation, is complex. To understand this without building expensive prototypes, engineers use CFD Analysis of Solar Water Desalination.
In this report, we perform a Solar Water Desalination CFD Validation study. We model a solar still unit using ANSYS Fluent. We simulate the entire process of heat transfer and phase change. By comparing our Solar Water Desalination fluent simulation results with real experimental data, we prove that our virtual model is accurate. This allows us to predict how much clean water a system can produce before it is even built. For more details on green energy modeling, please explore our Renewable Energy tutorials: https://cfdland.com/product-category/engineering/renewable-energy-cfd-simulation/
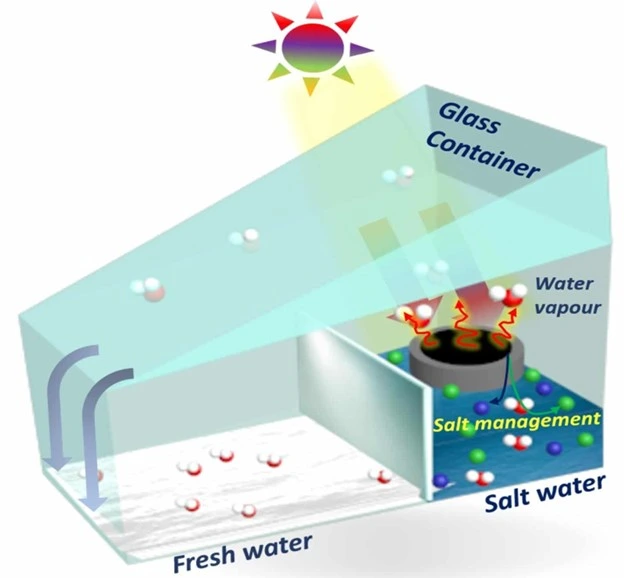
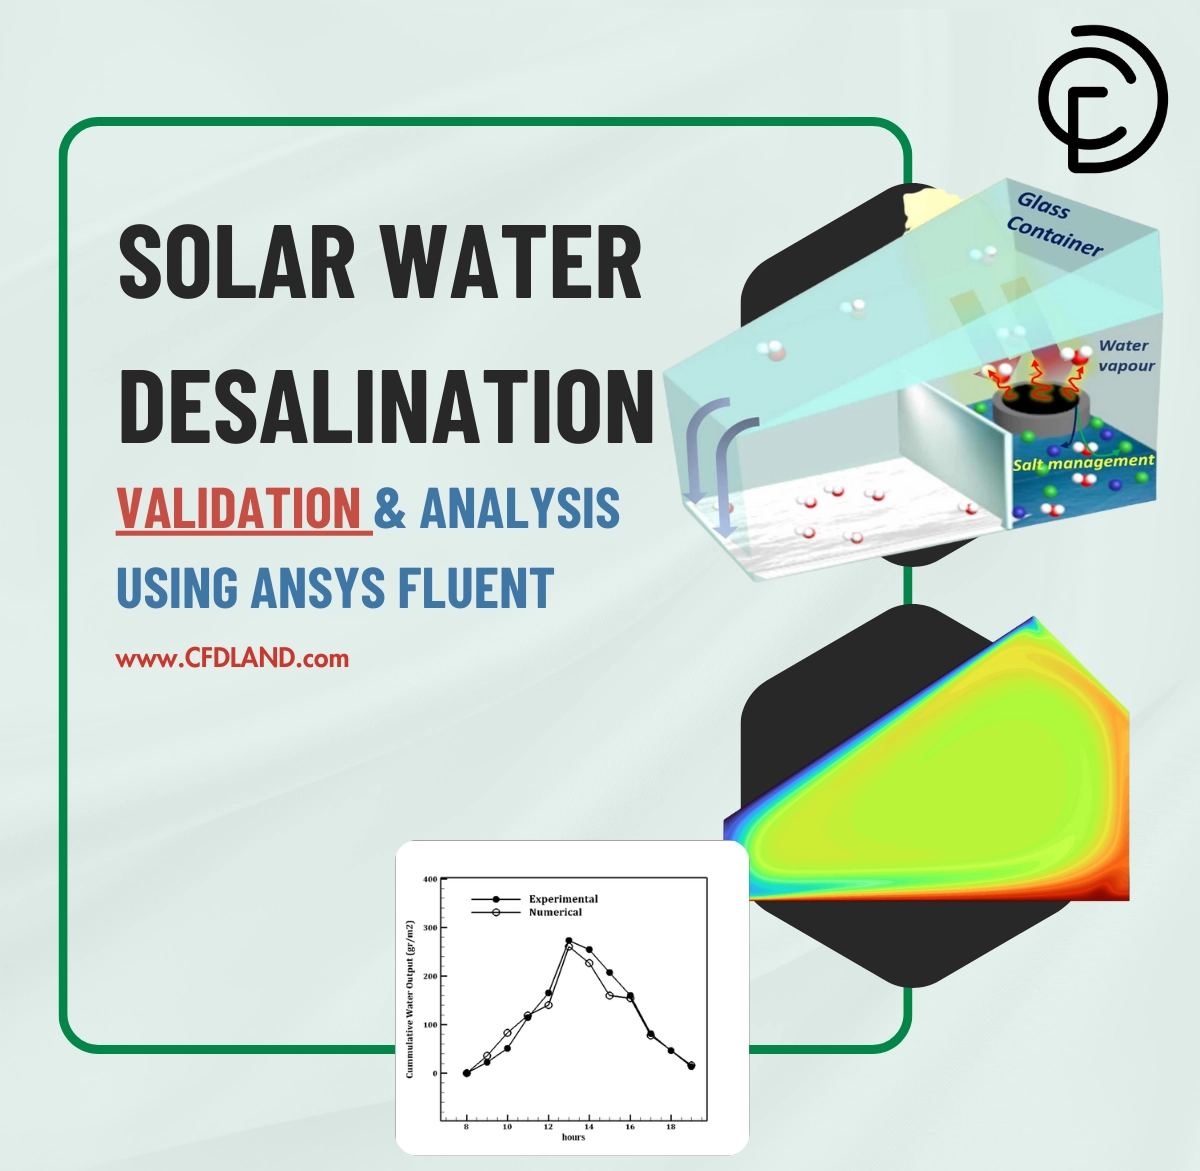
Figure 1: Schematic diagram of the Solar Water Desalination unit showing the basin, glass cover, and the evaporation-condensation principle.
Simulation Process: Structured Meshing, Species Transport and Transient Physics
For this Solar Water Desalination CFD Simulation, we designed a 2D geometry that represents the cross-section of a solar still. The model includes the water basin at the bottom, an air gap in the middle, and an inclined glass cover at the top. We used a structured grid approach with a blocking strategy to create the mesh. This method aligns the cells with the flow direction. We generated exactly 25,000 cells. This is critical for Solar Water Desalination ANSYS Fluent studies because the evaporation and condensation happen in these thin layers.
To capture the phase change, we activated the Species Transport Model in ANSYS Fluent. This model tracks the movement of H2O vapor inside the air. When the sun heats the water, the model calculates how liquid turns into gas (evaporation). The vapor moves up and turns back into liquid (condensation) when it hits the cool glass. We set up a transient simulation that runs from 8:00 A.M. to 7:00 P.M. This covers 11 hours of sunlight. We applied a time-varying solar heat flux on the water surface to match real-world conditions. This allows the CFD Analysis of Solar Water Desalination to predict the total daily water production accurately.
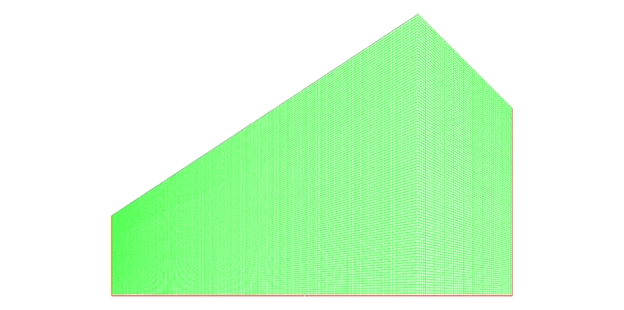
Figure 2: The Structured Grid generated for the domain, featuring 25,000 cells with fine resolution near the water and glass surfaces for accurate CFD Analysis.
Post-processing: Validation and Multiphase Flow Analysis
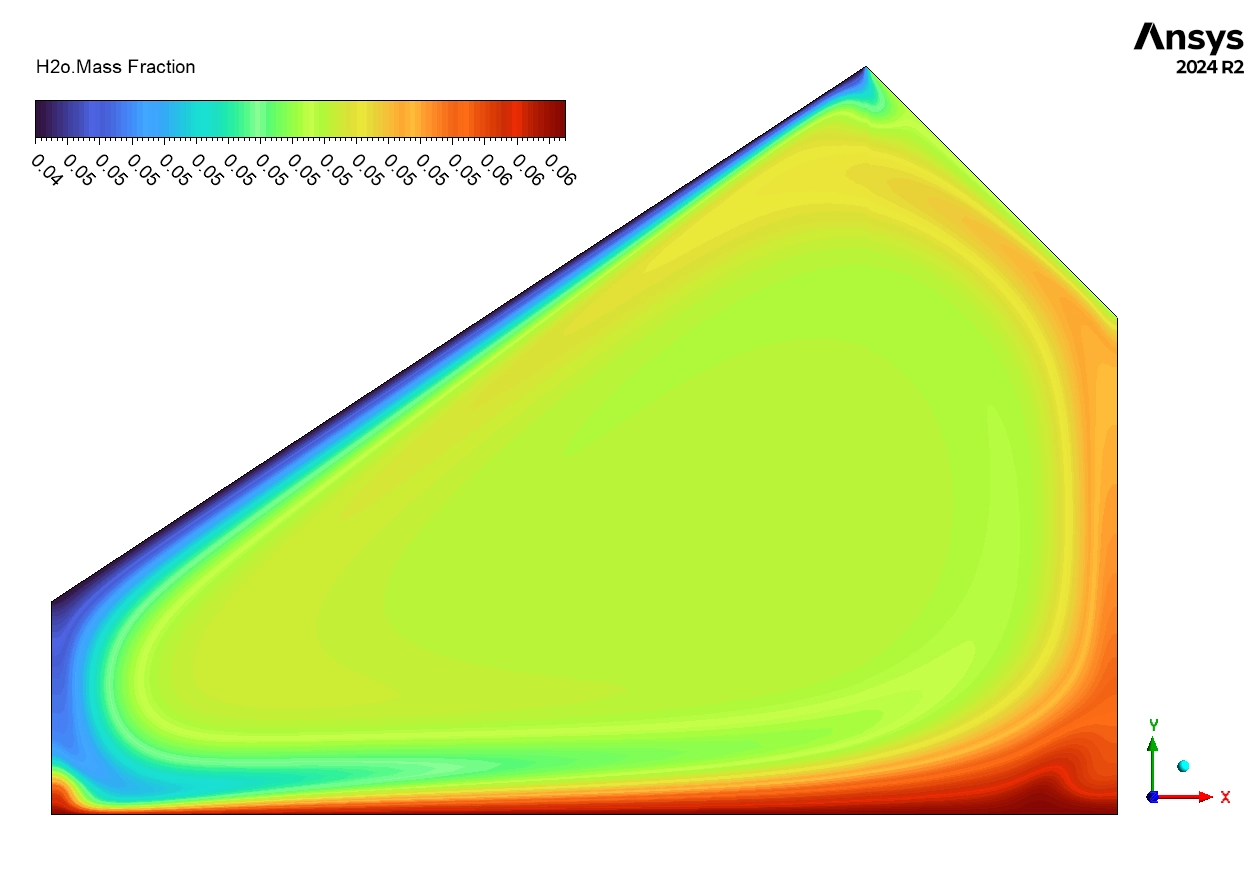
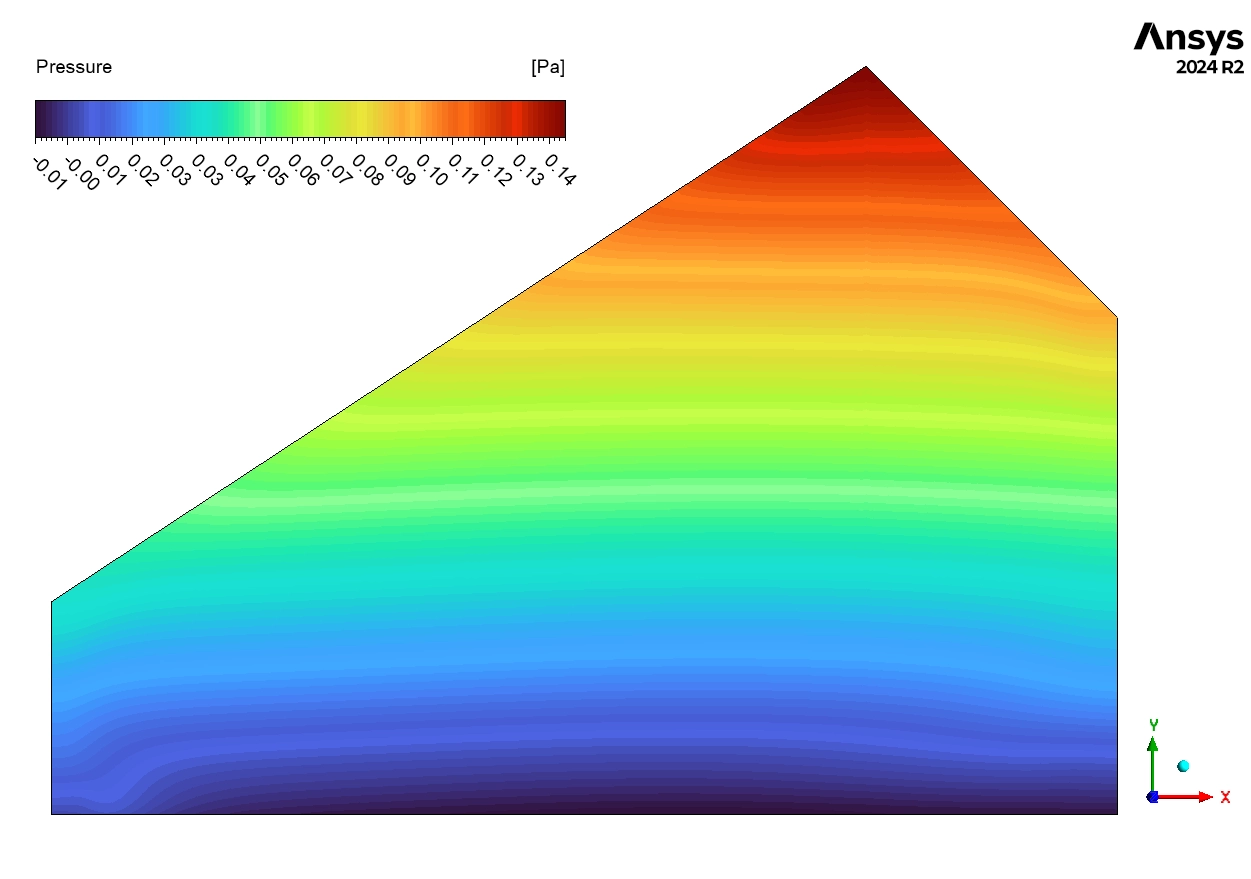
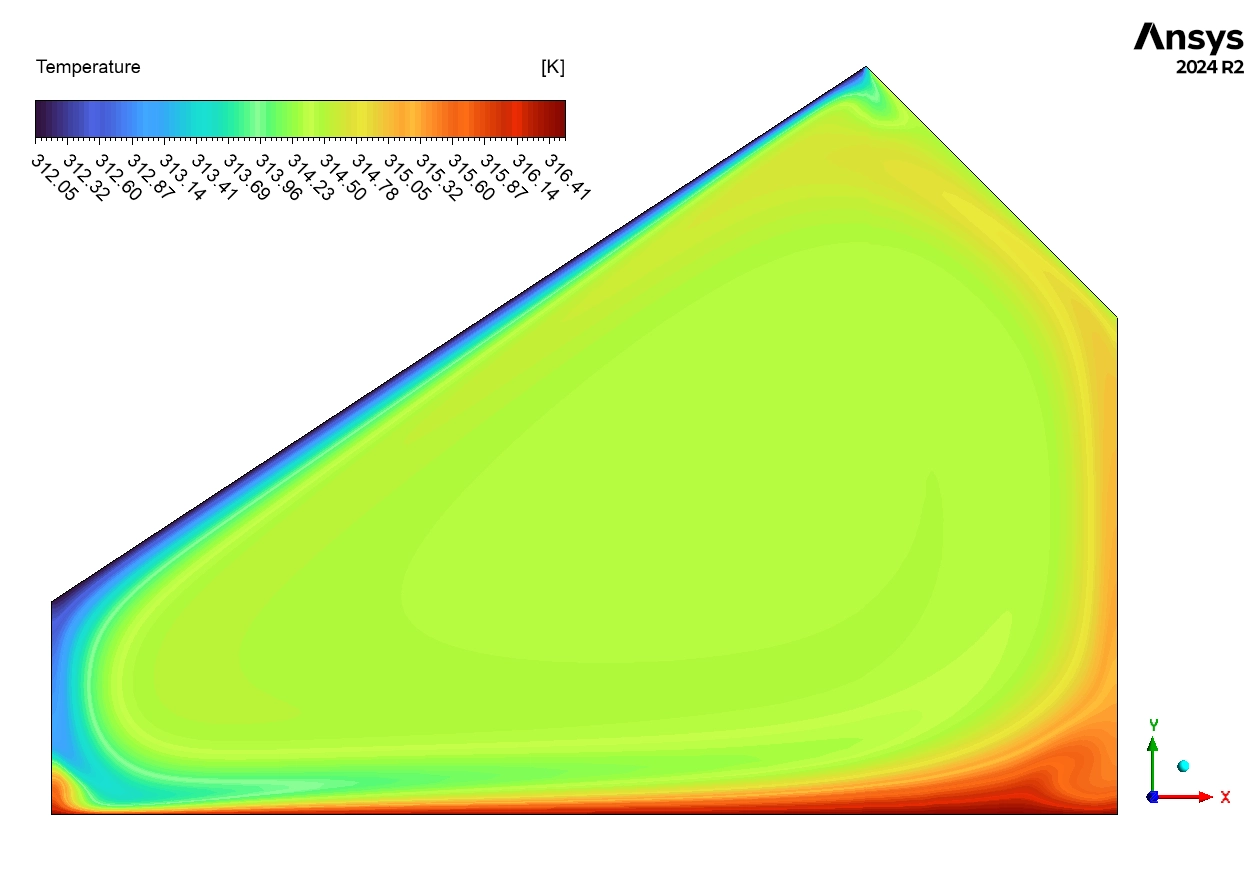
The post-processing analysis allows us to verify the accuracy of the simulation and understand the internal physics. We first examine the validation plot and then analyze the contours to explain how the desalination process works. We start by analyzing Figure 3, the Validation Plot. This graph compares the water output predicted by our Solar Water Desalination fluent simulation with the actual experimental measurements. The simulation runs from 8:00 to 19:00, covering the entire daylight period. The results show an excellent agreement between the CFD prediction and the real data. The error margin is very small. This is a significant engineering achievement. It confirms that the CFD – Solar Water Desalination model is reliable. Manufacturers can trust this digital model to test new designs without building costly physical prototypes. Next, we interpret the contours to explain the mechanism. Figure 4 shows the Temperature distribution. The bottom wall (water) is the hottest area, reaching 316 K. In contrast, the top wall (glass) is the coldest area at 312 K. This specific temperature difference of 4 K is crucial. It drives the evaporation at the bottom and condensation at the top. Figure 5 displays the H2O Mass Fraction. Near the hot water, the vapor concentration is high at 0.06, indicating strong evaporation. Near the cold glass, the value drops to 0.04, proving that vapor is condensing into liquid water.
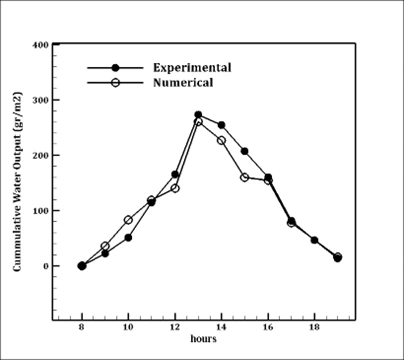
Figure 3: Validation Plot comparing the cumulative water output from the ANSYS Fluent simulation against the experimental data over an 11-hour period.
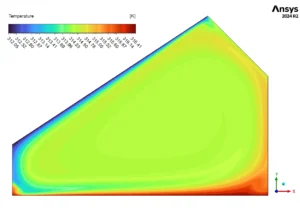
Figure 4: Contour plot of Static Temperature distribution, highlighting the gradient between the hot water basin (316 K) and the cooler glass cover (312 K).
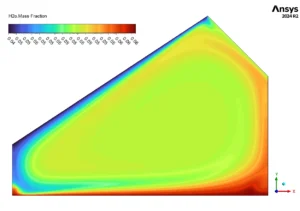
Figure 5: H2O Mass Fraction contours showing the phase change process, with high vapor concentration at the bottom and lower concentration near the condensation surface.
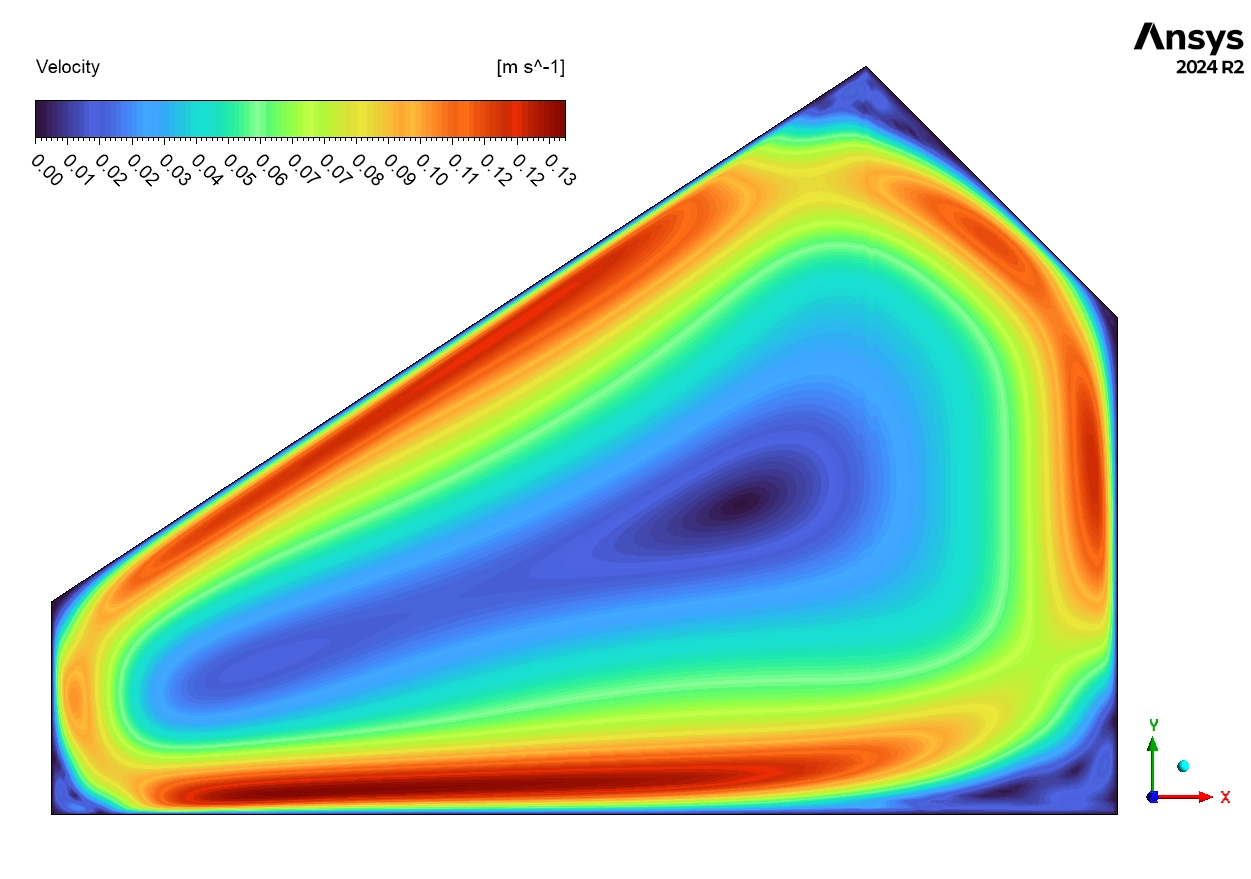
Finally, Figure 6 reveals the airflow pattern. The simulation shows a large natural convection loop inside the unit. The hot air rises from the bottom, and the cool air sinks from the top. The maximum velocity reaches 0.13 m/s near the walls. This circulation acts like a pump. It constantly moves humid air from the basin to the glass. The Solar Water Desalination Feedwell CFD Validation confirms that this natural movement is sufficient to maintain the desalination cycle efficiently.
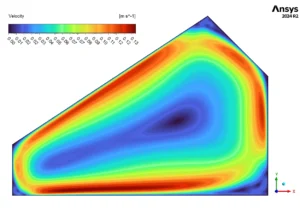
Figure 6: Velocity contour visualizing the natural convection circulation loop driven by density differences inside the Solar Water Desalination unit.


Reviews
There are no reviews yet.