
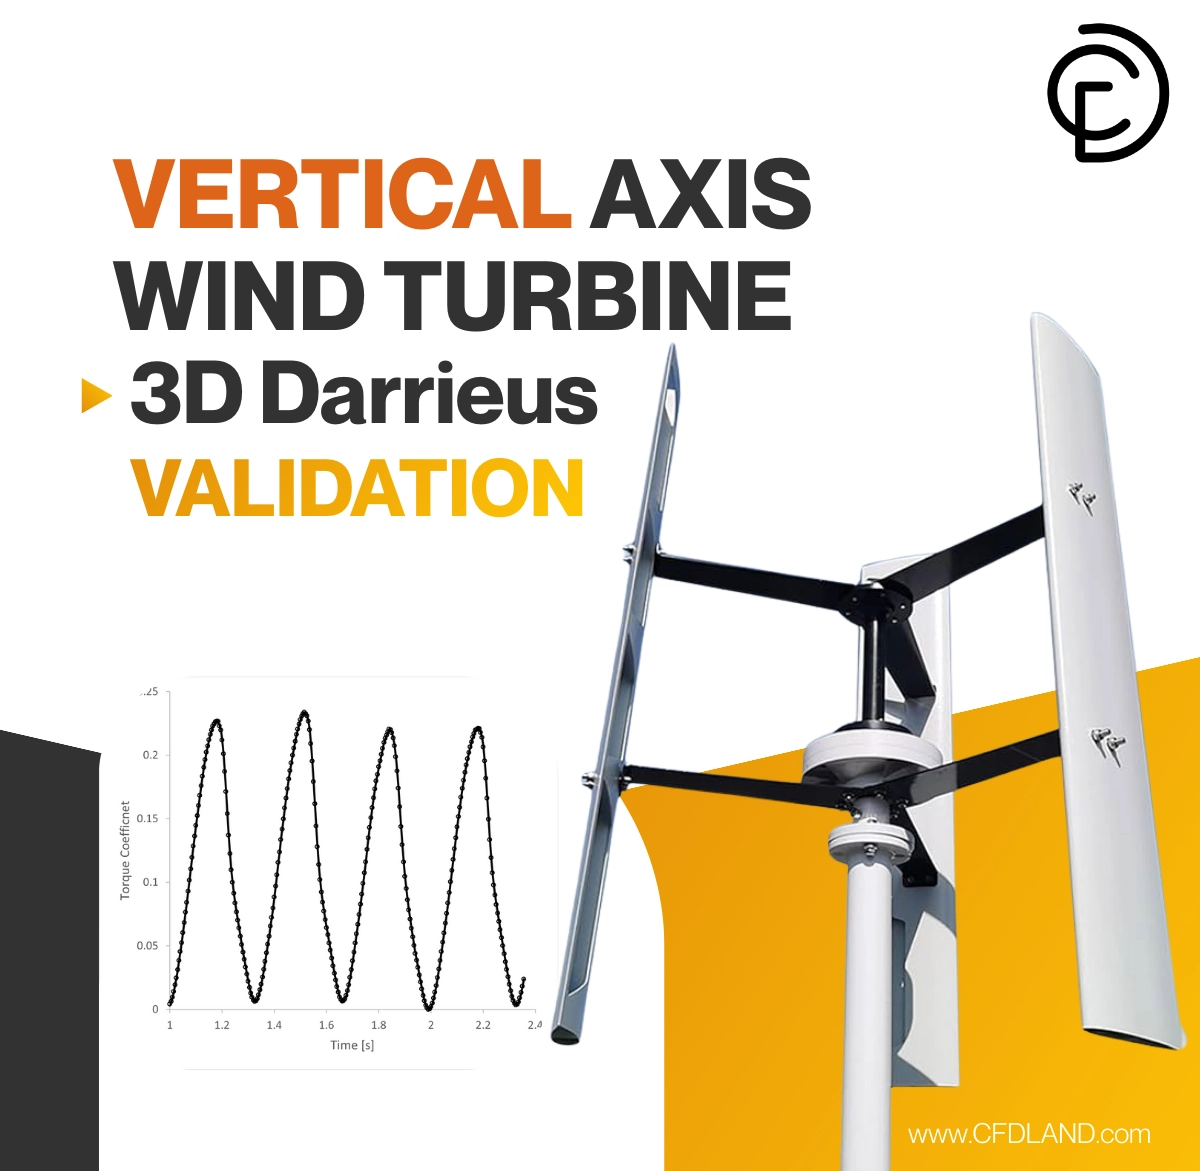


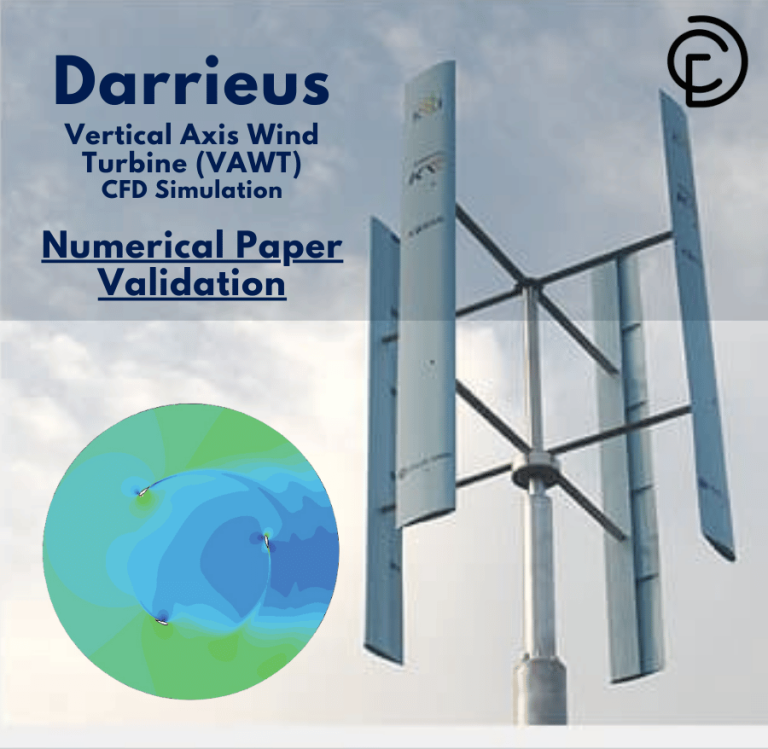
In this Vertical Axis Wind Turbine CFD Analysis tutorial, we provide a complete training guide on validating the performance of a 3D Darrieus turbine. Unlike standard horizontal fans that must face the wind, a Vertical Axis Wind Turbine (VAWT) captures energy from wind coming from any direction. This makes them ideal for urban areas with turbulent, changing winds. In this training, we focus on the “H-rotor” Darrieus design, which uses straight blades like a ladder. As the wind hits the airfoil, it generates lift that spins the rotor. However, modeling this is a challenge for any engineer because the blades constantly move through their own turbulent wake. To solve this, we use CFD simulation to replicate the complex aerodynamics virtually. We utilize ANSYS Fluent to simulate the rotating physics and validate our accuracy against experimental data. By following this VAWT fluent simulation, you will learn how to predict power output and efficiency reliably.
In this lesson, we validate our CFD setup against a reference paper by Alaimo et al. (2015). We model a three-bladed turbine using the advanced Sliding Mesh technique. Our goal is to calculate the Torque Coefficient (Ct) and ensure our ANSYS Fluent simulation matches the real-world experiment. For more training on green energy systems, please explore our Renewable Energy tutorials.
- Reference [1]: Alaimo, Andrea, et al. “3D CFD analysis of a vertical axis wind turbine.” Energies4 (2015): 3013-3033.
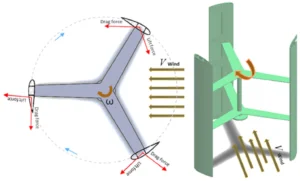
Figure 1: Schematic of the Darrieus VAWT geometry showing the three straight blades and rotor radius used for this CFD simulation.
Simulation Process: Sliding Mesh and Polyhexa Grid in ANSYS Fluent
For this ANSYS Fluent training, we built the geometry exactly according to the reference paper. The turbine has a radius of 0.99 meters and utilizes three NACA 0021 airfoil blades. We generated a high-quality Polyhexa Mesh containing 4,999,199 cells. In this tutorial, we selected Polyhexa cells because they offer the high accuracy of hexahedral cells but are easier to fit onto complex curved blades. We applied heavy mesh refinement near the blade walls to capture the boundary layer physics and the vortex shedding at the tips.
We set up the physics in ANSYS Fluent to handle the rotation using the Sliding Mesh technique. This is the gold standard for VAWT CFD analysis. We defined an inner cylinder zone that rotates physically to match a Tip Speed Ratio (TSR) of 1.4. The inlet wind speed was set to 7 m/s. We ran the Fluent simulation in Transient mode for more than 10 full revolutions. This ensures the flow reaches a stable, periodic state. We used a very small time step to calculate the aerodynamic forces at every degree of rotation. This setup is essential for any accurate Darrieus wind turbine simulation.
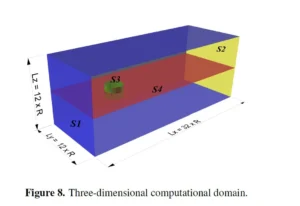
Figure 2: 3D Computational Domain showing the rotating inner zone for the Sliding Mesh and the stationary outer zone for the far-field wind.
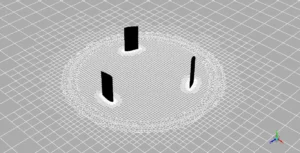
Figure 3: Polyhexa Mesh Grid, utilizing 5 million cells with fine refinement near the walls to capture the boundary layer physics.
Post-processing: Vertical Axis Wind Turbine CFD Analysis of Torque
This section analyzes the results to validate our training model. We compare our calculated torque with the reference paper and examine the 3D flow patterns. First, we validate the results quantitatively using Table 1. The reference paper reports an experimental Average Torque Coefficient (Ct) of 0.107. Our ANSYS Fluent analysis predicted a value of 0.1052. The absolute difference is only 0.0018, representing a remarkably small Relative Error of 1.68%. In CFD engineering, an error below 5% is excellent. This proves that this Vertical Axis Wind Turbine CFD Analysis method is highly accurate and ready for industrial use.
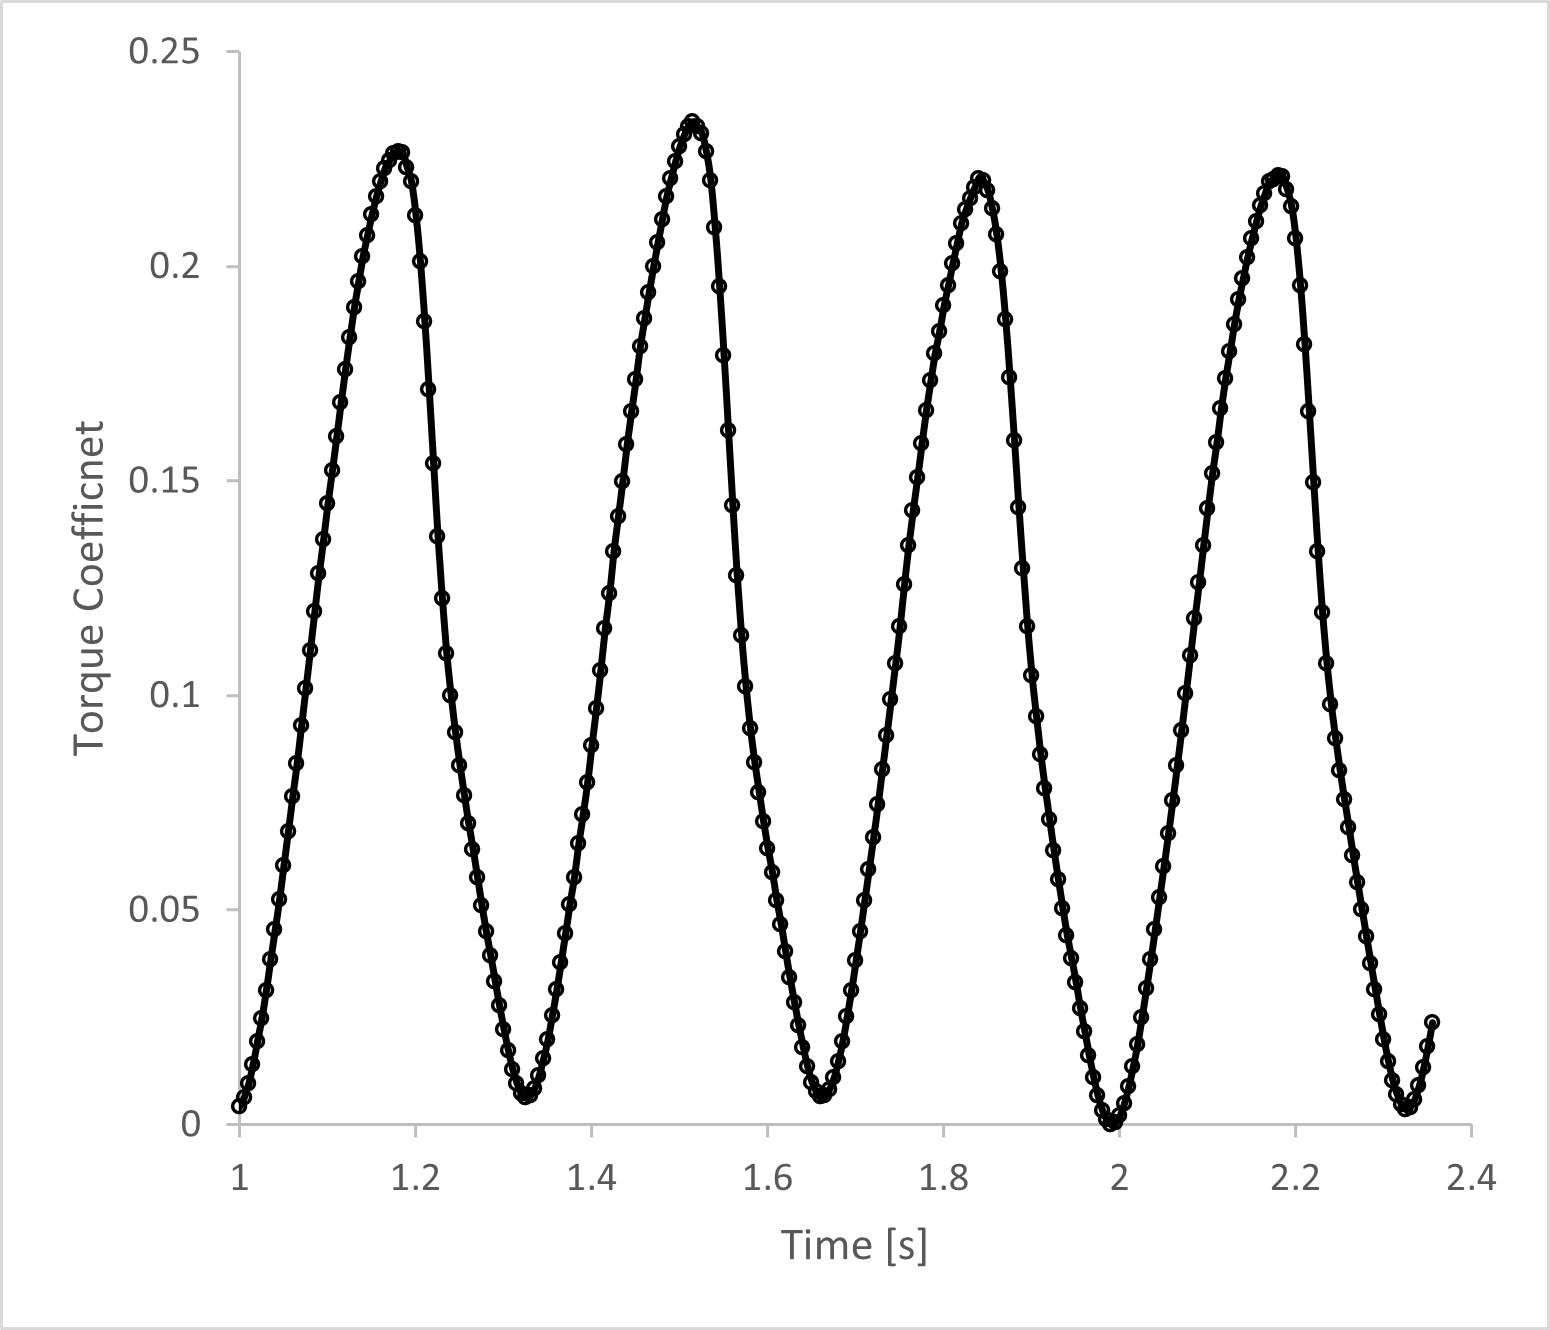
Next, we analyze the Torque History in Figure 4. The graph shows a wave pattern that repeats perfectly. There are three main peaks in every full rotation. This happens because there are three blades. Each time a blade passes the best angle to the wind, the torque goes up. When the blade goes behind the shaft (downwind), the torque drops. The consistency of this wave proves the simulation reached a “periodic steady-state.”
Table 1: Comparison of Average Torque Coefficient.
| Parameter | Reference Paper | Our CFD Simulation | Absolute Difference | Relative Difference |
| Torque Coefficient (Ct) | 0.107 | 0.1052 | 0.0018 | 1.68% |
Next, we analyze the Torque History in Figure 4. The graph shows a wave pattern that repeats perfectly. There are three main peaks in every full rotation, corresponding to the three blades. Each time a blade passes the optimal angle, the torque spikes. When the blade goes downwind behind the shaft, the torque drops. The consistency of this wave proves the Fluent simulation reached a periodic steady-state.
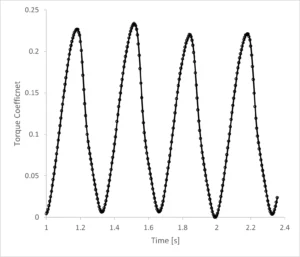
Figure 4: Time history of torque coefficient from the Vertical Axis Wind Turbine CFD Analysis showing the periodic power generation cycle.
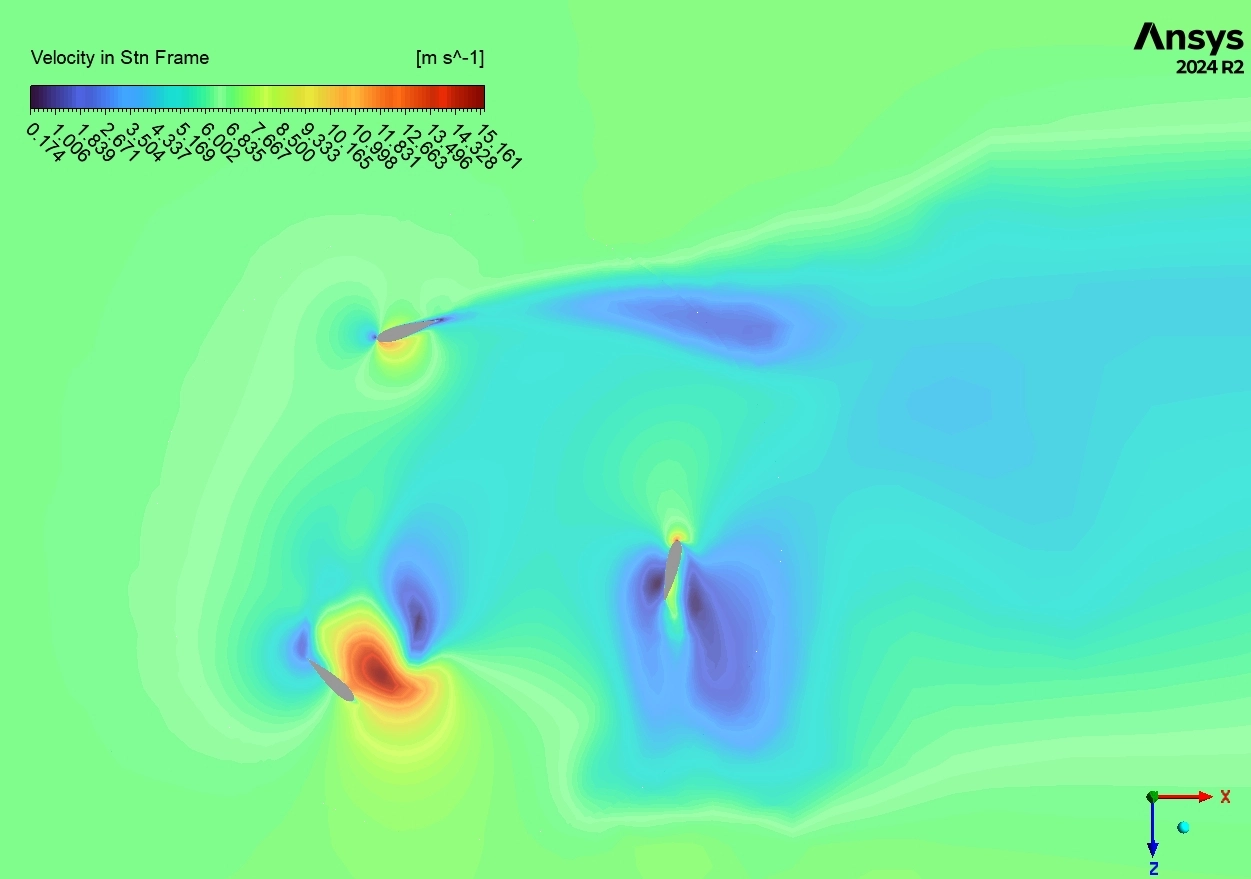
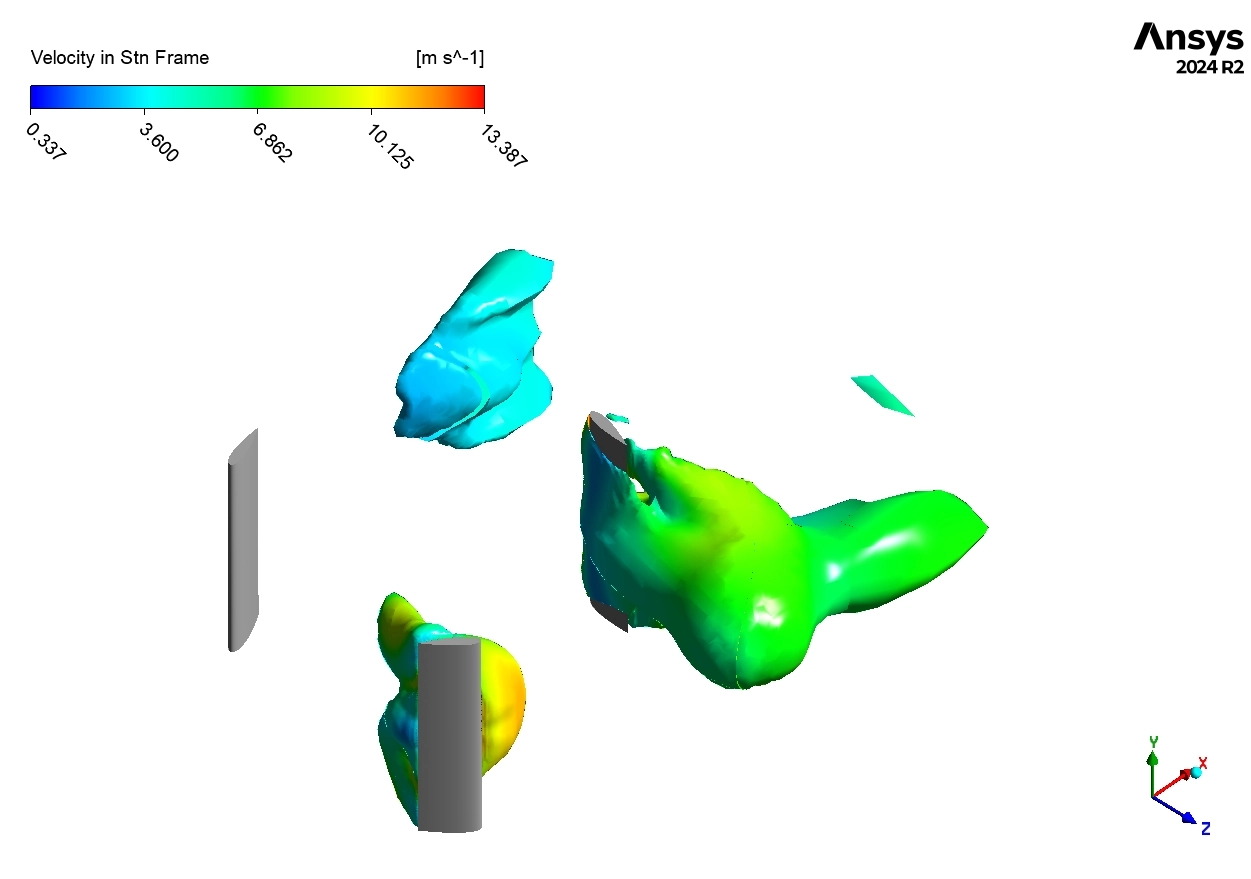
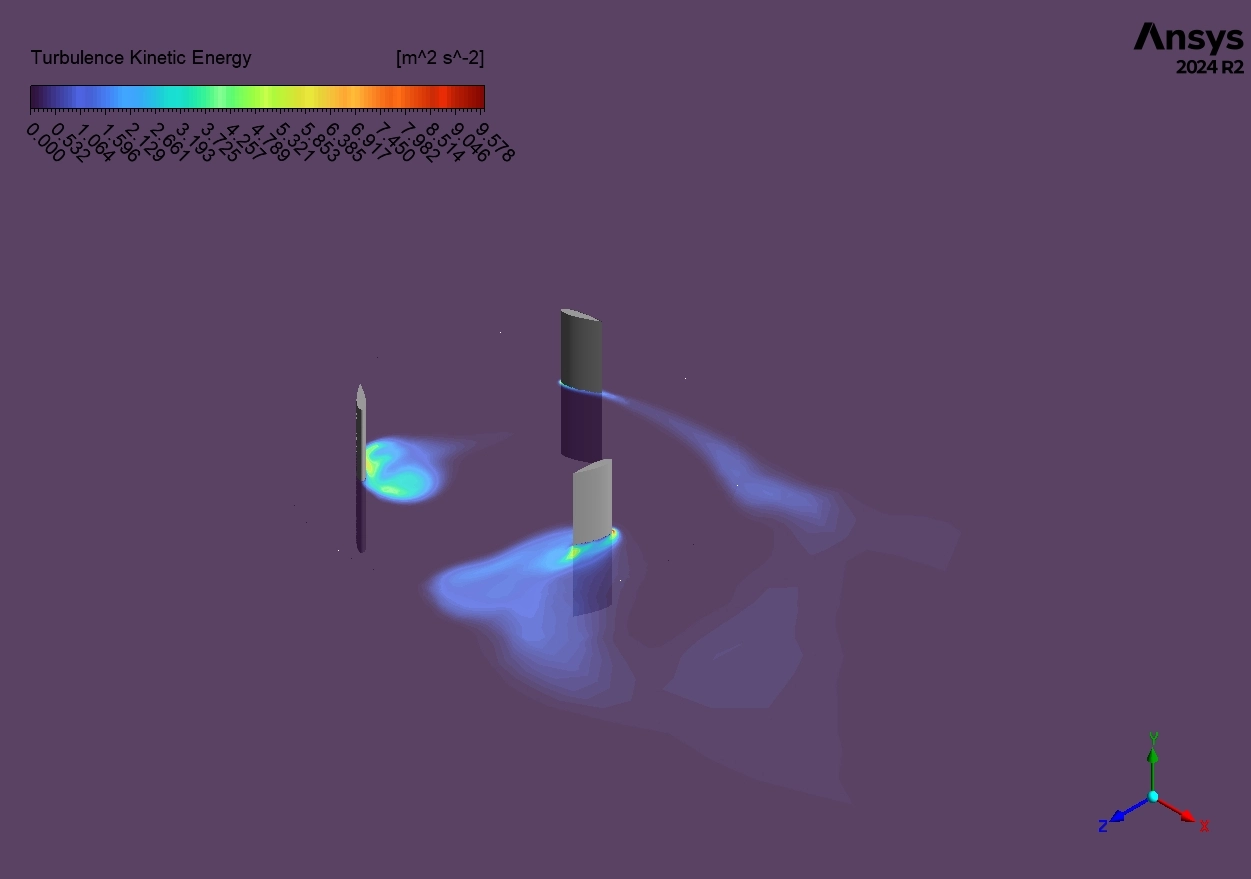
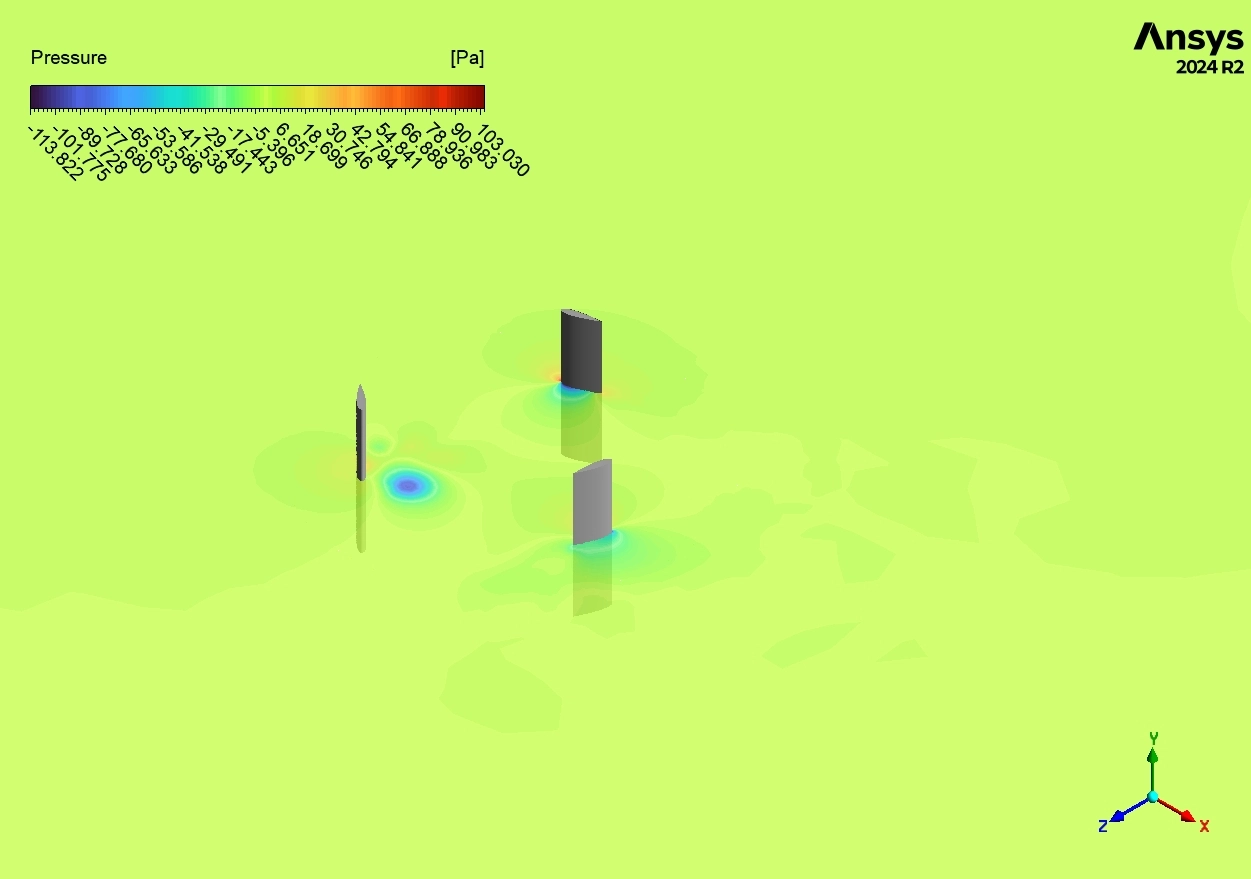
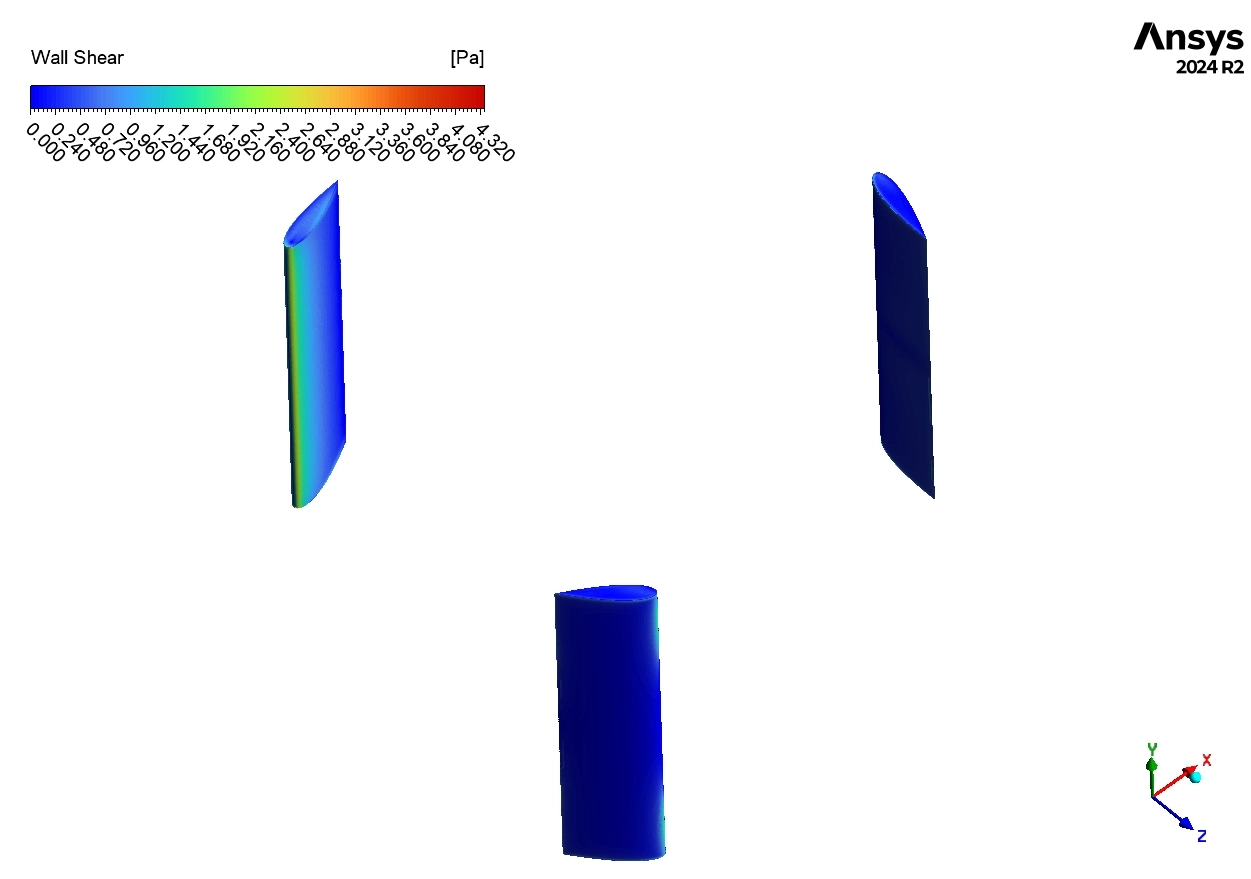
Finally, we look at the Flow Visualization in Figures 5 and 6. Figure 5 shows the velocity on the blades. The upwind blade shows red/yellow colors (high velocity/lift), while the downwind blade is blue, passing through the slow, turbulent wake. Figure 6 uses the Q-Criterion to show the 3D vortices. We clearly see spiral shapes trailing off the blade tips. These Tip Vortices reduce efficiency by creating drag. The fact that our Darrieus CFD simulation captured these complex structures explains why our result (0.1052) was so close to the real physics. This successful validation confirms that you can use this ANSYS Fluent tutorial workflow to optimize your own wind turbine designs.
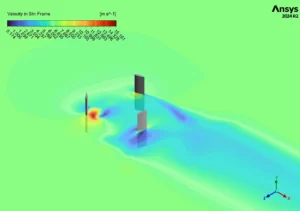
Figure 5: Velocity Magnitude Contours on the turbine blades, highlighting high-speed flow on the leading edges and low-speed wake behind them.
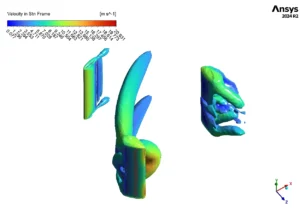
Figure 6: Q-Criterion Isosurfaces colored by velocity, visualizing the complex vortex shedding and wake structures generated by the 3D Darrieus Turbine.


Reviews
There are no reviews yet.