
An Airfoil roughness CFD simulation is a very important tool for engineers who design airplanes and wind turbines. The smooth, curved shape of a wing, or airfoil, is carefully designed to create lift with very little resistance, or drag. However, in the real world, these surfaces are not always perfectly smooth. Roughness can be caused by many things, like ice forming on the wing during flight, insects sticking to the leading edge, or even small scratches and erosion from dust and rain over time. Even a tiny amount of roughness, like the texture of sandpaper, can cause big problems. It disrupts the smooth flow of air, which can dramatically increase drag and reduce the wing’s ability to create lift. This means the airplane needs more fuel to fly, and a wind turbine produces less electricity.
To study this problem, engineers use powerful software like ANSYS Fluent. Specifically for problems involving ice, a specialized module called ANSYS ICING is used. ANSYS ICING CFD is a complete tool that can simulate not just the formation of ice, but also the aerodynamic problems that the resulting rough surface creates. The software allows engineers to create a virtual airfoil and apply a specific level of roughness to its surface. A Roughness effect on Airfoil Fluent simulation can then calculate exactly how this roughness changes the air’s behavior. It can predict the increase in drag and the loss of lift with very high accuracy. This is essential for safety, as engineers must prove that an aircraft can still fly safely even with some ice or contamination on its wings. This virtual testing is much cheaper, faster, and safer than building real wings and testing them in expensive wind tunnels or dangerous real-world icing conditions. For more aerodynamics tutorials, check out here.
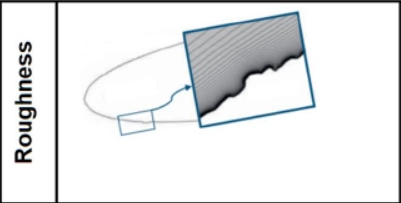
Figure 1: A conceptual image showing how ice accretion can create a rough surface on an airfoil’s leading edge, the subject of this ANSYS ICING CFD analysis.
Simulation process: Fluent-ICING Workflow, Modeling Roughness in a CFD Environment
The simulation process for this Airfoil roughness CFD study started with creating a 3D geometry of a NACA 6409 airfoil. Two separate simulation cases were prepared in the ANSYS ICING environment to allow for a direct comparison. The first case was the clean airfoil, which had a perfectly smooth surface to represent the ideal, as-designed condition. The second case was the roughed airfoil. For this case, a uniform surface roughness of 0.0005 meters (0.5 mm) was applied across the entire airfoil surface. This important setting tells the turbulence model to change its calculations near the wall to account for the tiny bumps, which creates more friction. This 0.5 mm roughness represents a realistic level of contamination from light icing or other operational factors.
Both the clean and rough cases used the exact same setup to make sure the comparison was fair. The simulation was set to model a flight condition with a wind velocity of 102.8 m/s and an angle of attack of 4 degrees. The air temperature was set to 265.6 K (-7.5°C), a realistic temperature for flight at altitude and a condition where icing is a concern. The main goal of the simulation was to precisely calculate the lift and drag forces on both the clean and rough airfoils and to understand why those forces changed by looking at the flow patterns.
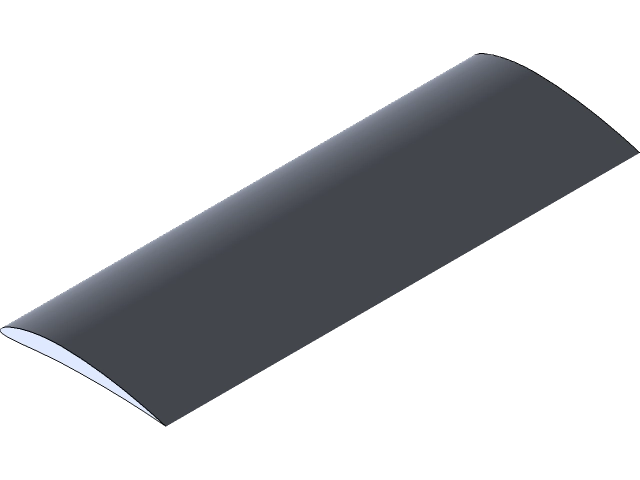
Figure 2: 3D model of the NACA 6409 airfoil used in the CFD simulation
Post-processing: Comparative Aerodynamic Airfoil analysis
The simulation results allow us to conduct a full damage assessment, directly comparing the “healthy” clean airfoil to the “damaged” rough airfoil. We will use the data as evidence to diagnose the performance loss, identify the root cause, and deliver a final engineering verdict. The most direct way to assess the damage is to look at the numbers. The aerodynamic forces calculated by Fluent show a catastrophic loss of performance due to the 0.5 mm of roughness.
Table 1: summary table quantifying the aerodynamic performance degradation caused by 0.5mm of surface roughness, showing a 47.9% increase in drag and a 10.7% decrease in lift.
| Parameter | Clean Airfoil | Roughed Airfoil | Change |
| Drag [N] | 3.5680213 | 5.2763881 | +47.9% |
| Lift [N] | 185.72184 | 165.83146 | -10.7% |
| Lift-to-Drag Ratio | 52.0 | 31.4 | -39.6% |
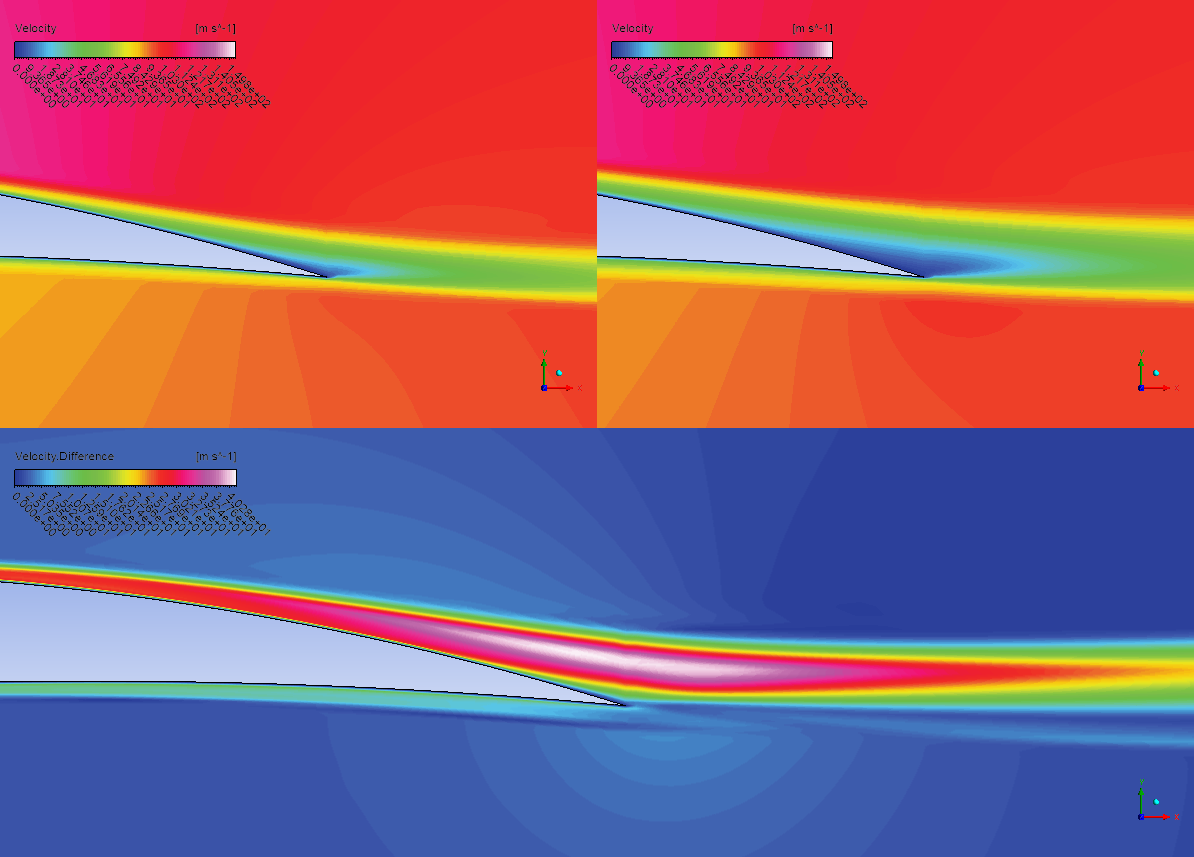
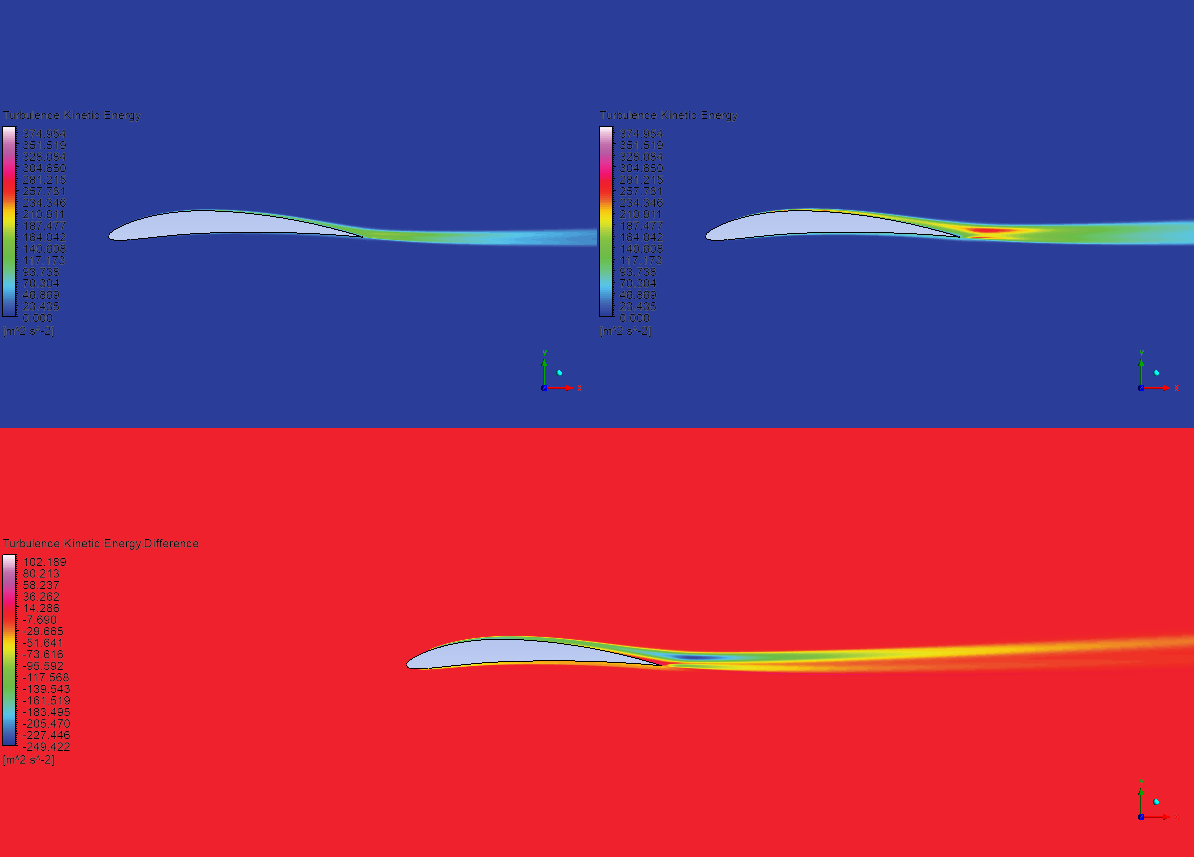
The verdict from this data is clear and severe. The roughness caused the drag to increase by an enormous 47.9% while simultaneously causing the lift to decrease by 10.7%. The Lift-to-Drag ratio, which is the primary measure of an airfoil’s aerodynamic efficiency, has collapsed by nearly 40%. From an engineering standpoint, this is not a small change; it represents a fundamental failure of the airfoil to perform its job efficiently and safely. To understand why the performance collapsed, we must look at the airflow right at the surface. The detailed velocity contours in Figure 3 provides the evidence. The clean airfoil (left) has a very thin, organized, dark-blue layer at the surface, which is a healthy, low-drag laminar boundary layer. In contrast, the roughed airfoil (right) shows a much thicker, more chaotic, and disturbed boundary layer. This is the root cause of the problem. The 0.5 mm roughness elements are like tiny mountains that stick up into the smooth airflow, “tripping” it and forcing it to become turbulent much earlier than it should.
This turbulent flow has much higher friction than smooth flow, which directly causes the massive increase in drag. This process is like rubbing your hand over a smooth tabletop versus rubbing it over rough sandpaper—the sandpaper creates much more friction and heat. The simulation proves that the early transition to turbulence caused by the roughness is the direct physical mechanism responsible for the 47.9% drag penalty.
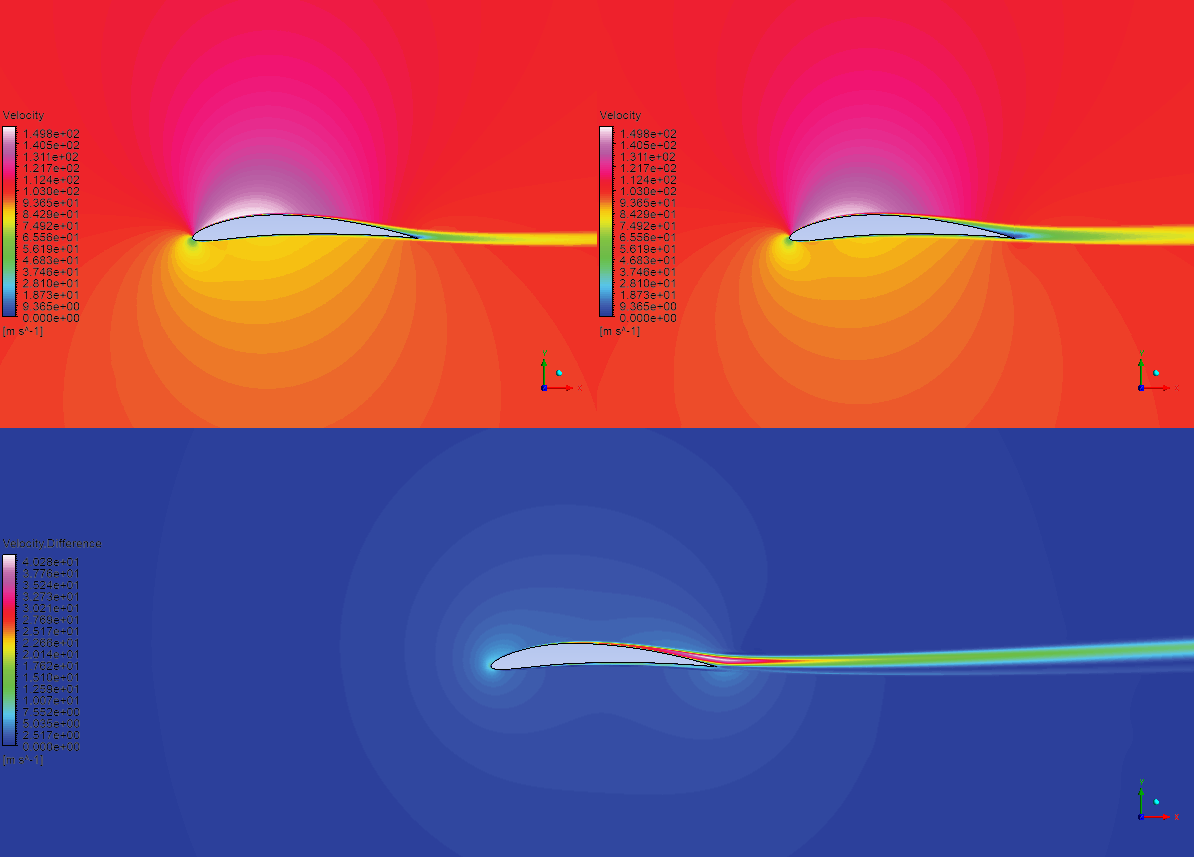
The damage caused at the surface has clear symptoms that we can see in the wider flow field. The overall velocity contours in Figure 2 show that the wake behind the roughed airfoil (top right) is much wider, thicker, and more disturbed than the narrow, clean wake behind the smooth airfoil (top left). This wide wake is like the smoke from a poorly-tuned engine; it is a clear visual sign of wasted energy and high drag.
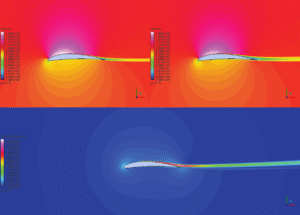
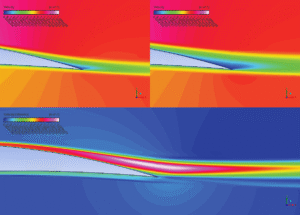
Figure 3: A side-by-side comparison of the velocity magnitude contours for the clean airfoil (top left) and the roughed airfoil (top right). The rough surface clearly creates a wider, more disturbed wake, indicating higher drag.
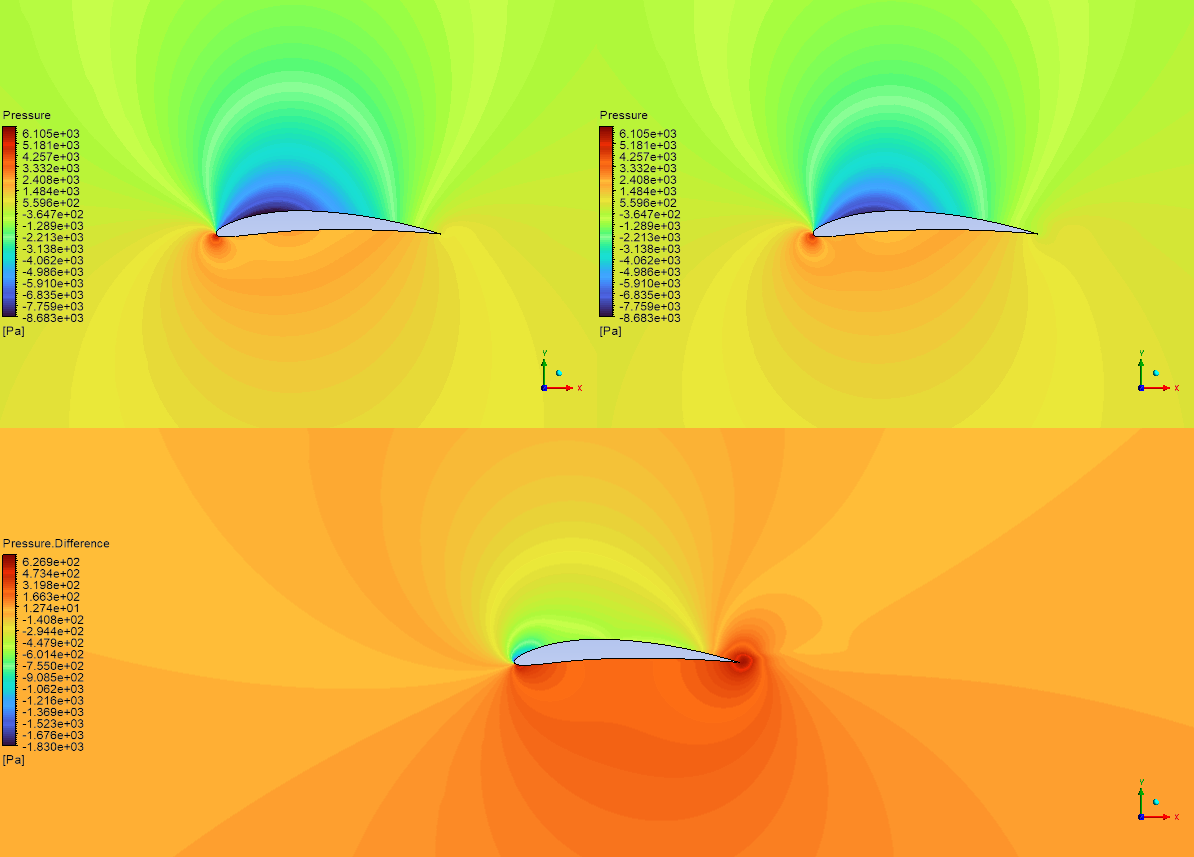
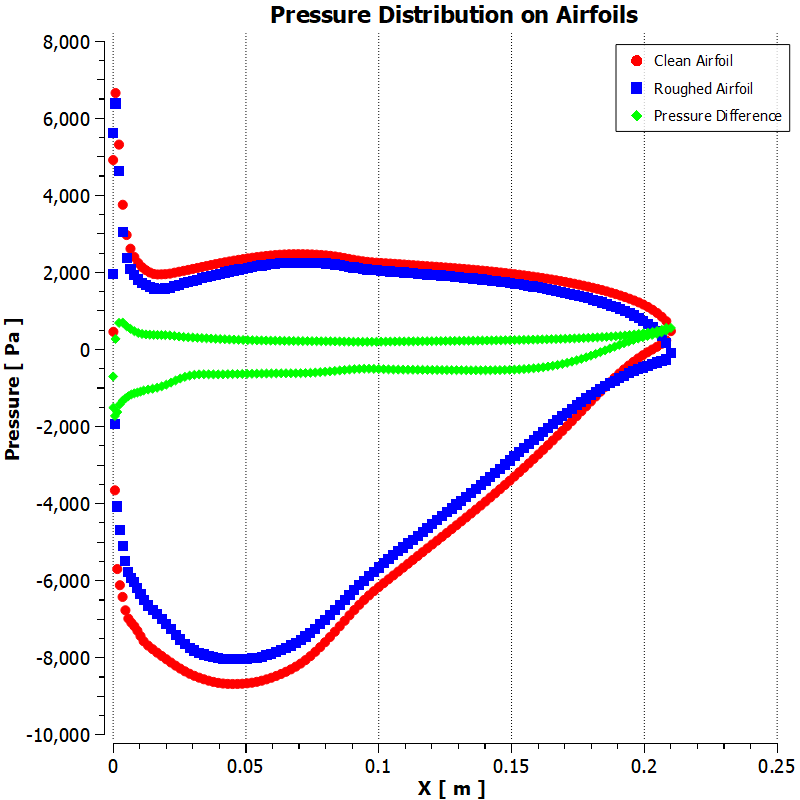
The pressure plot in Figure 4 explains the dangerous loss of lift. An airfoil generates lift by creating a low-pressure zone, or “suction,” on its upper surface. The plot shows that the clean airfoil (red circles) creates a strong peak suction of about -9,000 Pa. However, the rough airfoil (blue squares) can only achieve a much weaker peak suction of about -8,000 Pa. The thickened, chaotic turbulent boundary layer on the rough airfoil is not able to maintain this strong low-pressure zone. This failure to create proper suction is the direct cause of the 10.7% loss in lift force, which reduces the aircraft’s ability to stay in the air.

Figure 4: A pressure distribution graph comparing the clean airfoil (red circles) and the rough airfoil (blue squares). The plot shows that the rough case has reduced suction (less negative pressure) on the upper surface, which is the direct cause of the lift reduction.
Based on this complete and substantiated body of evidence, the final verdict is that 0.5 mm of surface roughness causes a critical and unacceptable level of aerodynamic damage.
For an aircraft designer or manufacturer, this simulation provides invaluable, life-saving intelligence:
- It Justifies Advanced Systems: The simulation provides the hard data needed to justify the cost and weight of sophisticated ice protection systems. It proves that allowing even a small amount of ice roughness to form is not an option.
- It Defines Maintenance Standards: This analysis helps set standards for how clean an aircraft’s wings must be. It shows that performance is highly sensitive to surface condition, reinforcing the need for regular washing and inspection to remove bug residue and dirt.
- It Predicts Long-Term Performance: For wind turbine operators, this type of simulation is crucial for economic planning. It allows them to accurately predict how much energy production will be lost over many years as the turbine blades get eroded and dirty, helping them schedule maintenance and forecast revenue.


Reviews
There are no reviews yet.