
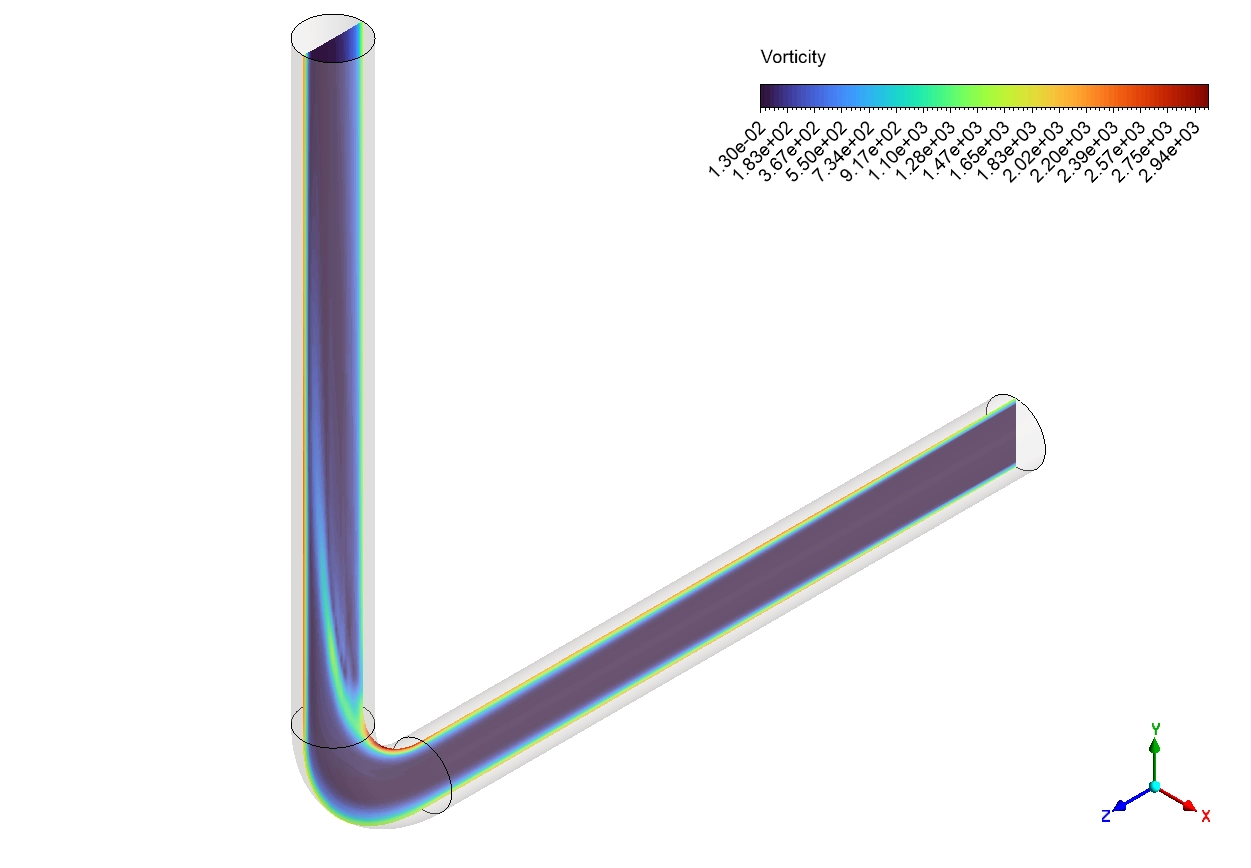
In the petroleum industry, transporting crude oil is a massive challenge because the raw liquid naturally carries thousands of tiny solid sand particles. As this multiphase fluid travels through pipelines, the heavy sand grains strike the metal walls at incredibly high speeds. Over time, this constant physical bombardment scrapes away the solid steel, which is a destructive process known as erosion. If engineers do not predict this material loss accurately, the pipe will become too thin and eventually rupture under high pressure. By performing an exact Erosion In Oil Pipe CFD analysis, designers can clearly see the hidden fluid mechanics and calculate exactly how many millimeters of metal will disappear each year. In this ANSYS Fluent tutorial project, we provide a complete engineering breakdown of how to use professional particle tracking methods to measure pipeline damage. We highly encourage students and engineers to explore our comprehensive DPM tutorials to master advanced multiphase simulations. Obtaining this project provides a perfect computational representation to practice industrial safety calculations.
- Reference [1]: Grant, G., and Widen Tabakoff. “Erosion prediction in turbomachinery resulting from environmental solid particles.” Journal of Aircraft5 (1975): 471-478.
- Reference [2]: Gao, Chao, et al. “Numerical simulation on liquid-solid two-phase erosion characteristics of pipe bends with different bend angles.” Chemical Engineering Research and Design216 (2025): 390-413.
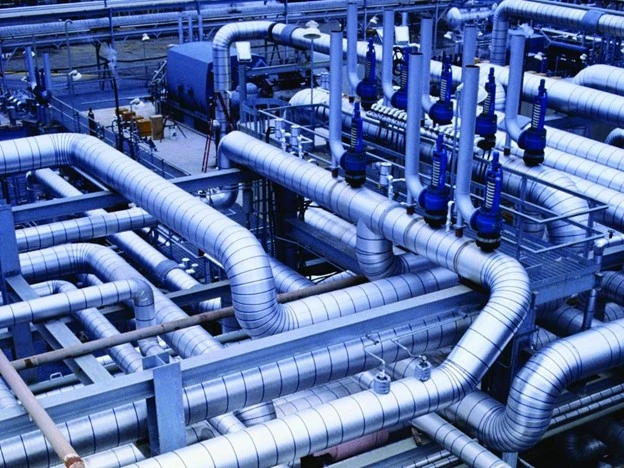
Figure 1: General pipeline in the oil industry, showing the pipes connected by the 90-degree elbow.
Simulation Process: McLaury Erosion Model
To perform this CFD Analysis of Erosion In Oil Pipe, we created an accurate 3D geometry consisting of a straight inlet pipe connected directly to a standard 90-degree elbow. This specific shape is critical for engineering analysis because sudden directional changes in piping systems always experience the most severe physical wear. For the fluid physics, we defined liquid crude oil as the continuous primary phase flowing through the domain. Next, we injected solid quartz-sand grains into the liquid flow. To correctly track the movement of every single particle, we activated the highly searched Discrete Phase Model (DPM) in the ANSYS Fluent software. This mathematical Lagrangian approach perfectly calculates how drag forces, fluid turbulence, and gravity push the sand through the pipeline.
To calculate the exact amount of steel removed from the pipeline walls, we applied the professional McLaury erosion model. This specific equation is highly reliable for predicting wear in carbon steel. We defined the exact parameters based on published scientific facts. Furthermore, the software calculates the exact angle at which the particles hit the wall. To make this calculation perfectly precise, we extract all tangential and normal forces based on valid references. When the sand strikes the ductile steel, the cutting and plowing forces remove the maximum amount of metal. The software mathematically adds up all these microscopic collisions to give us the final erosion rate.
Post-processing: Analysis of Particle Velocity and Wall Damage
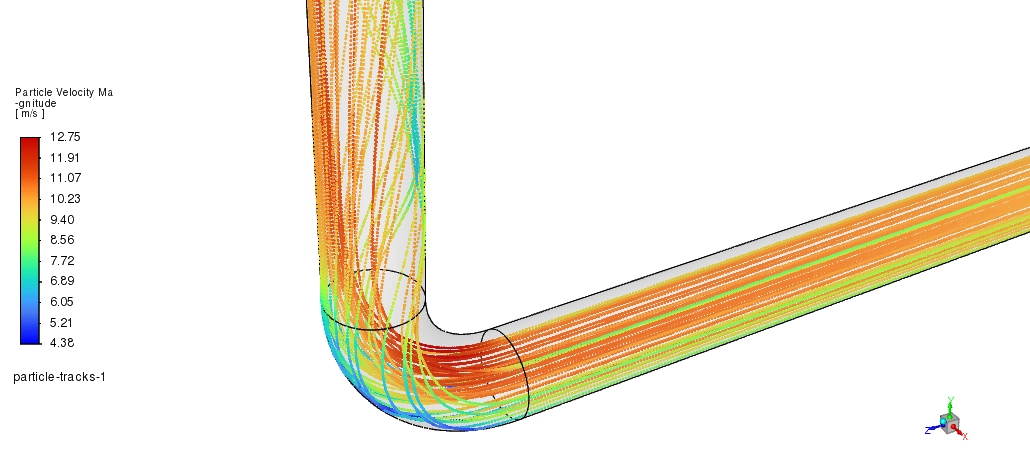
Let us carefully evaluate the visual contours and exact extracted data to deeply understand how the pipeline breaks. First, we must look at the particle trajectories colored by velocity. The crude oil and sand enter the vertical straight pipe at a safe, uniform speed of 4.36 to 6.89 m/s. In this straight area, the sand grains travel perfectly parallel to the pipeline walls. Because the solid particles do not hit the metal directly, the wall wear is almost zero, showing a dark purple color on the contours.
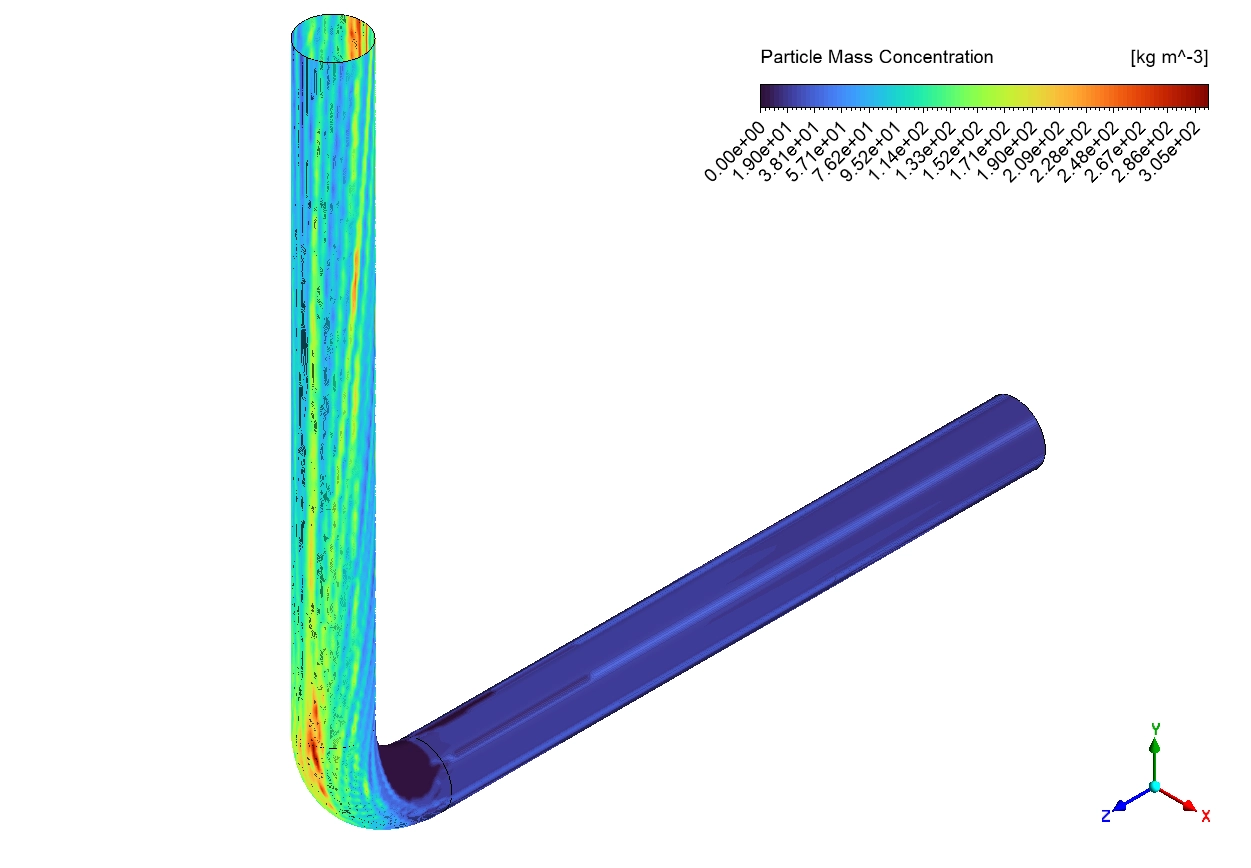
However, the flow physics change completely when the fluid reaches the 90-degree elbow. The liquid oil easily bends around the corner, but the heavy sand particles possess too much physical momentum to make the sharp turn. Consequently, strong centrifugal forces push the sand forcefully toward the outer wall of the elbow. The particle tracks show the sand accelerating to a severe maximum velocity of 10.23 to 12.75 m/s. This creates a very concentrated, high-speed jet of sand that violently bombards a small area on the outer bend.
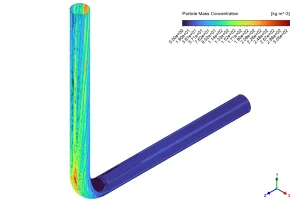
Figure 2: Particle mass concentration contours, clearly illustrating how centrifugal forces push the heavy sand to accumulate heavily at the outer curve.
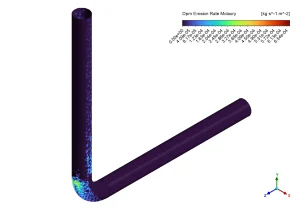
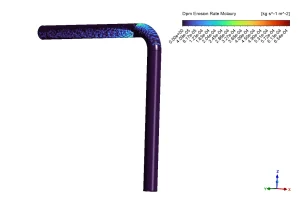
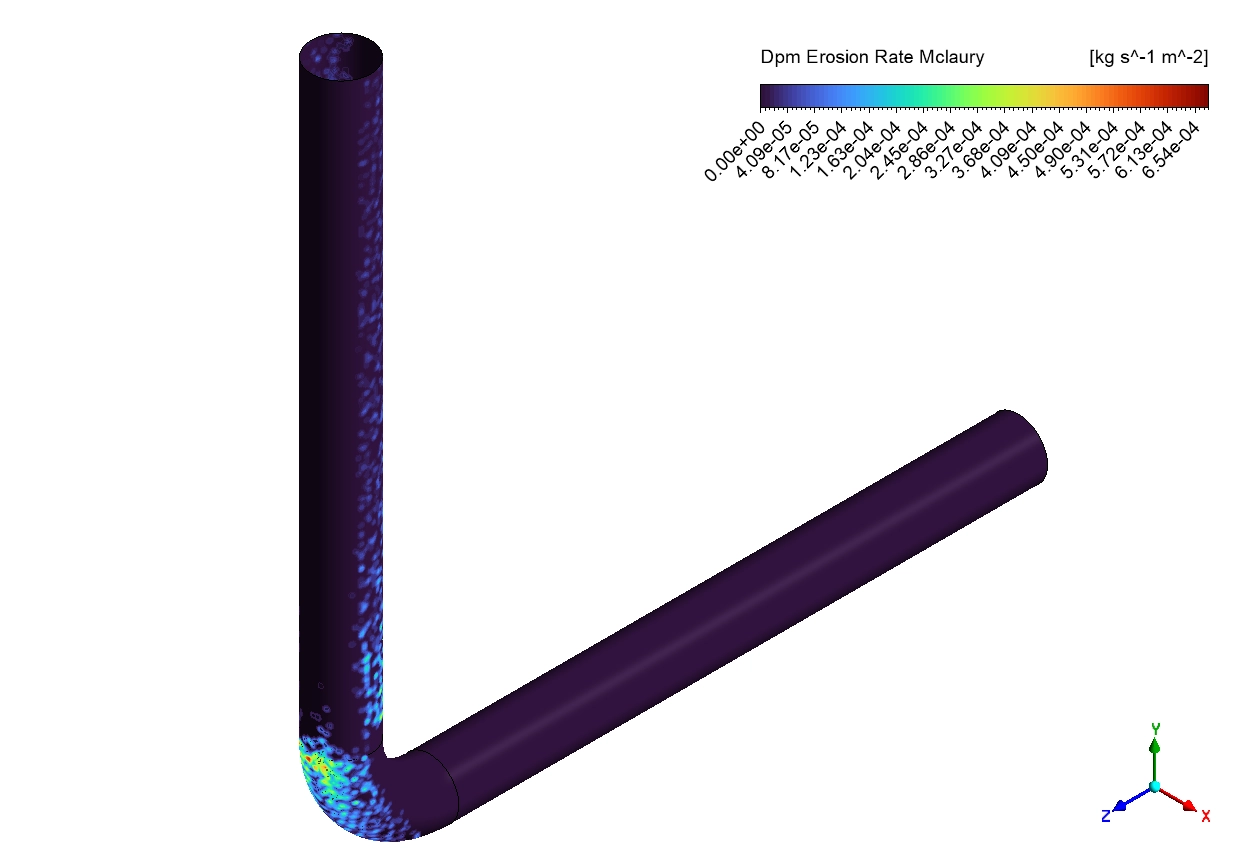
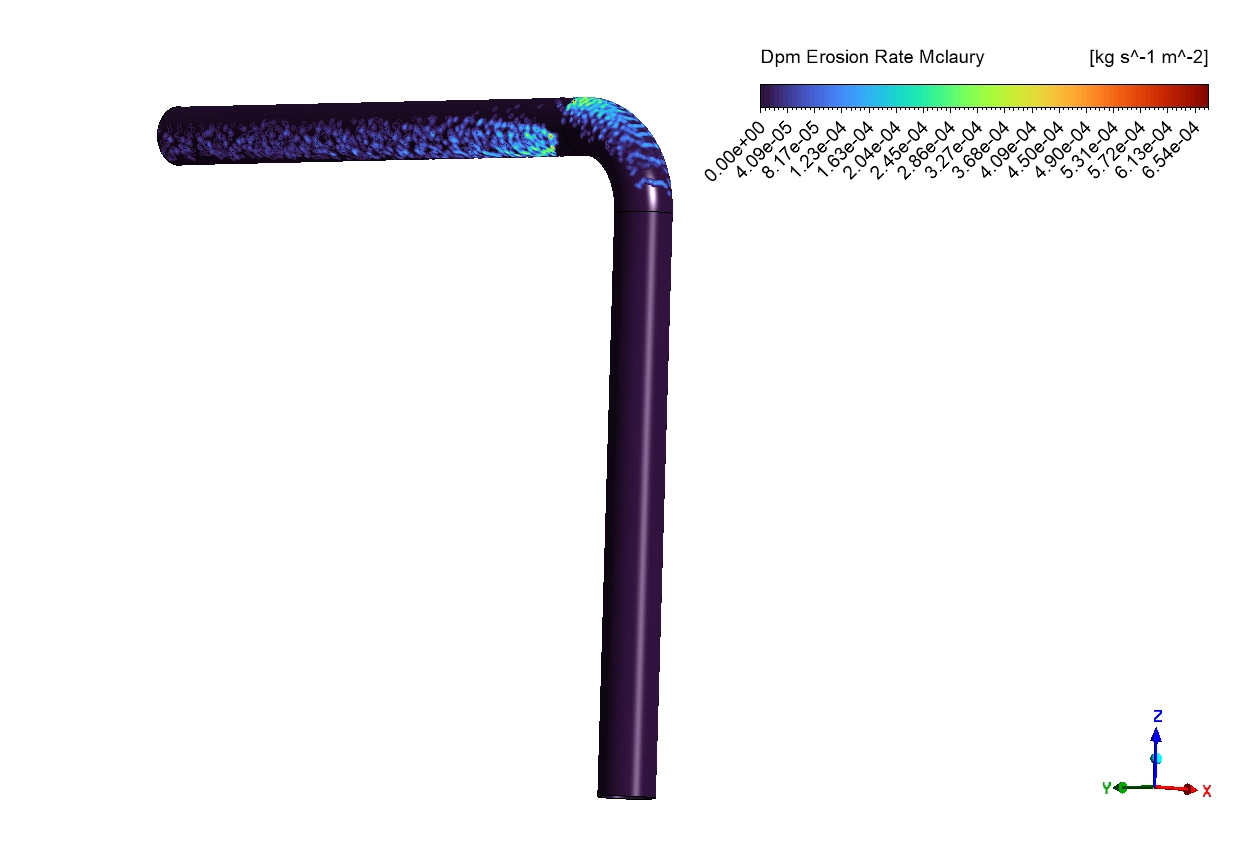
Figure 3: DPM Erosion Rate McLaury contours, highlighting the exact red hotspot where the vertex maximum material loss occurs.
The DPM Erosion Rate McLaury contours visually prove this exact damage. We can observe a bright red hotspot covering about 15 to 25 percent of the outer elbow radius. Based on the exact mathematical calculation, the software reports a Vertex Maximum erosion rate of exactly 0.00065945555 kg/(m² s) right at the wall_elbow boundary. To make this number useful for industrial engineers, we divide this mass loss by the density of carbon steel. This simple math converts the data into a physical depth loss of 2.65 mm/year. Because a standard oil pipe is usually 10 to 15 millimeters thick, this severe material loss means the pipe will become dangerously thin and burst in less than four to six years. Therefore, this accurate ANSYS Fluent simulation proves that engineers must apply thicker steel or hard protective coatings exactly at the outer curve of the elbow to prevent a catastrophic oil spill.
Table 1: Exact Extracted Maximum Erosion Data
| Pipeline Surface Location | Vertex Maximum [kg/(m². s)] | Annual Wear Rate [mm/year] |
| wall_elbow | 0.00065945555 | 2.65 |
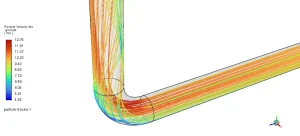
Figure 4: Particle tracks colored by velocity, visualizing the sand particles accelerating up to 12.75 m/s before impacting the outer wall of the bend.
Frequently Asked Questions (FAQ)
- What is the McLaury erosion model in ANSYS Fluent?
- The McLaury model is a scientific formula used to calculate how much metal is destroyed when solid particles hit a surface. It accurately uses the speed of the sand, the angle of the impact, and the hardness of the steel to predict the exact material loss.
- Why does the sand cause so much damage at the pipeline elbow?
- In a straight pipe, the sand flows safely in the center. When the pipe turns 90 degrees, centrifugal forces throw the heavy sand outward. The particles hit the outer wall at a very high speed and at a damaging angle, which cuts the metal rapidly.
- How do engineers use the 2.65 mm/year erosion data?
- Engineers use this exact number to plan their safety schedules. If they know the pipeline loses 2.65 millimeters of thickness every year, they can calculate exactly when the pipe will break. They can then replace the elbow or add thicker coatings before an accident happens.




Reviews
There are no reviews yet.