


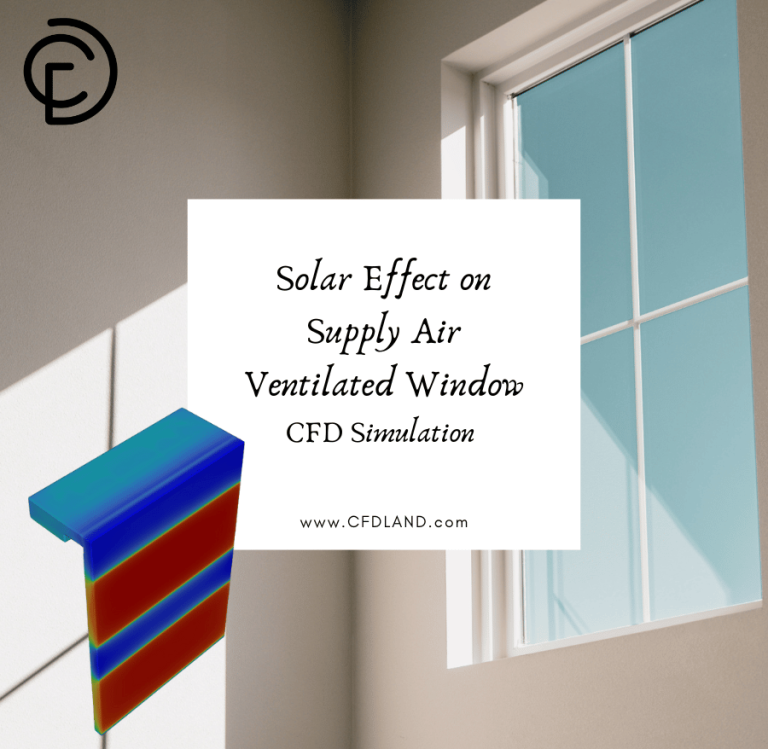
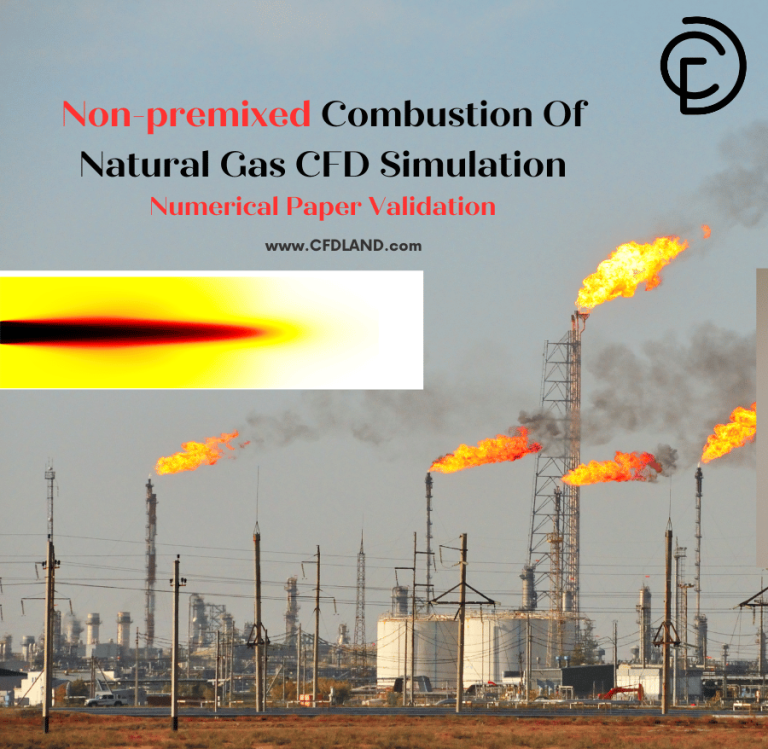
Every day, large oil refineries and gas plants produce extra waste gas. They cannot just release this raw gas into the sky because it is highly poisonous to humans and nature. Instead, they use a giant vertical pipe called a gas flare to burn the waste away. However, if this fire is uncontrolled, it creates heavy black smoke and toxic nitrogen pollution. To solve this exact problem, engineers invented the coflow burner. This special design blows a steady blanket of extra fresh air around the main fuel jet to ensure the fire burns clean and safe.
Understanding how to control this massive fire is very difficult. Engineers cannot put cameras or sensors directly inside a violently hot flame to see the pollution forming. Because of this, we must use computers. By exploring professional combustion CFD simulation projects, engineers can learn exactly how to predict and stop toxic gases before they are ever created in the real world.
In this ANSYS Fluent tutorial, we will provide a very rich and deep explanation of the exact physics inside the flame. We will look at how the fuel moves, how hot it gets, and exactly where the toxic smoke is born. This will entice you to master fluid dynamics and protect the environment.
- Reference [1]: Ahsan, Abbas, et al. “Quantifying the carbon conversion efficiency and emission indices of a lab-scale natural gas flare with internal coflows of air or steam.” Experimental Thermal and Fluid Science103 (2019): 133-142.
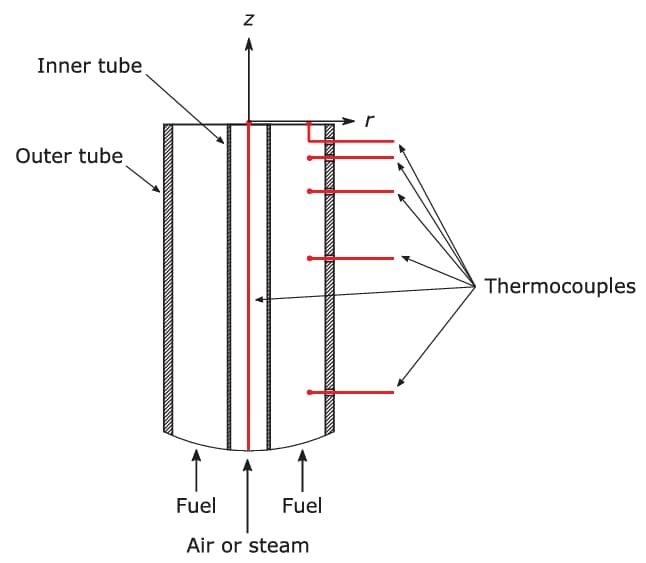
Figure 1:Coflow Burner exit schematic [1].
Simulation Process: Advanced Emissions and Combustion Modules
Before we strat working on solver settings, we must create the cylindrical combustion chamber with a fuel injector. The computational domain was divided into proper blocks to generate a fully structured grid using 1,156,375 hexahedral cells via ANSYS Meshing.
To build this precise simulation, we set the air-fuel gas Mass Flow Ratio(MFR) to exactly 5. This means we pump five times more air mass than fuel mass into the burner. Then, we activate several advanced physics modules. First, we turn on the Non-premixed combustion module. We pair this with a steady diffusion flamelet model and a Chemkin chemical tool. We use these specific tools because the fuel and air enter the chamber from completely different pipes. They must hit each other and mix at the exact same time they catch fire. These modules calculate that exact fast chemical mixing.
Second, we must track the dangerous toxic gases. We activate the NOx formation module. We turn on three specific pathways: Thermal, Prompt, and N2O intermediates. This mathematical tool calculates exactly how extreme heat and unburned fuel force the safe nitrogen in the air to turn into toxic pollution. Finally, we use the Moss-Brookes soot model. We use this specific module because it perfectly calculates how unburned carbon pieces stick together to turn into solid black smoke particles inside the fire.
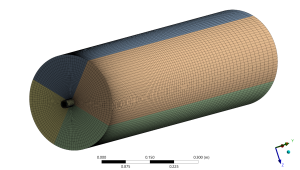
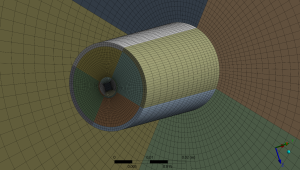
Figure 2: 1,156,375 hexahedral cells generated in combustion chamber and in nozzle region
Post-processing: Deep Physics of Flow, Heat, and Emissions
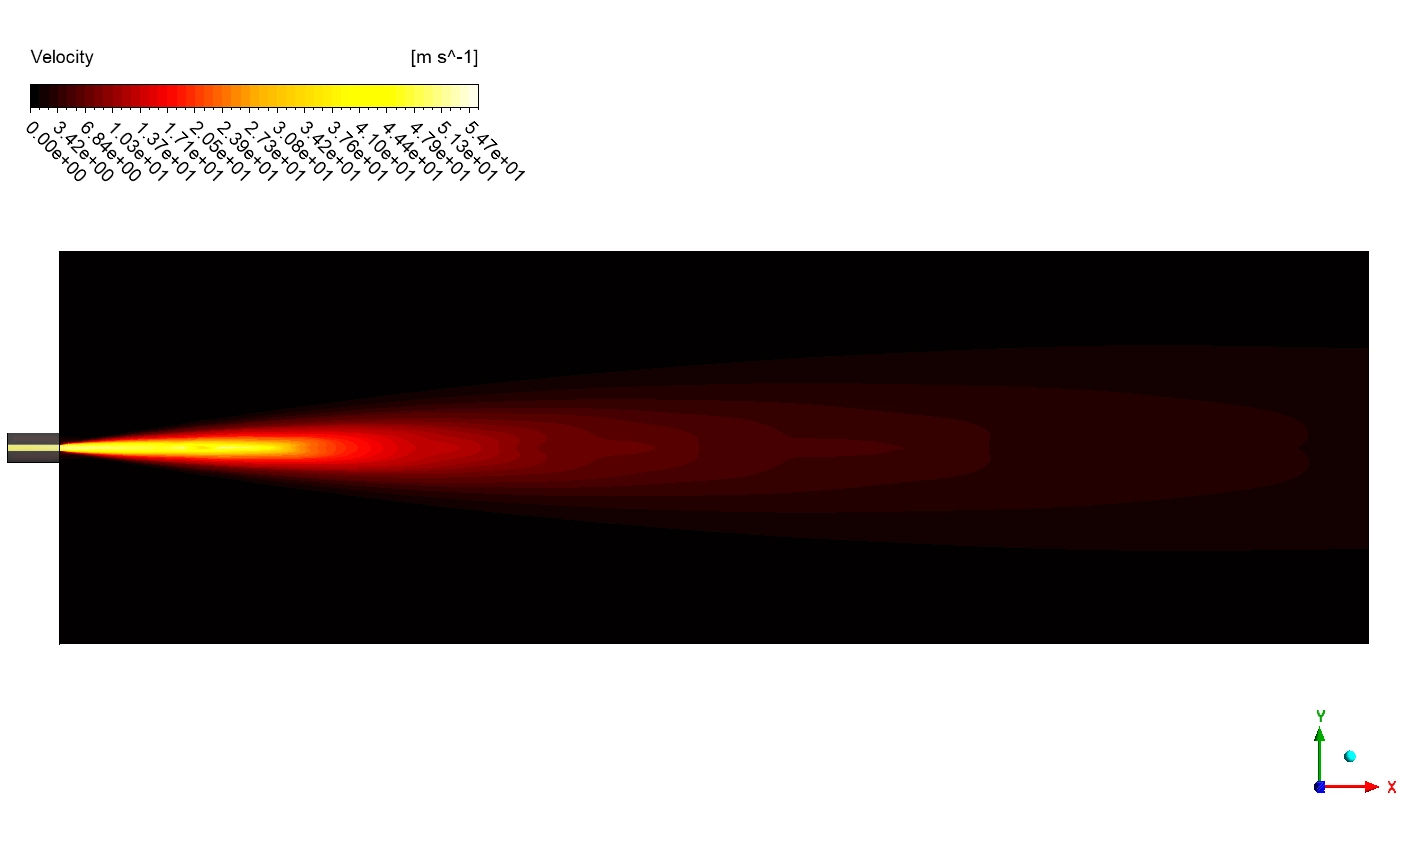
Now we will analyze the visual data very closely. We will not miss any details. We will learn exactly how fast the gas moves, where the heat is strongest, and where the three different types of toxic pollution are created. First, we look at the new Velocity contour to understand the exact fluid speed. The legend proves the gas shoots out of the central nozzle incredibly fast. The maximum Velocity reaches exactly 5.47e+01 [m s^-1]. This super-fast core is colored bright white and yellow. The coflow air around it is black, meaning it moves very slowly. When the fast fuel jet hits the slow air, huge friction happens. This strong friction rips the fuel jet apart and forces it to mix violently with the oxygen. As it travels down the long chamber, the jet slows down. The bright color changes to deep red. Finally, because of the high Mass Flow Ratio of 5, the heavy air absorbs the jet’s energy, and the gas leaves the pipe at a safe, slow Velocity of exactly 1.175 [m/s].

Figure 3: The Velocity contour proving the central fuel jet enters at exactly 54.7 [m s^-1] before slowing down and mixing with the coflow air.
As the fast gas mixes, it burns. The Temperature contour shows the heat ranging from a cold start to an extreme maximum. The fuel enters cold, but as it mixes with the coflow air, it ignites. A massive, bright yellow core forms in the center of the chamber. The exact numerical data proves this flame reaches a maximum Temperature of exactly 2005 C inside the fluid zone. As the hot gas travels to the exit, the extra coflow air cools it down to an average outlet Temperature of exactly 228.39 [C].
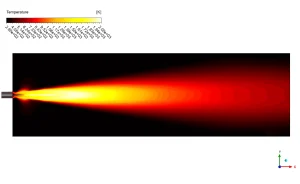
Figure 4: The Temperature contour showing the large, stable flame shape reaching a maximum heat
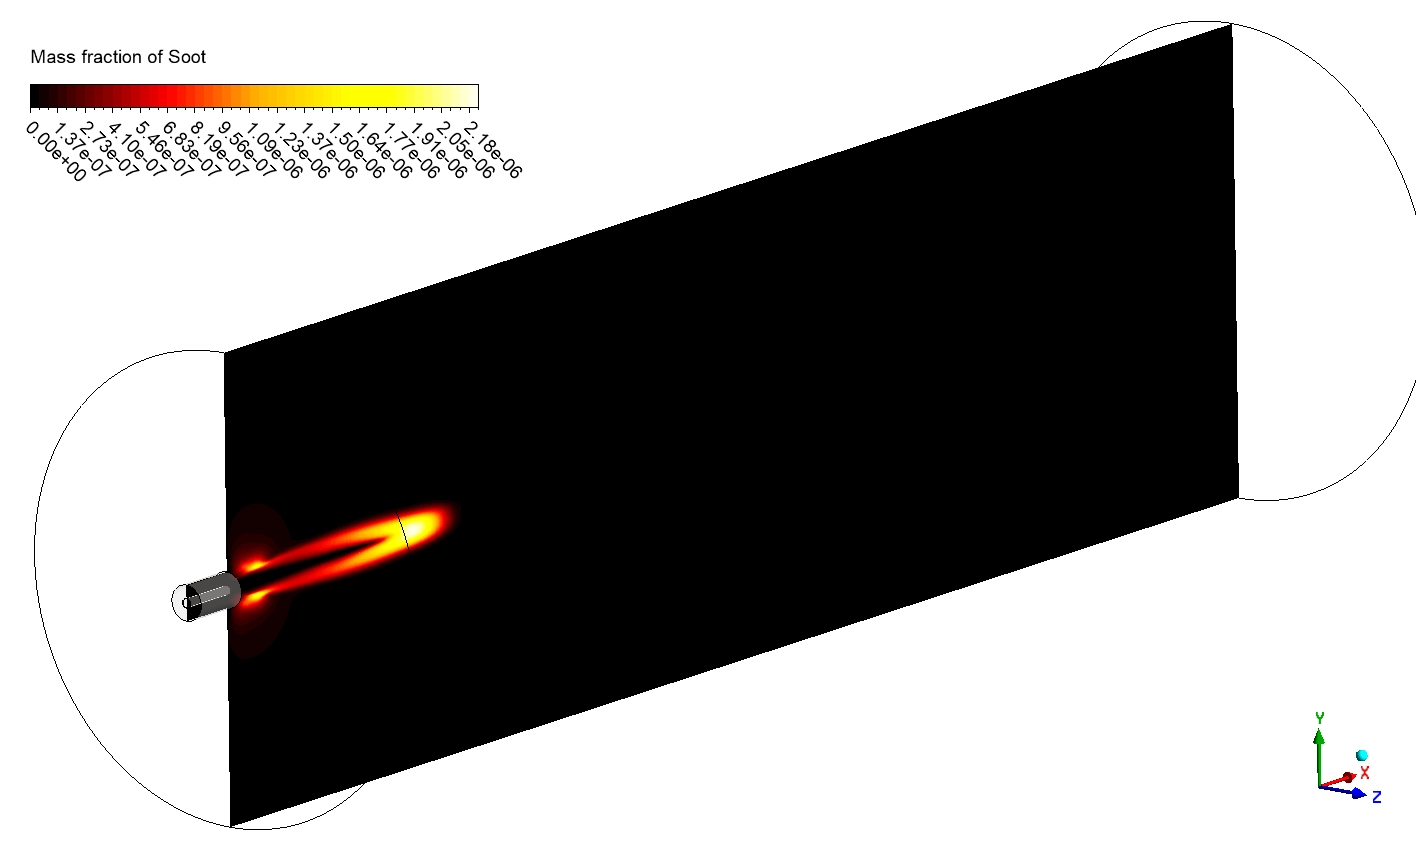
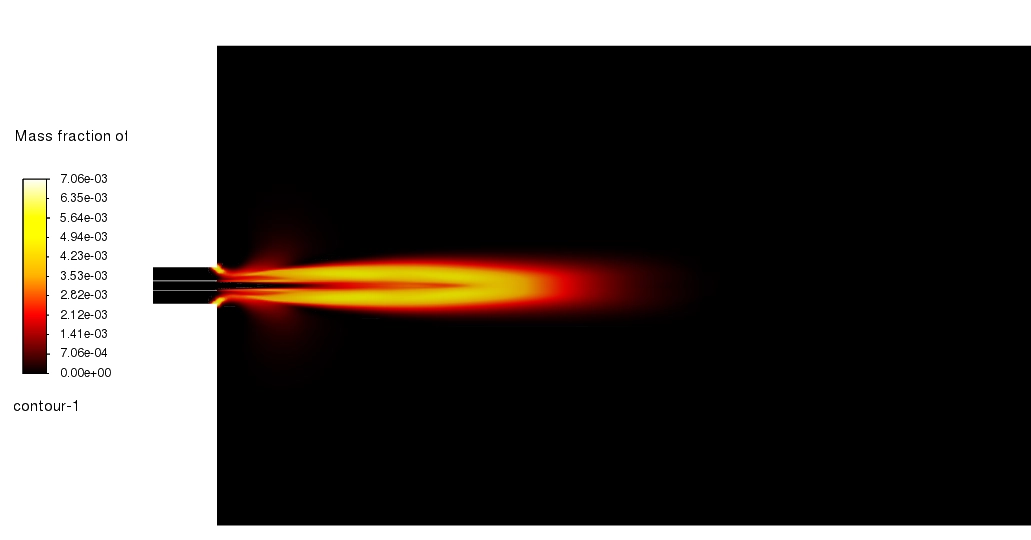
Next, we study the Mass fraction of Soot contour. The solid black smoke forms in a very sharp, hollow V-shape near the nozzle. It does not form in the center of the fire. This happens because soot needs high heat but zero oxygen to survive. It forms right at the rich boundary layer where the fuel is too thick. As the soot travels down the chamber, it finally mixes with the extra coflow air and burns away cleanly.
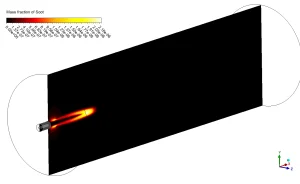
Figure 5: The Mass fraction of Soot contour proving that black smoke forms in the rich, low-oxygen boundary layers near the nozzle.
Finally, we examine how the toxic nitrogen gases form. The physics for each pathway is completely different:
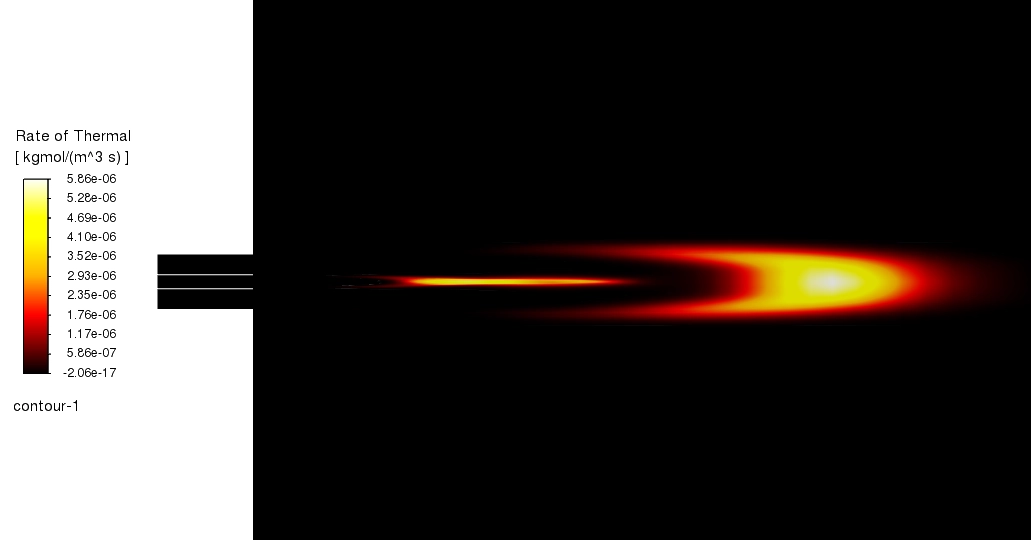
- Thermal NOx: The extreme heat of the fire actually burns the nitrogen in the air. The contour proves the maximum Rate of Thermal NOx reaches 5.86e-06 [kgmol/(m^3 s)]. This toxic gas only forms in the very center of the bright yellow flame core, proving it requires the absolute highest Temperature to exist.
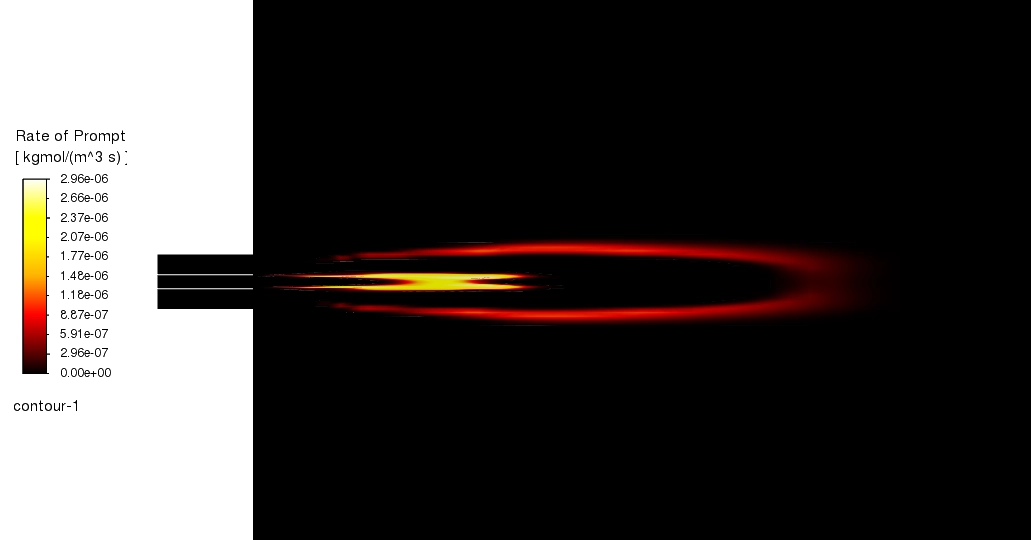
- Prompt NOx: This forms at a maximum rate of 2.96e-06 [kgmol/(m^3 s)]. Unlike the thermal gas, the contour shows two distinct bright lines near the nozzle. This happens because Prompt NOx forms at the very edge of the fuel jet, where unburned fuel reacts directly with nitrogen before the oxygen can reach it.
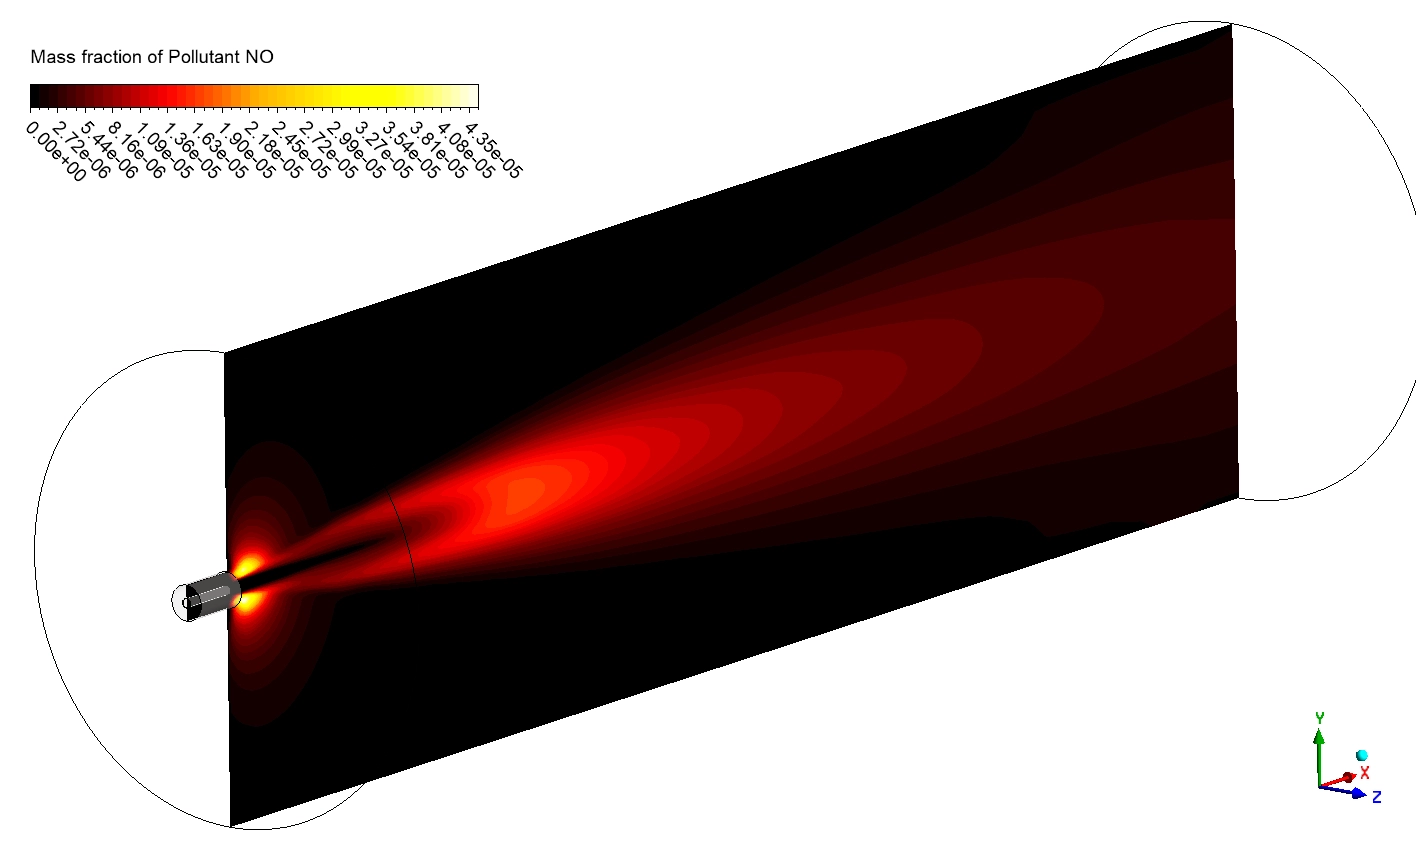
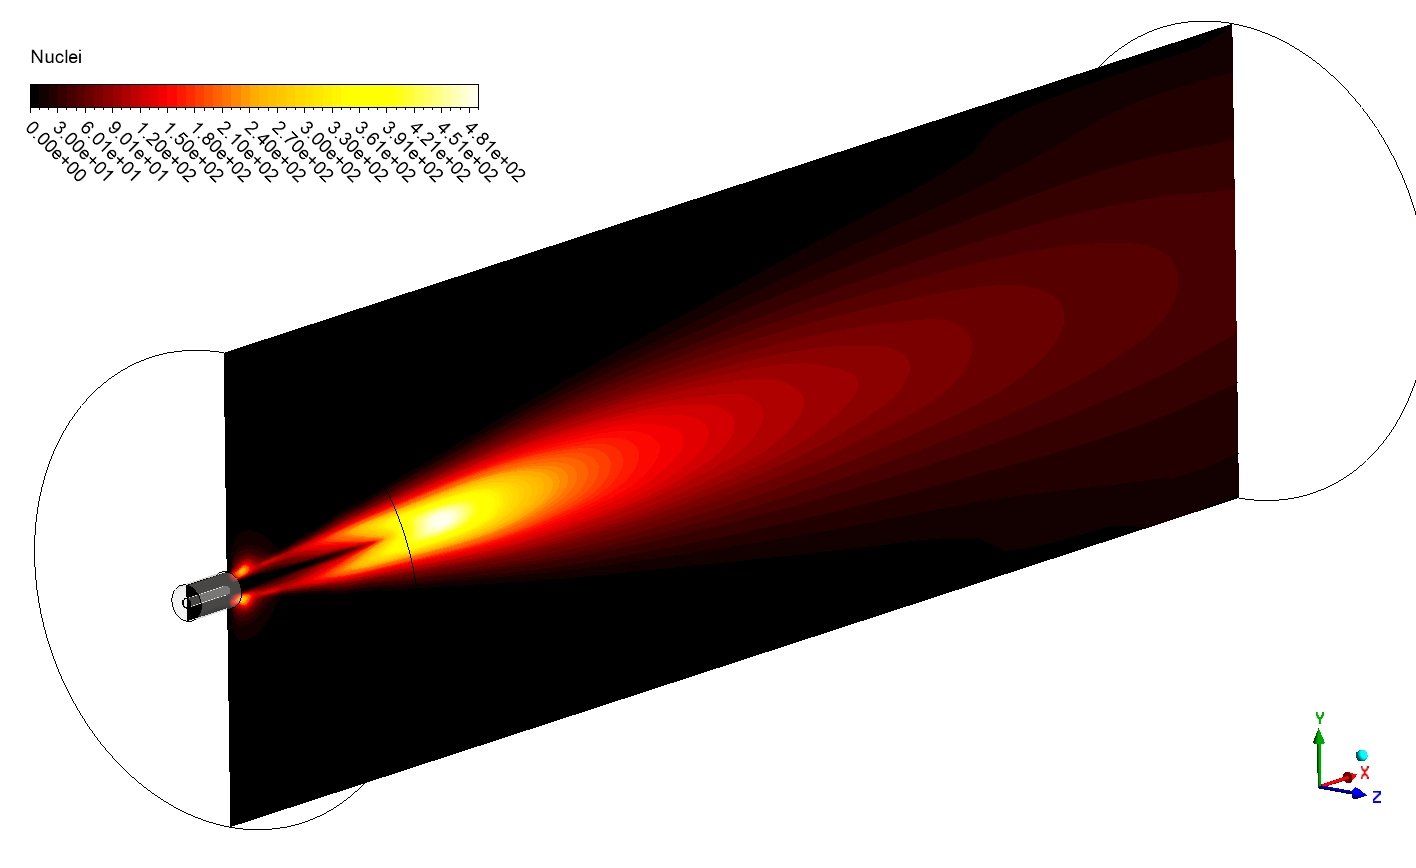
- N2O Intermediate NOx: We look at the new Rate of N2OPath no contour. The legend shows a maximum rate of exactly 7.65e-08 [kgmol/(m^3 s)]. Look at the unique shape. It forms a long, hollow shape that glows bright yellow and white far downstream from the nozzle. This happens because the N2O intermediates pathway dominates in areas where the fire has a lot of extra air but slightly lower heat. The heavy coflow air pushes into the flame downstream, creating this exact glowing pollution zone before the gas exits.

Figure 6: The Rate of Thermal NOx contour showing the highest toxic gas creation exactly inside the hottest central flame core.
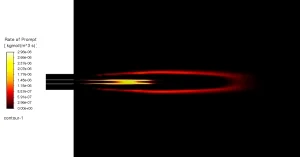
Figure 7: The Rate of Prompt NOx contour showing toxic nitrogen formation directly at the outer edge of the cold fuel jet.
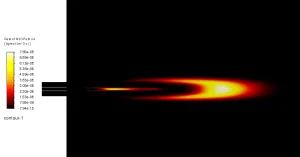
Figure 8: The Rate of N2OPath no contour showing a maximum of 7.65e-08 [kgmol/(m^3 s)] forming in the cooler, fuel-lean downstream regions.
The table below shows the exact flow and thermal results calculated at the domain boundaries.
| Parameter | Value | Unit |
| Max Temperature | 1813.19 | [C] |
| Outlet Temperature | 228.39 | [C] |
| Outlet Velocity | 1.17 | [m/s] |
Frequently Asked Questions (FAQ)
- What is a coflow burner?
- A coflow burner is a device that blows a wide, slow stream of extra air around a fast central jet of fuel. This extra air surrounds the fuel perfectly, helping it to mix well and burn smoothly without making dirty smoke.
- Why does N2O intermediate NOx form further downstream?
- Unlike Thermal NOx, which needs extreme peak heat, the N2O intermediates pathway creates pollution in areas that are slightly cooler but have a lot of extra oxygen. This exact environment happens downstream where the coflow air finally swallows the dying flame.
- Why do we use the Moss-Brookes soot model?
- We use this advanced model because it mathematically tracks how tiny unburned fuel particles combine together to form heavy, solid black smoke. It is the absolute best tool for calculating visible pollution in gas fires.


Reviews
There are no reviews yet.