

Liquid ejectors mix fluids without using any moving parts. They use a very fast jet of water to pull in air. This pulling action is called suction. However, there is a major engineering problem. If the internal metal shape is wrong, the water crashes into the solid walls. The flow chokes, the pressure fails, and the suction stops completely.
In this guide, we will solve this exact problem. We will use the ANSYS Direct Optimization tool to fix a failing design. This smart software will automatically test hundreds of different geometric shapes. It will calculate the perfect angles and widths to maximize the air suction safely. If you want to master these mixed fluid physics, checking out our multiphase tutorials is your next best step. Today, you will see exactly how morphing the physical shape controls the fluid speed and creates a massive vacuum.
- Reference: Yadav, Randheer L., and Ashwin W. Patwardhan. “Design aspects of ejectors: Effects of suction chamber geometry.” Chemical Engineering Science15 (2008): 3886-3897.
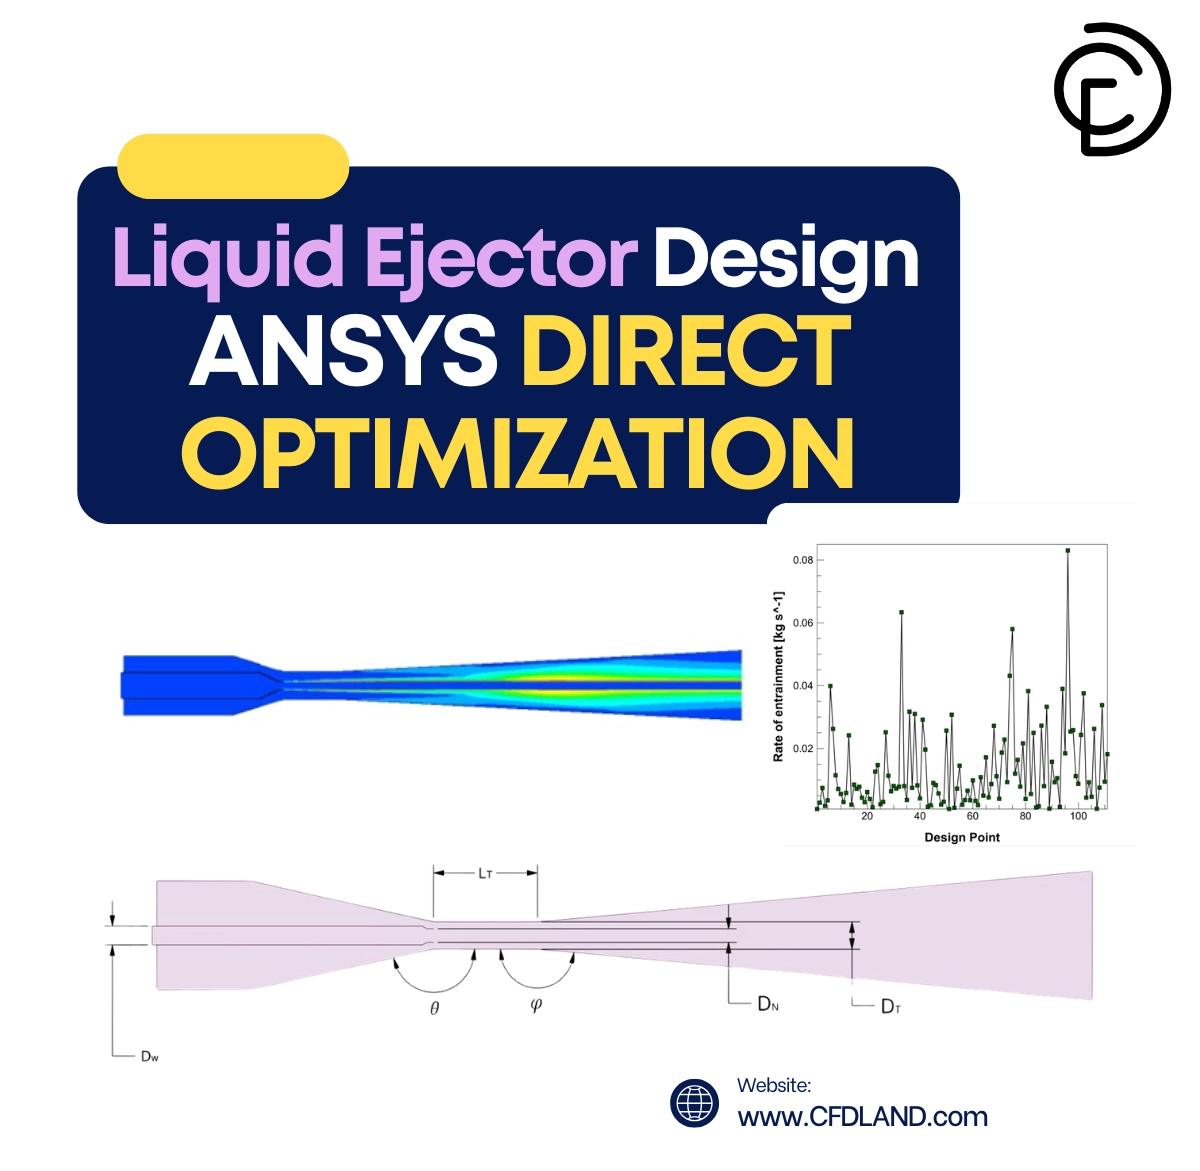
Figure 1: Several geometrical design variables\
Simulation Process: Automatic Design Matrix
To solve this problem, we build a highly accurate mathematical test. We use a 2D axisymmetric model in Ansys Fluent. We set up the Mixture multiphase model and the Algebraic Slip method. We use water as the primary driving fluid and air as the secondary fluid. We use a custom UDF slip velocity . This code locks the slip speed to exactly 13% of the local primary fluid axial velocity. This keeps our mathematical error safely below a 3% deviation limit.
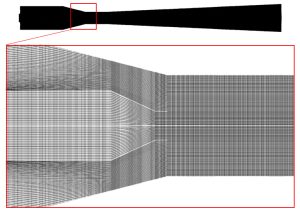
Figure 2: Grid generated on geometry fully structured 121205 quad cells
Our absolute goal is to maximize the rate of entrainment (kg/s). We command the ANSYS Direct Optimization engine to test exactly 110 design points. We tell the computer to change six physical parts. These are the throat length (LT), throat diameter (DT), nozzle diameter (DN), diverging section angle, converging section angle, and inlet diameter (INLET_DEA). To stop the computer from building broken shapes, we set strict geometric limits. We lock in rules for DT > DN, the LT/DT ratio, (DT/DN)^2, the inlet pressure condition, and DT > D_INLET.
Post-processing: Deep Physics of Vacuum Generation
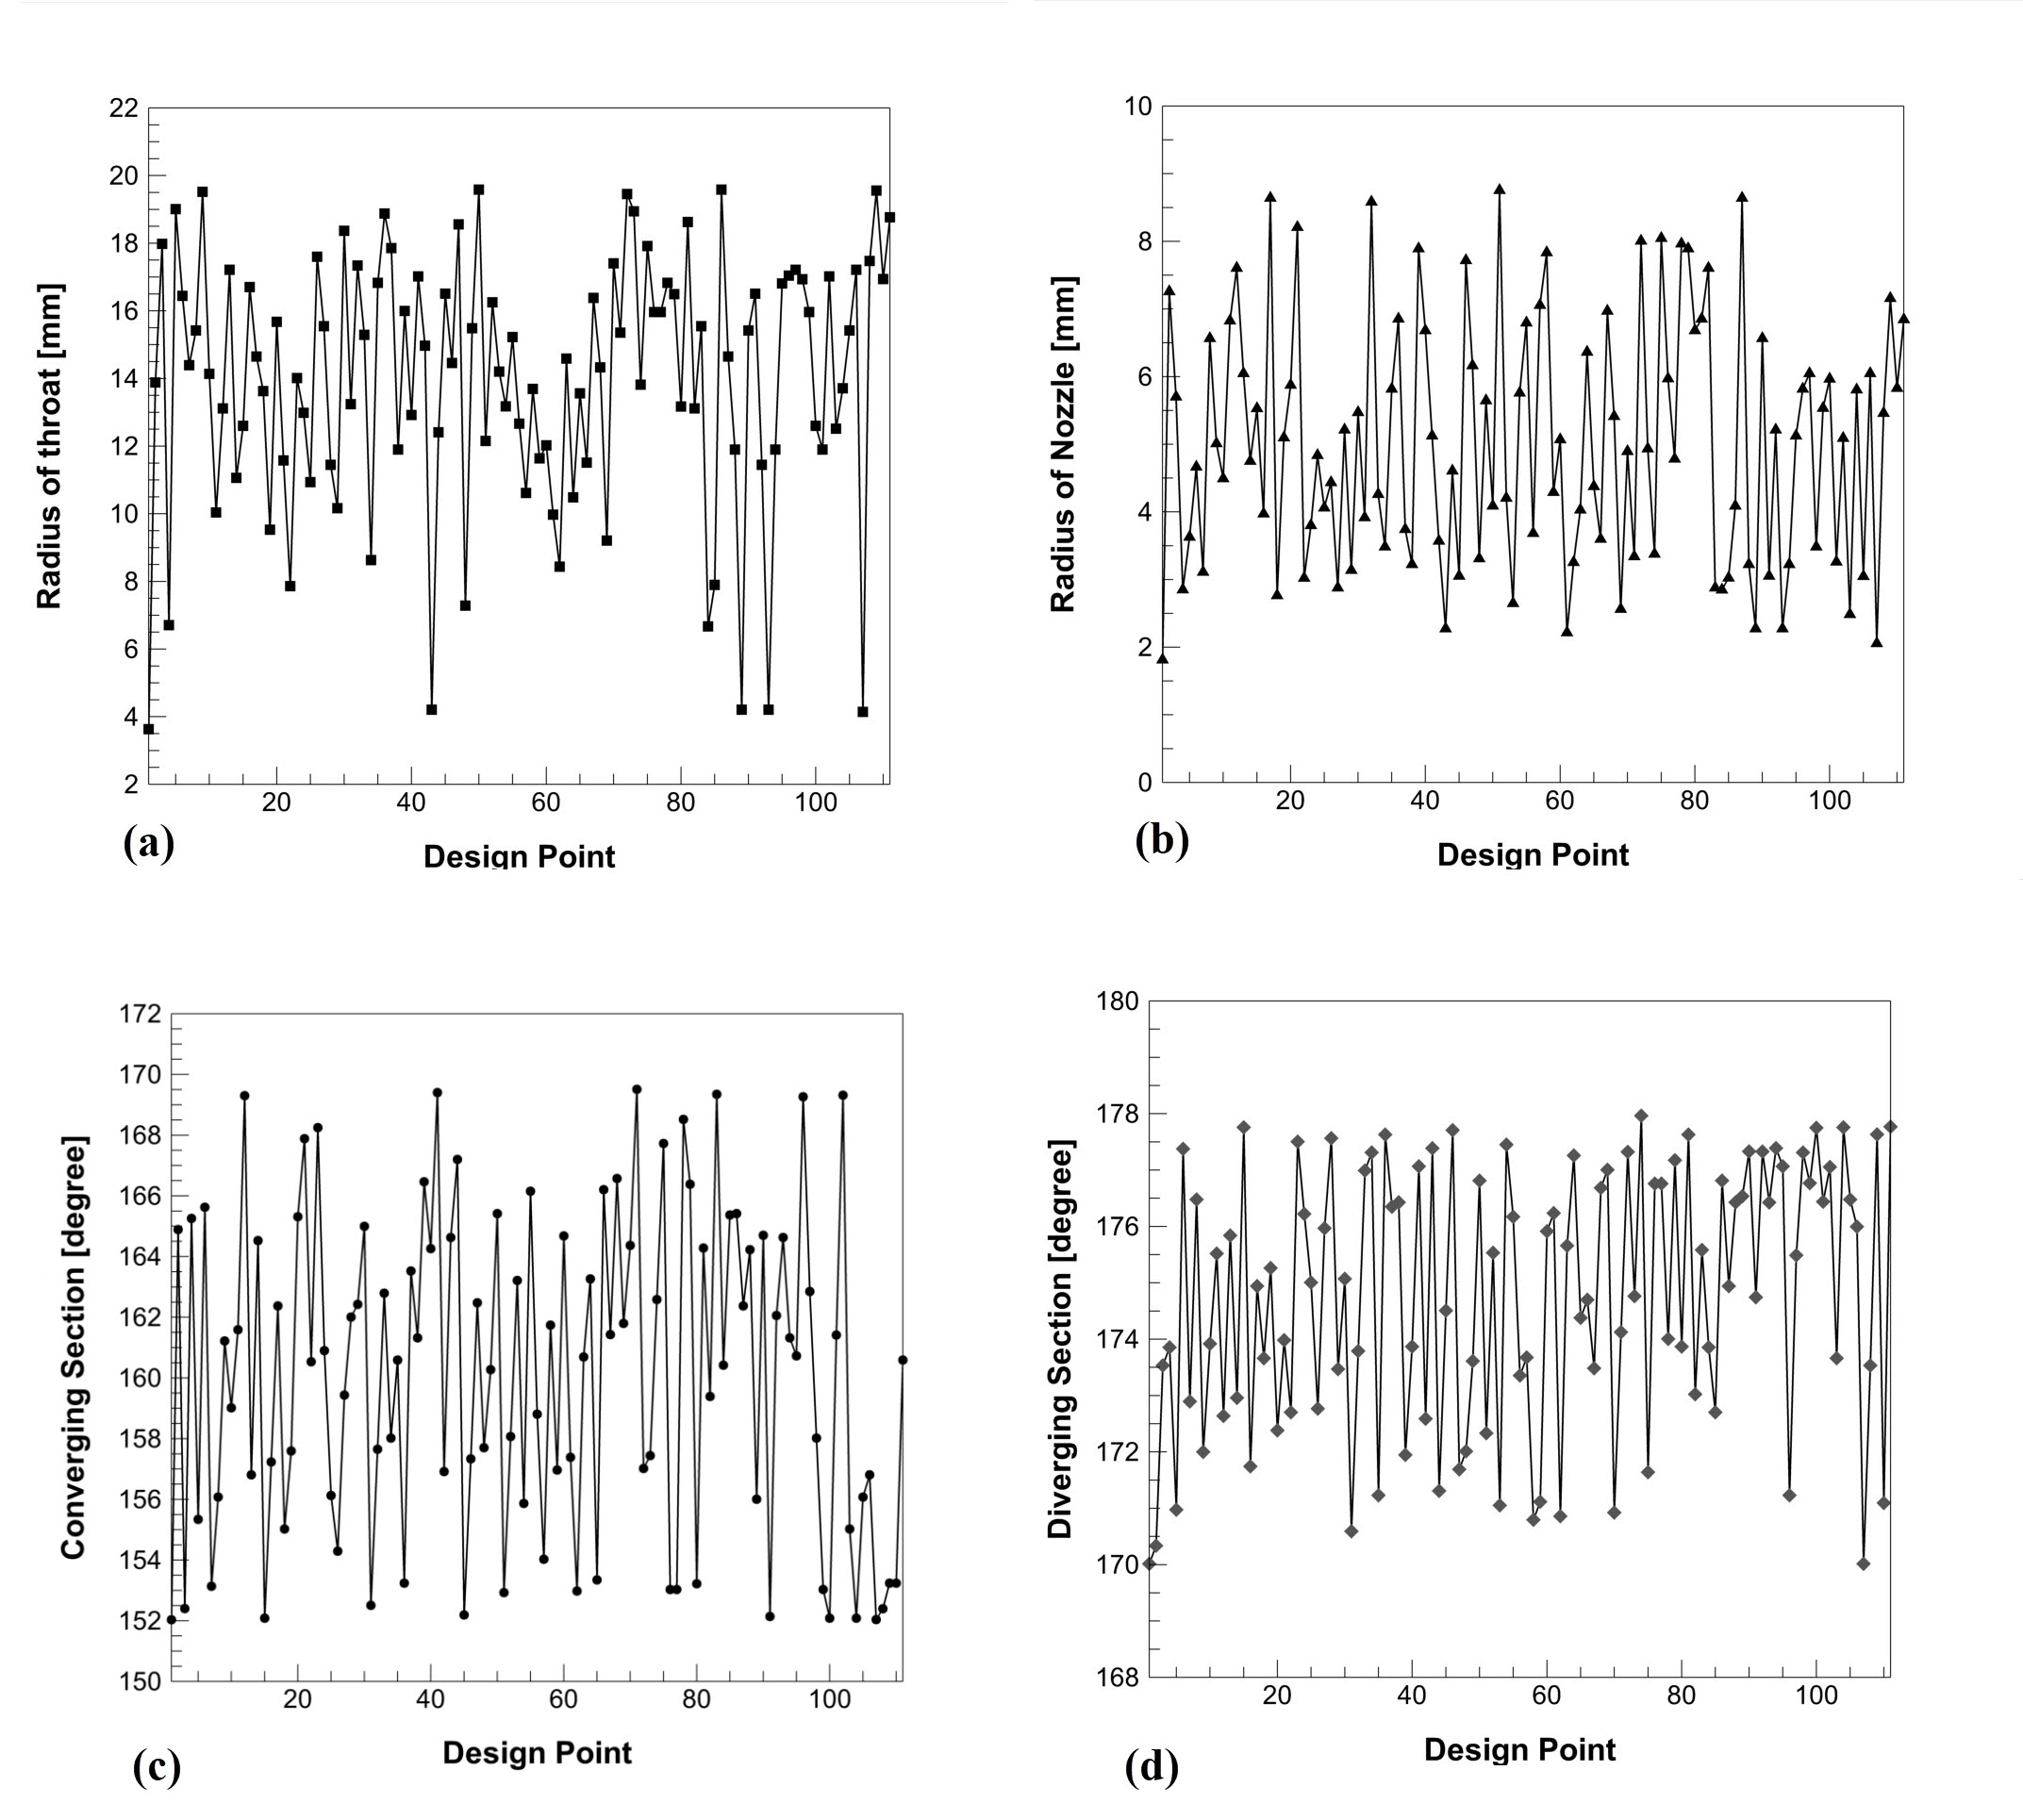
We must look very closely at the visual charts to understand the fluid physics. We will study the shape changes, the optimization search path, the fluid speed, and the gas movement. Look at the four line charts above the scatter plot. These charts show the computer thinking. The horizontal lines show the exact 110 design points. The vertical lines show the physical size changes. In chart (a), the Radius of throat jumps wildly from roughly 2 to 22 [mm]. In chart (b), the Radius of Nozzle changes from roughly 2 to 10 [mm]. Charts (c) and (d) show the Converging Section and Diverging Section angles constantly shifting. The computer creates random extreme shapes on purpose. By testing extreme big and small sizes, the math formula learns exactly which physical walls create the strongest vacuum suction.
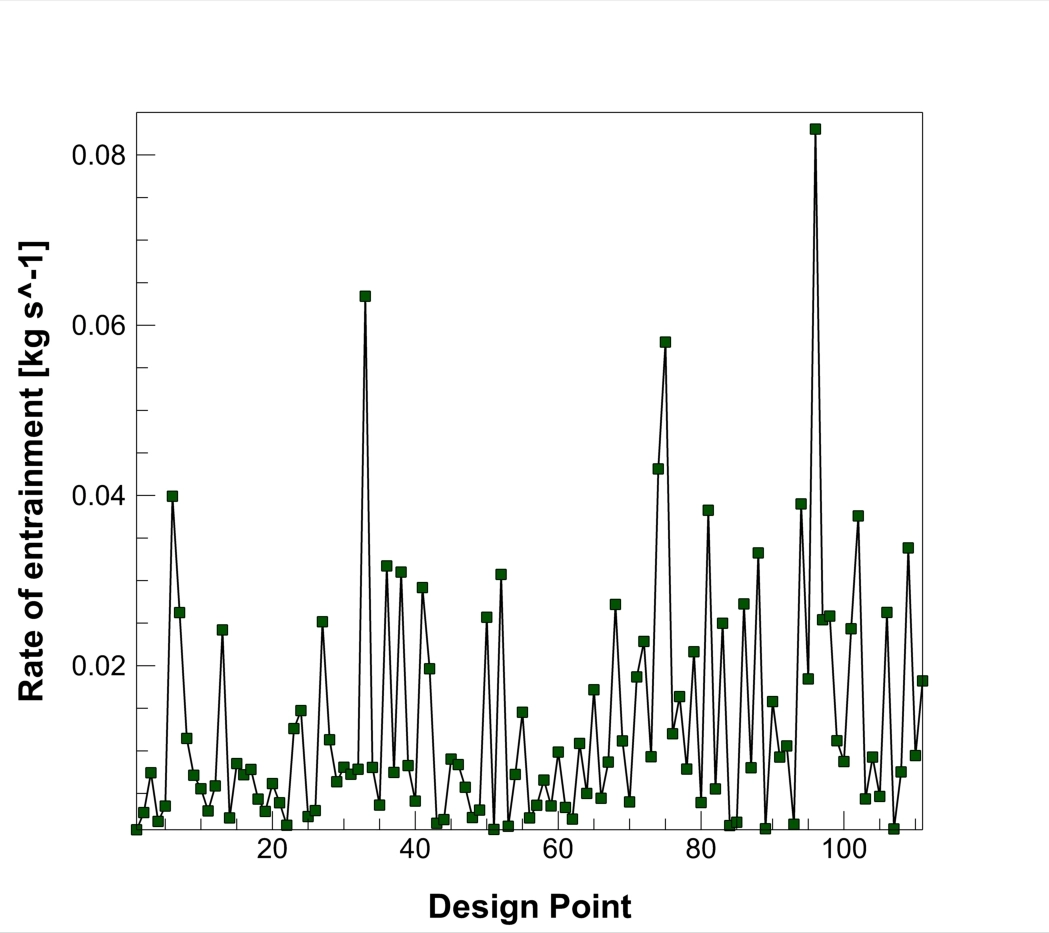
Look at the scatter plot in Figure 3. This graph proves which shape wins. The horizontal line tracks the exactly 110 design points. The vertical line measures the total rate of entrainment from 0.00 to over 0.08 [kg s^-1]. Most of the green squares sit very low on the graph. This means most random shapes fail to suck in air. However, look at the giant spike near point 90. The green line shoots straight up to the top. This proves the algorithm successfully found a magic combination of angles that maximizes the air suction power perfectly.
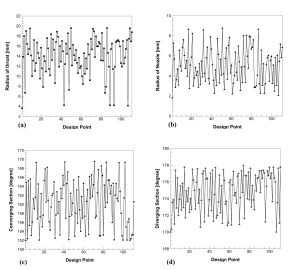
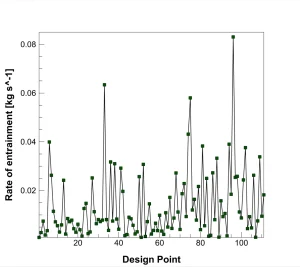
Figure 3: The output chart proving the optimal geometry creates a massive suction spike reaching over 0.08 [kg s^-1].
Look at Figure 4. This image visually compares the base design with the exactly 3 final candidate designs. Profile (a) is the base model. It is very thin. Profile (c) is Case II, which is the absolute optimal winner. Notice the massive physical difference. The optimal Case II has a much wider throat and a much larger diverging section at the back. When the tube expands wider at the back, it allows the mixed air and water to slow down smoothly. This smooth expansion recovers the pressure and prevents the air from choking inside the tight tube.
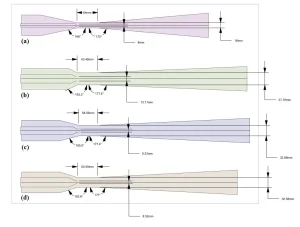
Figure 4: Geometric comparison of the three final candidate ejector designs selected by ANSYS Direct Optimization, shown as 2D axisymmetric profiles.
This first table shows the final performance results for the top shapes found by the computer.
| Parameter | Base Model | Case I | Case II (Optimal) | Case III |
| DN (M) | 8.00×10^-3 | 8.52×10^-3 | 9.33×10^-3 | 1.37×10^-2 |
| ΔPG (PA) | 611.7 | 14,115.86 | 6,801.48 | 2,097.17 |
| ΔPL (PA) | 4,468.8 | 167,376.4 | 59,687.1 | 57,205.0 |
This second table reveals the exact physical dimensions that created the optimal suction power.
| Profile Name | Length [mm] | Converging Angle [°] | Diverging Angle [°] | Throat Dia [mm] | Nozzle Dia [mm] |
| (a) Base | 64.00 | 168.0 | 175.0 | 16.00 | 8.00 |
| (b) Case I | 63.48 | 153.2 | 177.6 | 37.76 | 13.71 |
| (c) Case II | 58.56 | 165.6 | 177.4 | 32.89 | 9.33 |
| (d) Case III | 62.99 | 162.8 | 177.0 | 30.58 | 8.52 |
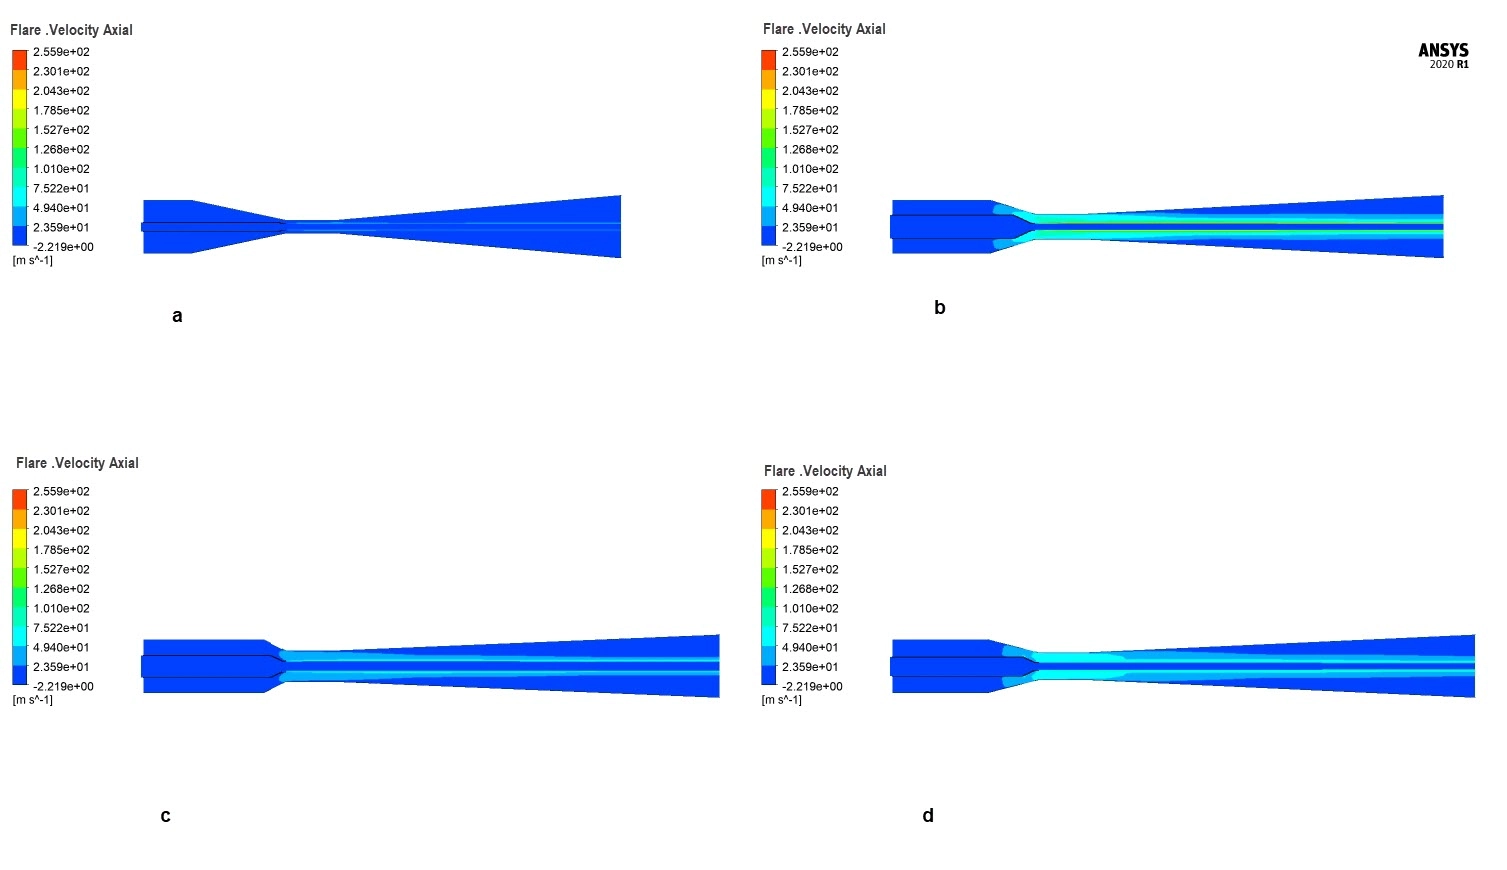
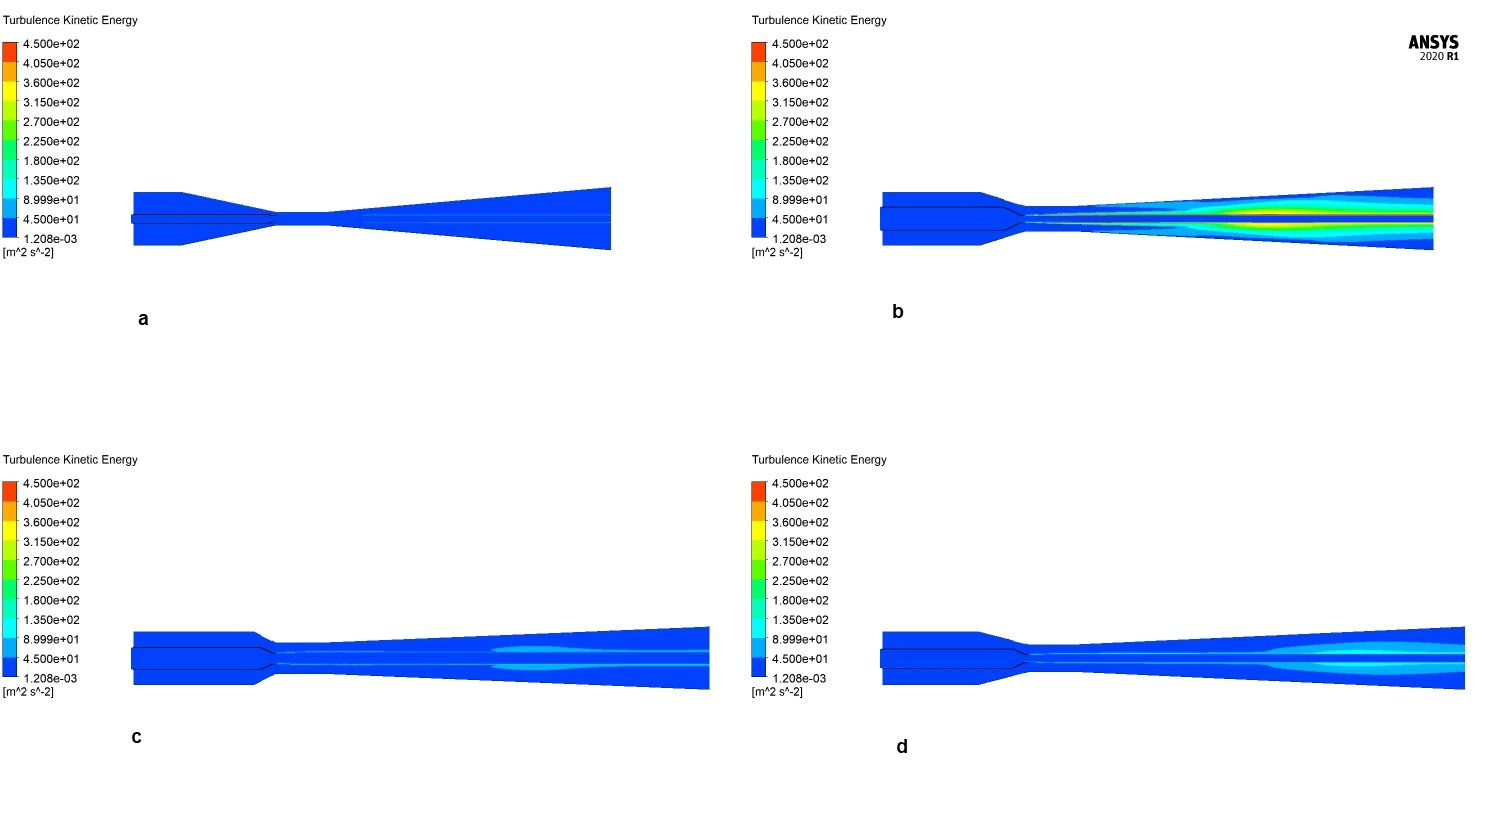
We must look at all four Velocity Axial contours. In design a, the physical throat is very narrow. The fast water jet is just a thin dark blue line. The fluid loses its high speed very quickly. In design b, the throat is wide. You can clearly see a thick green and cyan core. This high speed travels much deeper into the exit pipe. In design c, the green jet core is slightly thinner than design b. In design d, the green speed core is thicker than design c, but thinner than design b. In fluid physics, keeping the water moving fast for a longer distance creates a larger low-pressure zone. A larger low-pressure zone creates a much stronger vacuum pull.
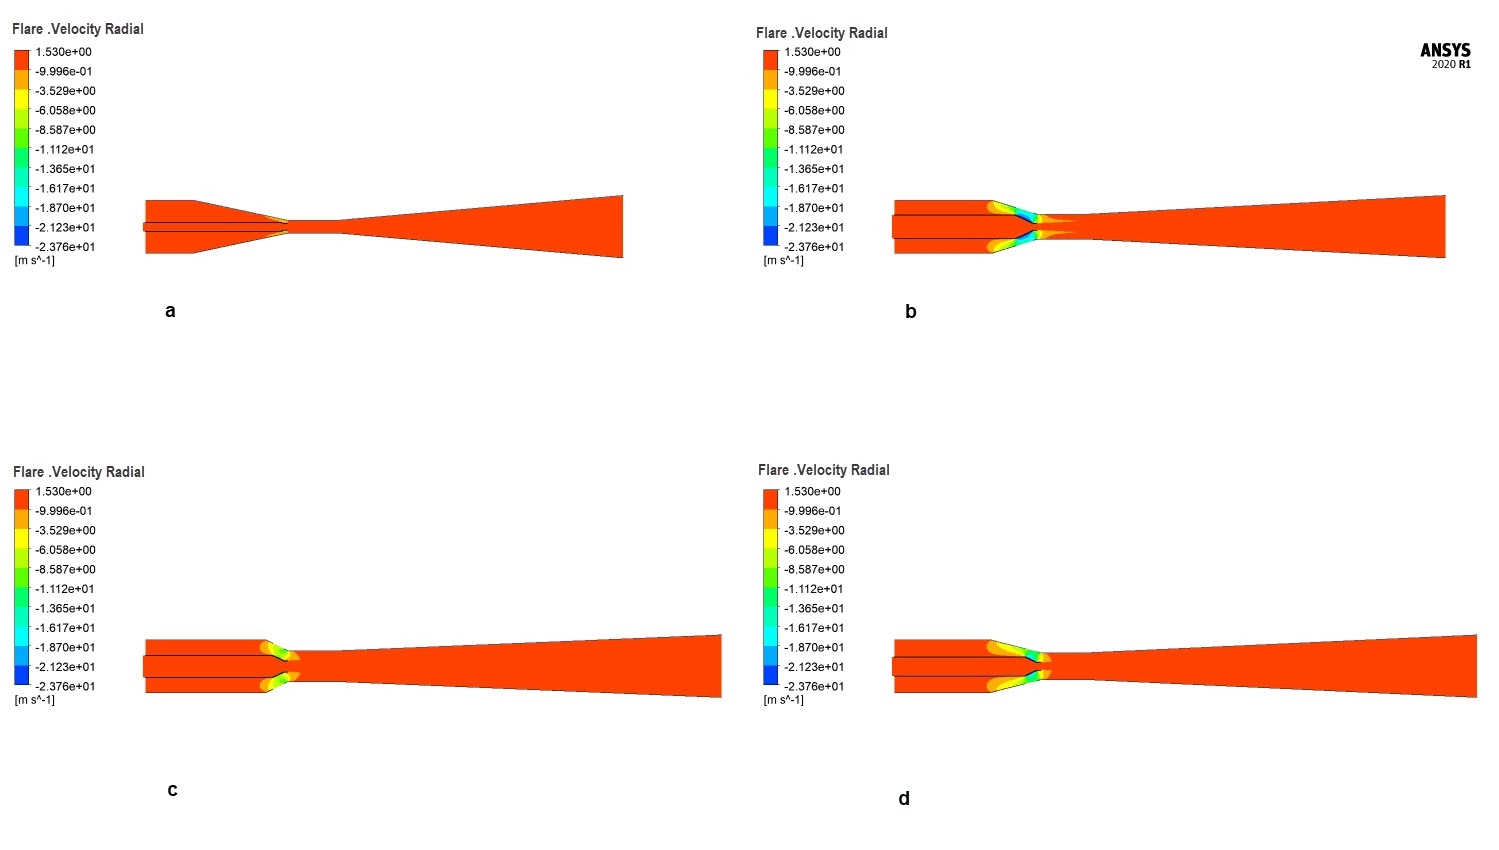
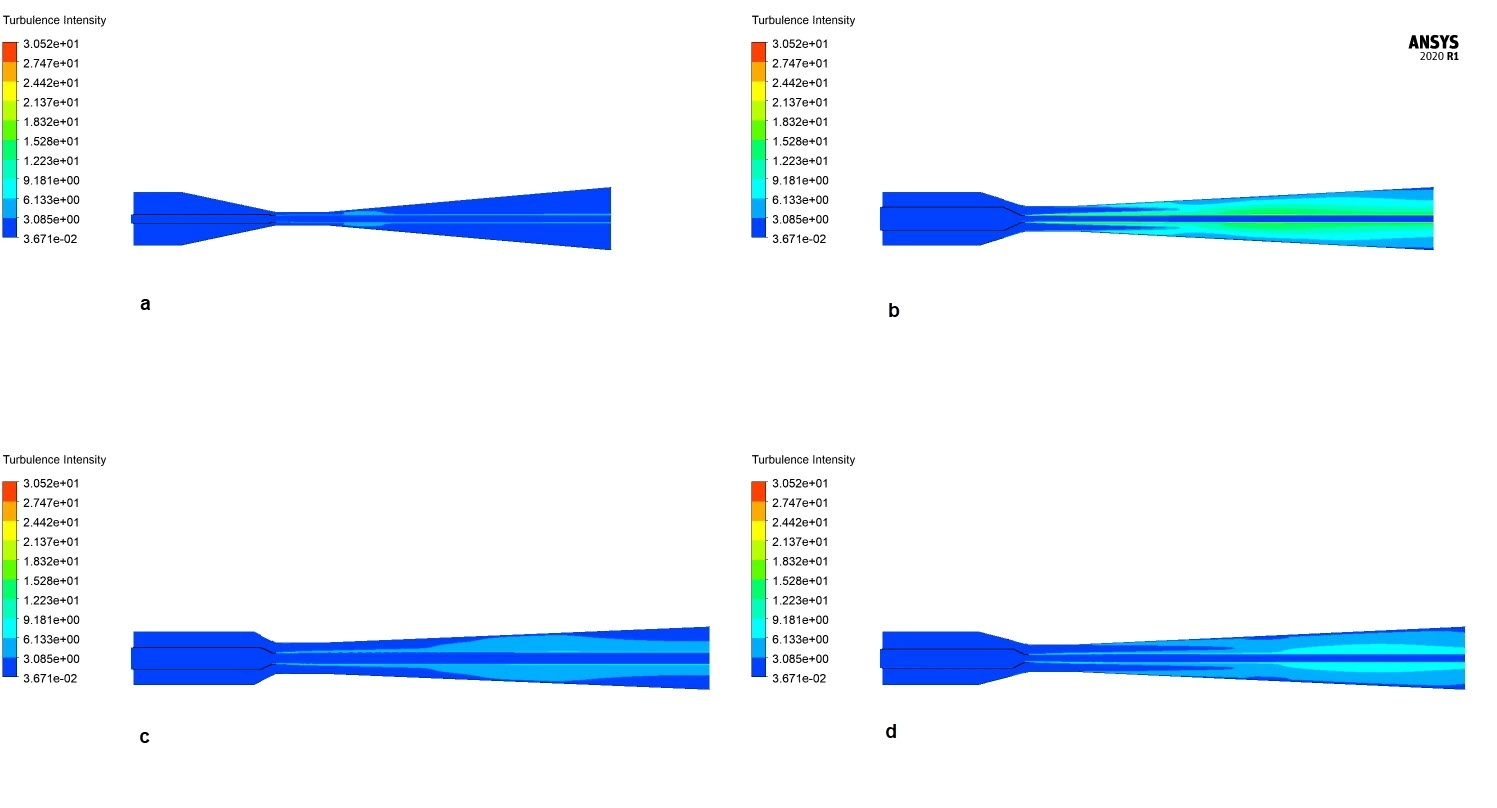
Now we compare the four Air Stream Function contours. Design a is almost completely dark blue. This means the air is physically stuck. The narrow walls choke the flow, and the suction fails completely. Design b is the absolute strongest. It shows thick bright red, orange, and yellow bands. These hot colors prove it pulls the maximum air mass near exactly 7.915e-03 [kg s^-1]. Design c shows mostly green and light blue bands. It successfully pulls air through the pipe, but the flow is weaker than design b. Design d shows yellow and green bands. It pulls more air than design c, but it still pulls less than design b. Expanding the physical walls stops the choking effect. It gives the secondary air enough physical room to slide smoothly past the fast water jet.
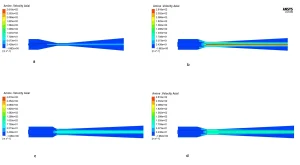
Figure 5: Velocity Axial contour proving the wide throat allows the core jet to hit 125.47 [m/s] without choking.
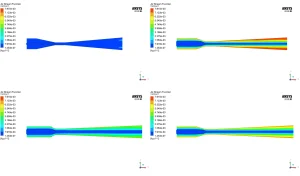
Figure 6: The Air Stream Function contour proving the optimal shape safely carries the massive air volume out to the exit.
For picking among our three candidates, the ejector energy efficiency is calculated using the standard thermodynamic ratio between the useful energy delivered to the gas phase and the energy consumed by the liquid driving jet:
Where:
- M_G = Gas (air) mass flow
- M_L = Liquid (water) mass flow
- ΔP_G = Pressure recovery of gas from suction inlet to outlet
- ΔP_L = Pressure drop of liquid from nozzle to throat
The energy efficiency chart tells the full story clearly — Case II (Design Point 2) reaches 60.21%, which is nearly 3.4× higher than the Base Model (17.93%) and dominates both Case I (31.73%) and Case III (9.40%) by a large margin. This sharp peak at Case II confirms that its nozzle diameter (DN = 9.33 mm) and nozzle velocity (VN = 125.47 m/s) hit the ideal balance, generating enough suction pressure to entrain the maximum air volume without wasting excessive pumping energy on the liquid jet.
Case I, despite having the highest entrainment volume (Qs = 0.02207 m³/s), wastes enormous liquid energy (Power = 404,000 W), making it highly inefficient in practice. Case III collapses to only 9.40% because its oversized DN = 13.7 mm reduces the jet velocity too much to maintain adequate suction pressure, confirming that Case II is the true optimal ejector design from this ANSYS Direct Optimization CFD study.
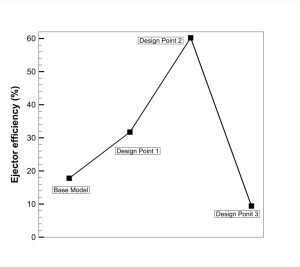
Figure 7: Ejector energy efficiency (%) comparison — Base Model (17.93%), Design Point 1 / Case I (31.73%), Design Point 2 / Case II (60.21%), and Design Point 3 / Case III (9.40%). Case II delivers the highest efficiency, nearly 3.4× above the base model.
✅ Case II is the optimal ejector design. It achieves the highest energy efficiency of 60.21% with a well-balanced nozzle velocity, entrainment rate, and power consumption, making it the best outcome of this liquid ejector CFD optimization using ANSYS Fluent Direct Optimization.
Frequently Asked Questions (FAQ)
- Why does the high-speed water pull the air inside?
- This is called the Bernoulli principle. When the water shoots out of the tiny nozzle very fast, its physical pressure drops extremely low. The outside air has higher pressure. The high-pressure air naturally rushes inward to fill the low-pressure hole, creating a powerful suction effect.
- Why does the optimal design have a larger diverging section?
- A larger diverging section allows the air-water mixture to decelerate gradually and recover pressure more effectively. This reduces flow losses and helps prevent choking, leading to improved entrainment performance and higher overall efficiency.
- What is the Direct Optimization tool in ANSYS?
- It is an automated math robot. Instead of a human drawing one tube, guessing, and testing it, the robot draws hundreds of tubes automatically. It looks at the results, learns which shapes work best, and mathematically hunts for the absolute perfect design point.


Reviews
There are no reviews yet.