


Designing highly efficient factory dust separators requires an accurate CFD Analysis of Pressure Drop in Industrial Parallel Cyclones to evaluate aerodynamic energy losses. Engineers perform a detailed Pressure Drop in Industrial Parallel Cyclones fluent simulation to calculate how rotational airflow creates wall friction and reduces system efficiency. It is important to emphasize that this project is an educational engineering simulation. To study more advanced techniques regarding multiphase separation and airflow dynamics, please explore our Separators tutorials.
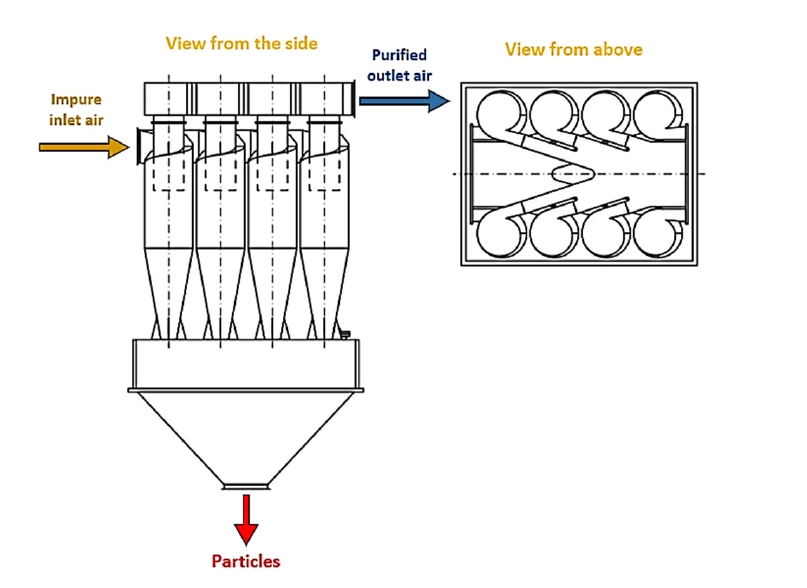
Figure 1: Connecting cyclones in parallel at the same level [Source: https://doi.org/10.3390/applmech6040082]
Simulation process: Polyhedral Meshing and Airflow Setup
To investigate the aerodynamic performance of this large factory system, we developed a 3D geometry model representing parallel twin cyclone separators connected to a main inlet manifold and a common outlet pipe. Inside the Pressure Drop in Industrial Parallel Cyclones ANSYS Fluent environment, we discretized this continuous fluid domain into exactly 3,155,124 polyhedral cells. Polyhedral meshing is the most optimal academic approach for a Pressure Drop in Industrial Parallel Cyclones fluent study because these cell shapes calculate complex rotational airflow and severe pressure gradients much more accurately than standard tetrahedral structures. For the boundary conditions, we assigned a precise mass flow rate of 47.15 kg/s of dirty industrial air entering the main inlet pipe. The computational solver then iteratively calculated how this massive volume of airflow distributes through the parallel tanks, develops a strong centrifugal swirling pattern, and finally exhausts through the top outlet tubes.
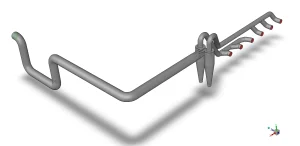
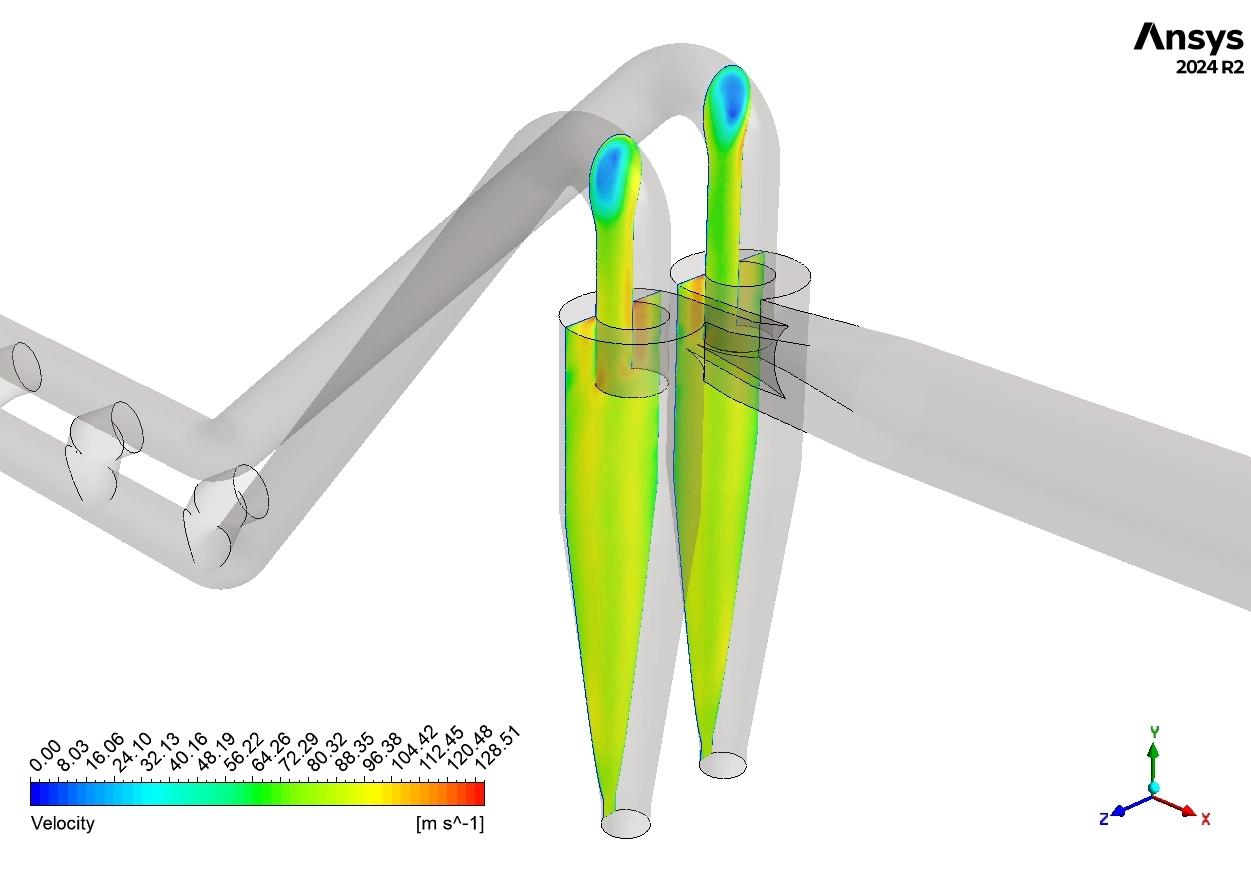
Figure 2: Geometry model, displaying the 3D computer space of the parallel cyclones, the main inlet pipe, and the outlet manifold.
Post-processing: Analysis of Rotational Airflow and System Pressure Drop
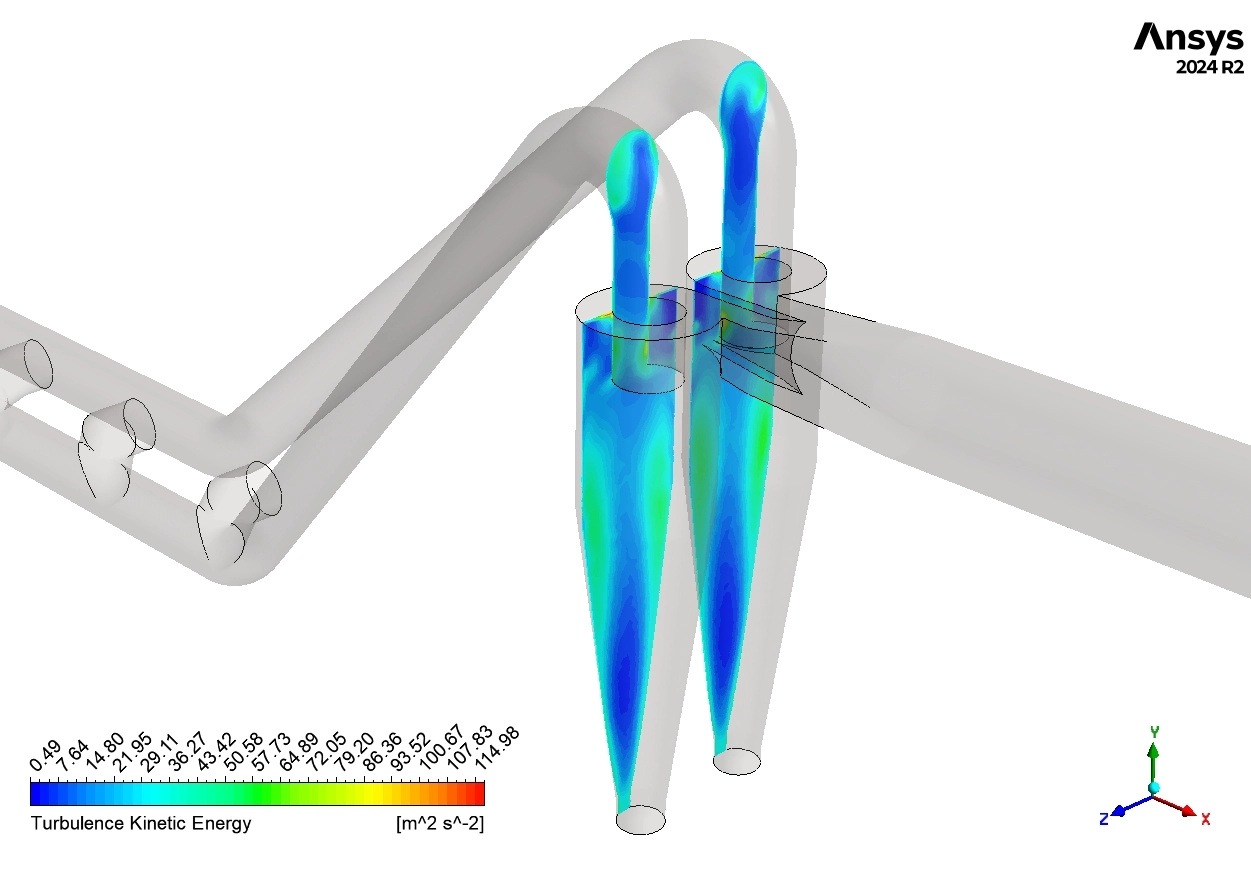
To fully understand this complex separation system, we must analyze the aerodynamic contours and explain the physical energy loss to the factory designers. The main engineering challenge is creating enough centrifugal force to separate the dust, without creating too much friction that wastes electrical power. We will explain exactly how the airflow velocity changes and why this causes a severe drop in the system’s pressure.
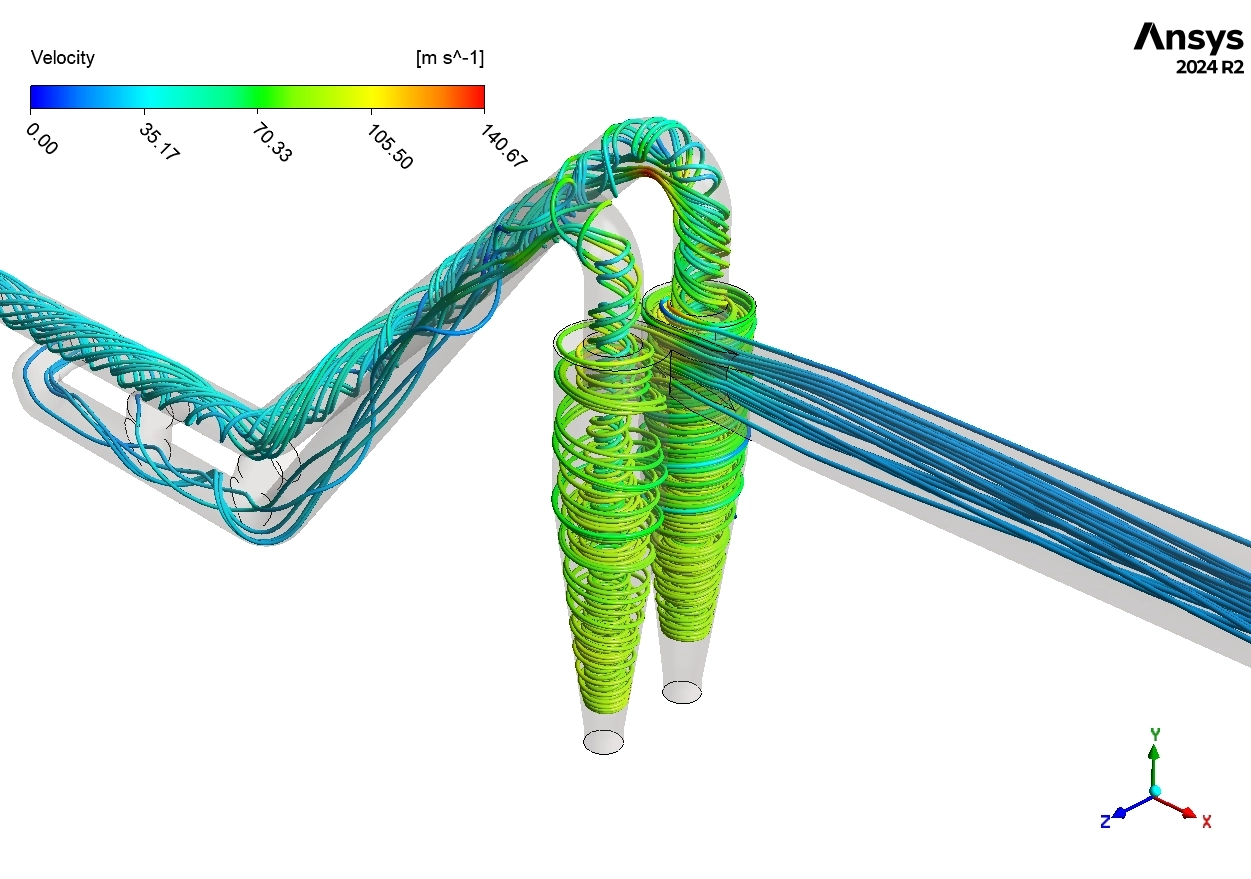
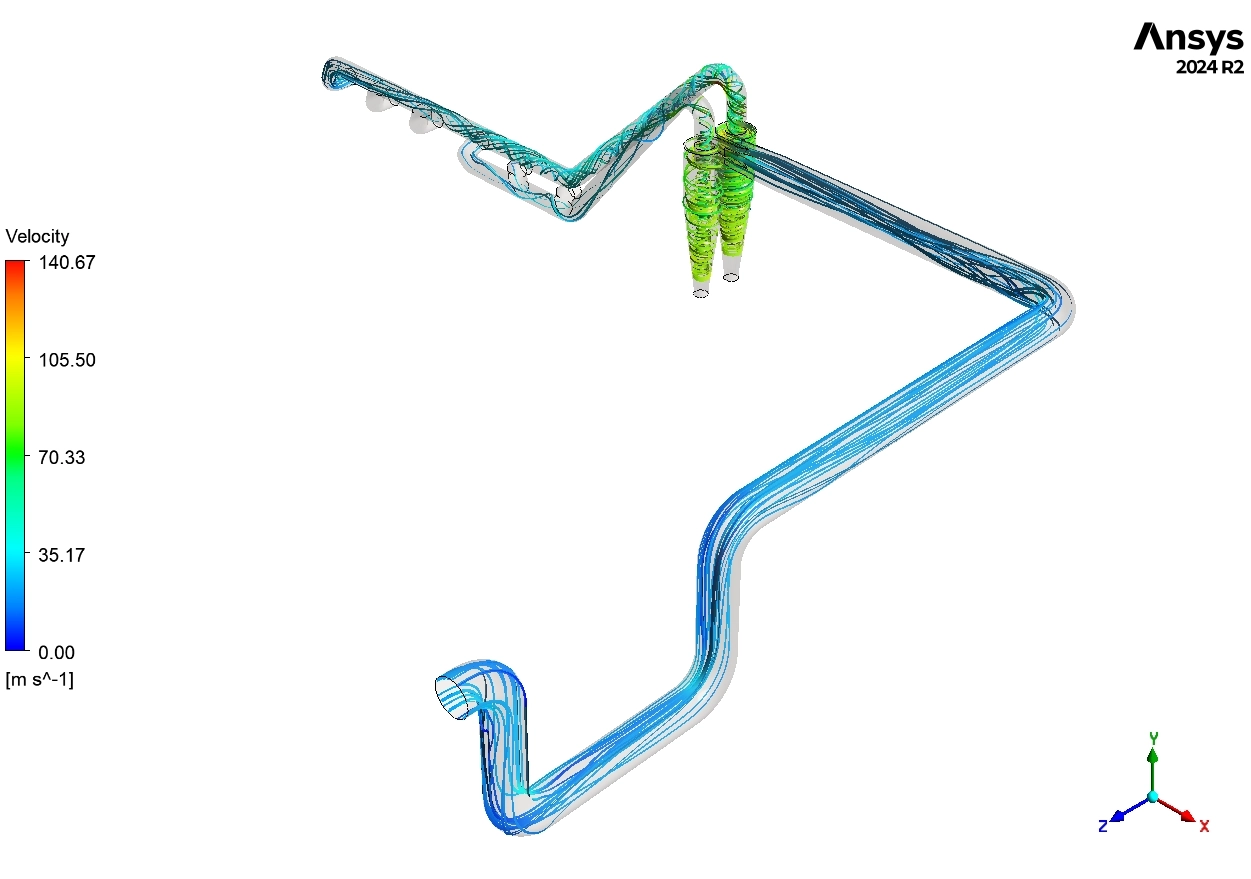
First, we analyze the Velocity Streamlines Contours to observe the internal airflow behavior. The dirty airflow enters the main inlet pipe very smoothly at a low speed of 5 to 15 m/s. However, when the airflow enters the round cyclone bodies, it begins to swirl intensely, reaching a high velocity of 70 to 105 m/s. Inside the central exit tubes, the spinning airflow reaches an extreme peak velocity of 140.67 m/s. This fast swirling motion is structurally necessary because it creates the strong centrifugal force that pushes heavy dust particles against the outer walls. However, pushing massive amounts of air at 140 m/s creates intense wall friction, which leads directly to a severe aerodynamic energy loss.

Figure 3: Velocity streamlines in industrial parallel cyclones (0.00 to 140.67 m/s), illustrating the extremely fast rotational airflow accelerating inside the center exit tubes.
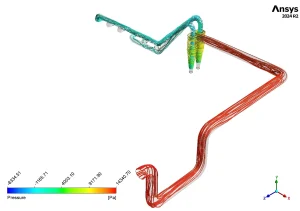

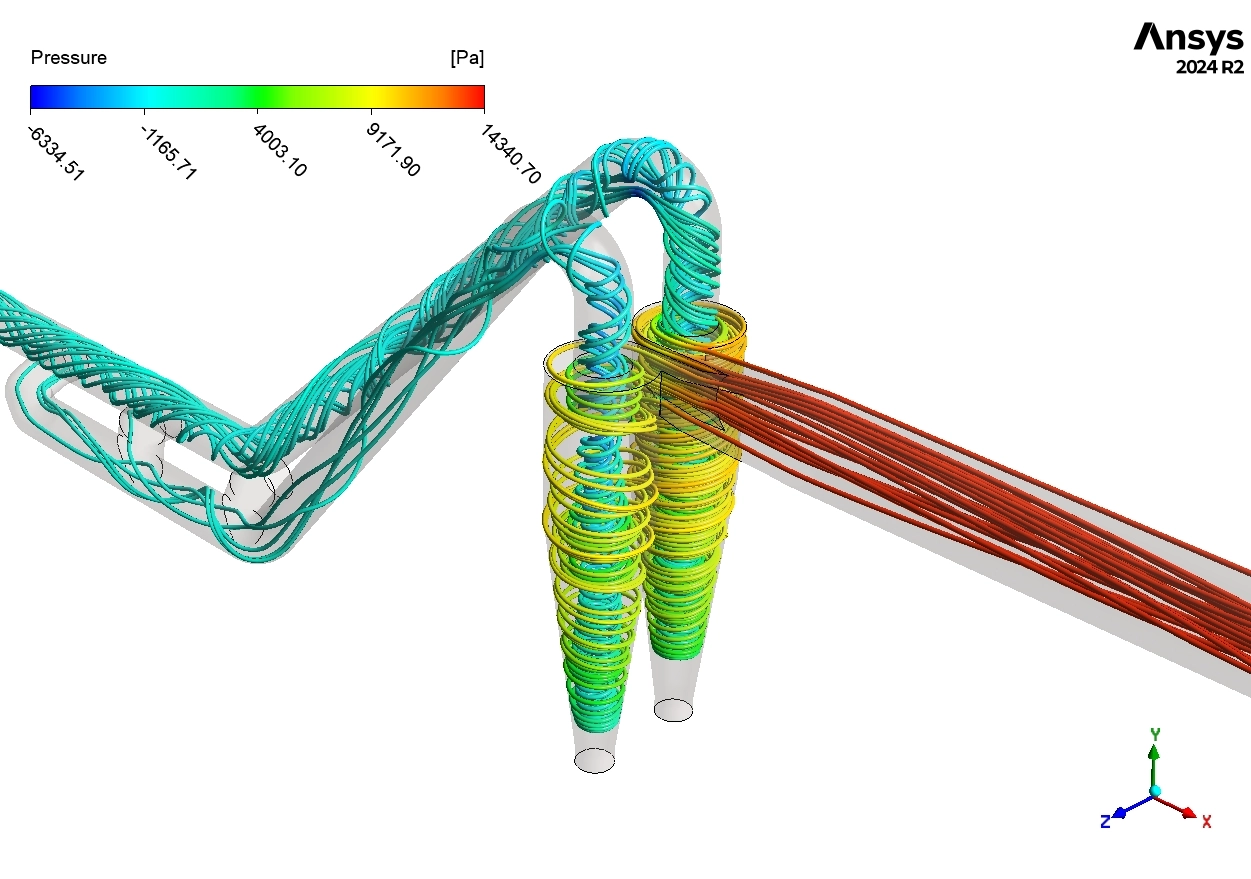
Figure 4: Pressure streamlines in industrial parallel cyclones from ANSYS Fluent CFD (-6334.51 to 14340.70 Pa), visualizing the high-pressure zones at the inlet and the low-pressure zones at the exit.
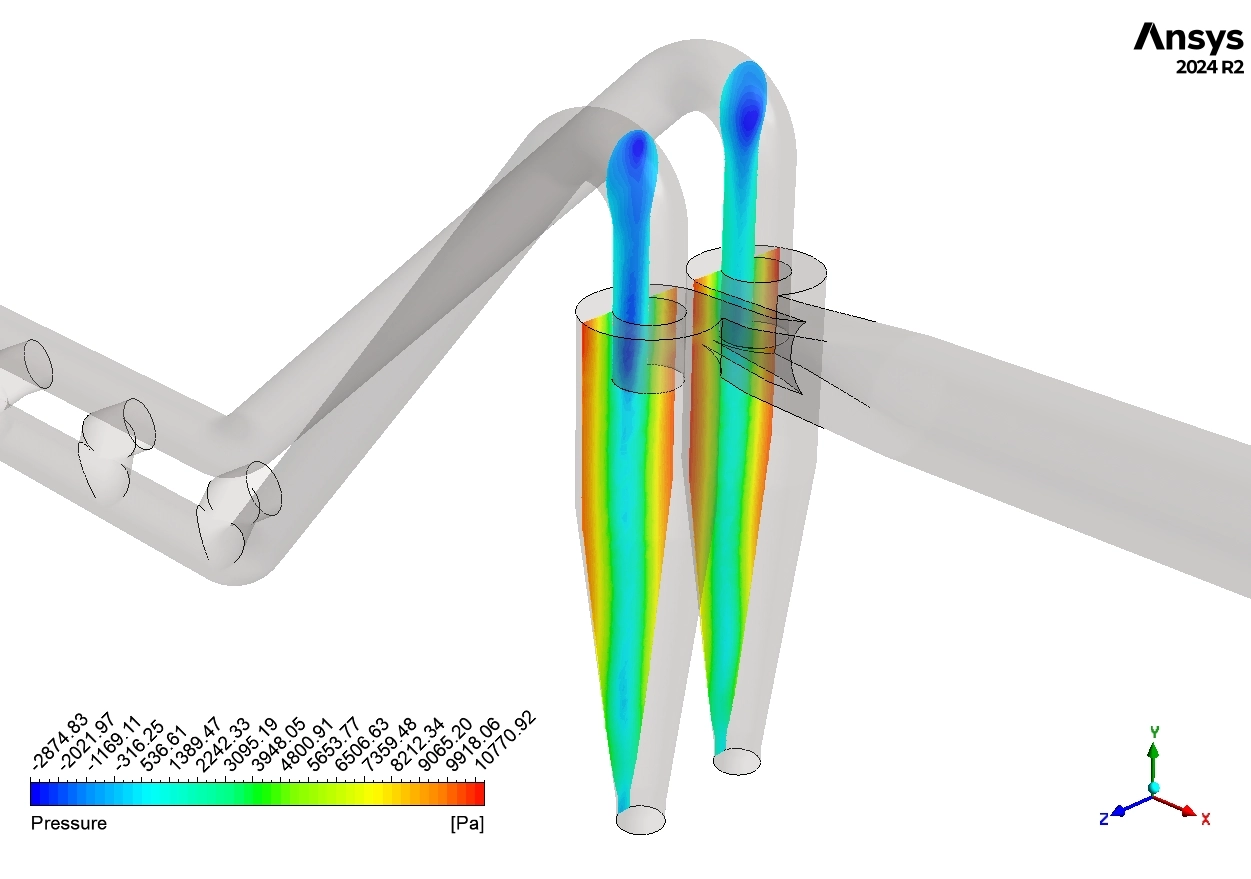
Next, we evaluate the Pressure Streamlines Contours to measure this specific energy loss. The heavy airflow enters the system carrying a maximum pushing pressure of 14,340.70 Pa. As the airflow swirls rapidly through the twin parallel tanks, the wall friction rapidly consumes this mechanical energy. Consequently, the clean airflow leaves the upper exit pipes at a negative pressure of -6334.51 Pa. By calculating the exact difference between the inlet and the outlet, the computer simulation proves that the system suffers a massive pressure drop of exactly 14,142.564 Pa.
This specific Pressure Drop in Industrial parallel Cyclones data is the most critical engineering outcome of the study. A total pressure drop of 14,142.564 Pa is exceptionally high. It indicates that the factory must install a massive electrical fan simply to push the airflow through the machine. Furthermore, the visual CFD data reveals an imbalance, showing that the upper cyclone sections receive slightly more air pressure than the lower sections. By utilizing this exact ANSYS Fluent data, engineers can smoothly redesign the geometry of the main inlet pipe to balance the airflow distribution perfectly. This precise geometric modification will lower the friction, heavily reduce the pressure drop, and significantly decrease the electrical power costs for the factory.
Frequently Asked Questions (FAQ)
- Q: Why does the airflow velocity increase so rapidly inside the cyclone?
- A: The airflow is forced from a large straight pipe into a tight, circular cone geometry. This structural change forces the airflow to swirl into a vortex, increasing the velocity to 140.67 m/s to maintain the mass flow rate.
- Q: What is the main cause of the 14,142 Pa pressure drop?
- A: The pressure drop is primarily caused by aerodynamic friction. As the high-speed airflow aggressively rubs against the solid steel walls of the cyclones, the mechanical energy is lost as heat and friction.
- Q: How does a polyhedral mesh improve this CFD simulation?
- A: Polyhedral cells have multiple geometric faces. This complex shape allows the software solver to calculate highly curved, swirling airflow much more accurately and efficiently than standard triangular cells.


Reviews
There are no reviews yet.