

Human blood pumps in a pulsatile manner, creating an unsteady flow. When surgeons construct a bypass graft to treat blocked leg arteries, they connect new conduits to existing blood vessels. This complex geometry forces the blood flow to impact vessel walls, leading to dangerous flow instabilities that can cause restenosis (re-blocking). To predict and prevent this, engineers perform numerical simulations of pulsatile blood flow, incorporating reverse flow conditions.
The primary validation aim is to compare our calculated axial and secondary velocity profiles against physical experimental vector data. This ensures the computational model can accurately predict dangerous flow zones before actual surgery. This ANSYS Fluent tutorial teaches you how to study these critical hemodynamic patterns.
- Yukhnev, Andrey, et al. “V Flow Measurements of Pulsatile Flow in Femoral-Popliteal Bypass Proximal Anastomosis Compared with CFD Simulation.” Fluids 9.3 (2024): 64.
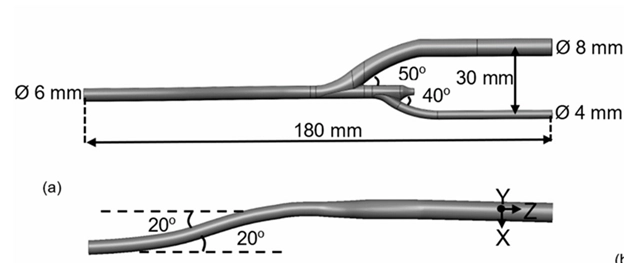
Figure 1: The complicated geometry of the femoral-popliteal bypass graft.[1]
Simulation Process: Flow Parameters in Pulsatile Flow Fluent Simulation
The physical bypass domain requires high-precision calculation. We divide the 3D space into a grid containing 347,557 calculation cells. This specific mesh density is required to calculate the thin viscous boundary layers near the solid vessel walls.
Blood speed changes constantly with every single heartbeat. To capture this physical behavior, we apply two distinct flow rate profiles at the inlet boundary. These dynamic mathematical expressions force the pulsatile flow CFD simulation to match the true human heartbeat rhythm over time. You can learn more about setting up biological boundaries in our CFD in biomedical engineering training library.
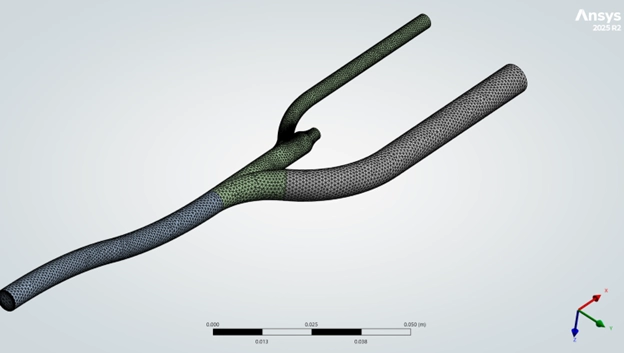
Figure 2: The computational domain meshed with unstructured cells to capture vessel boundary layers.
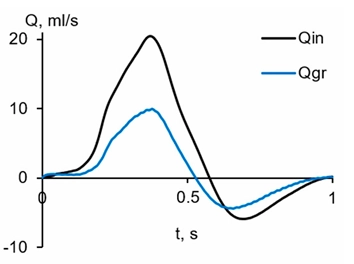
Figure 3: The dynamic mathematical expressions driving the two distinct flow rate profiles. [1]
Post-processing: Velocity Validation and Hemodynamic Physics
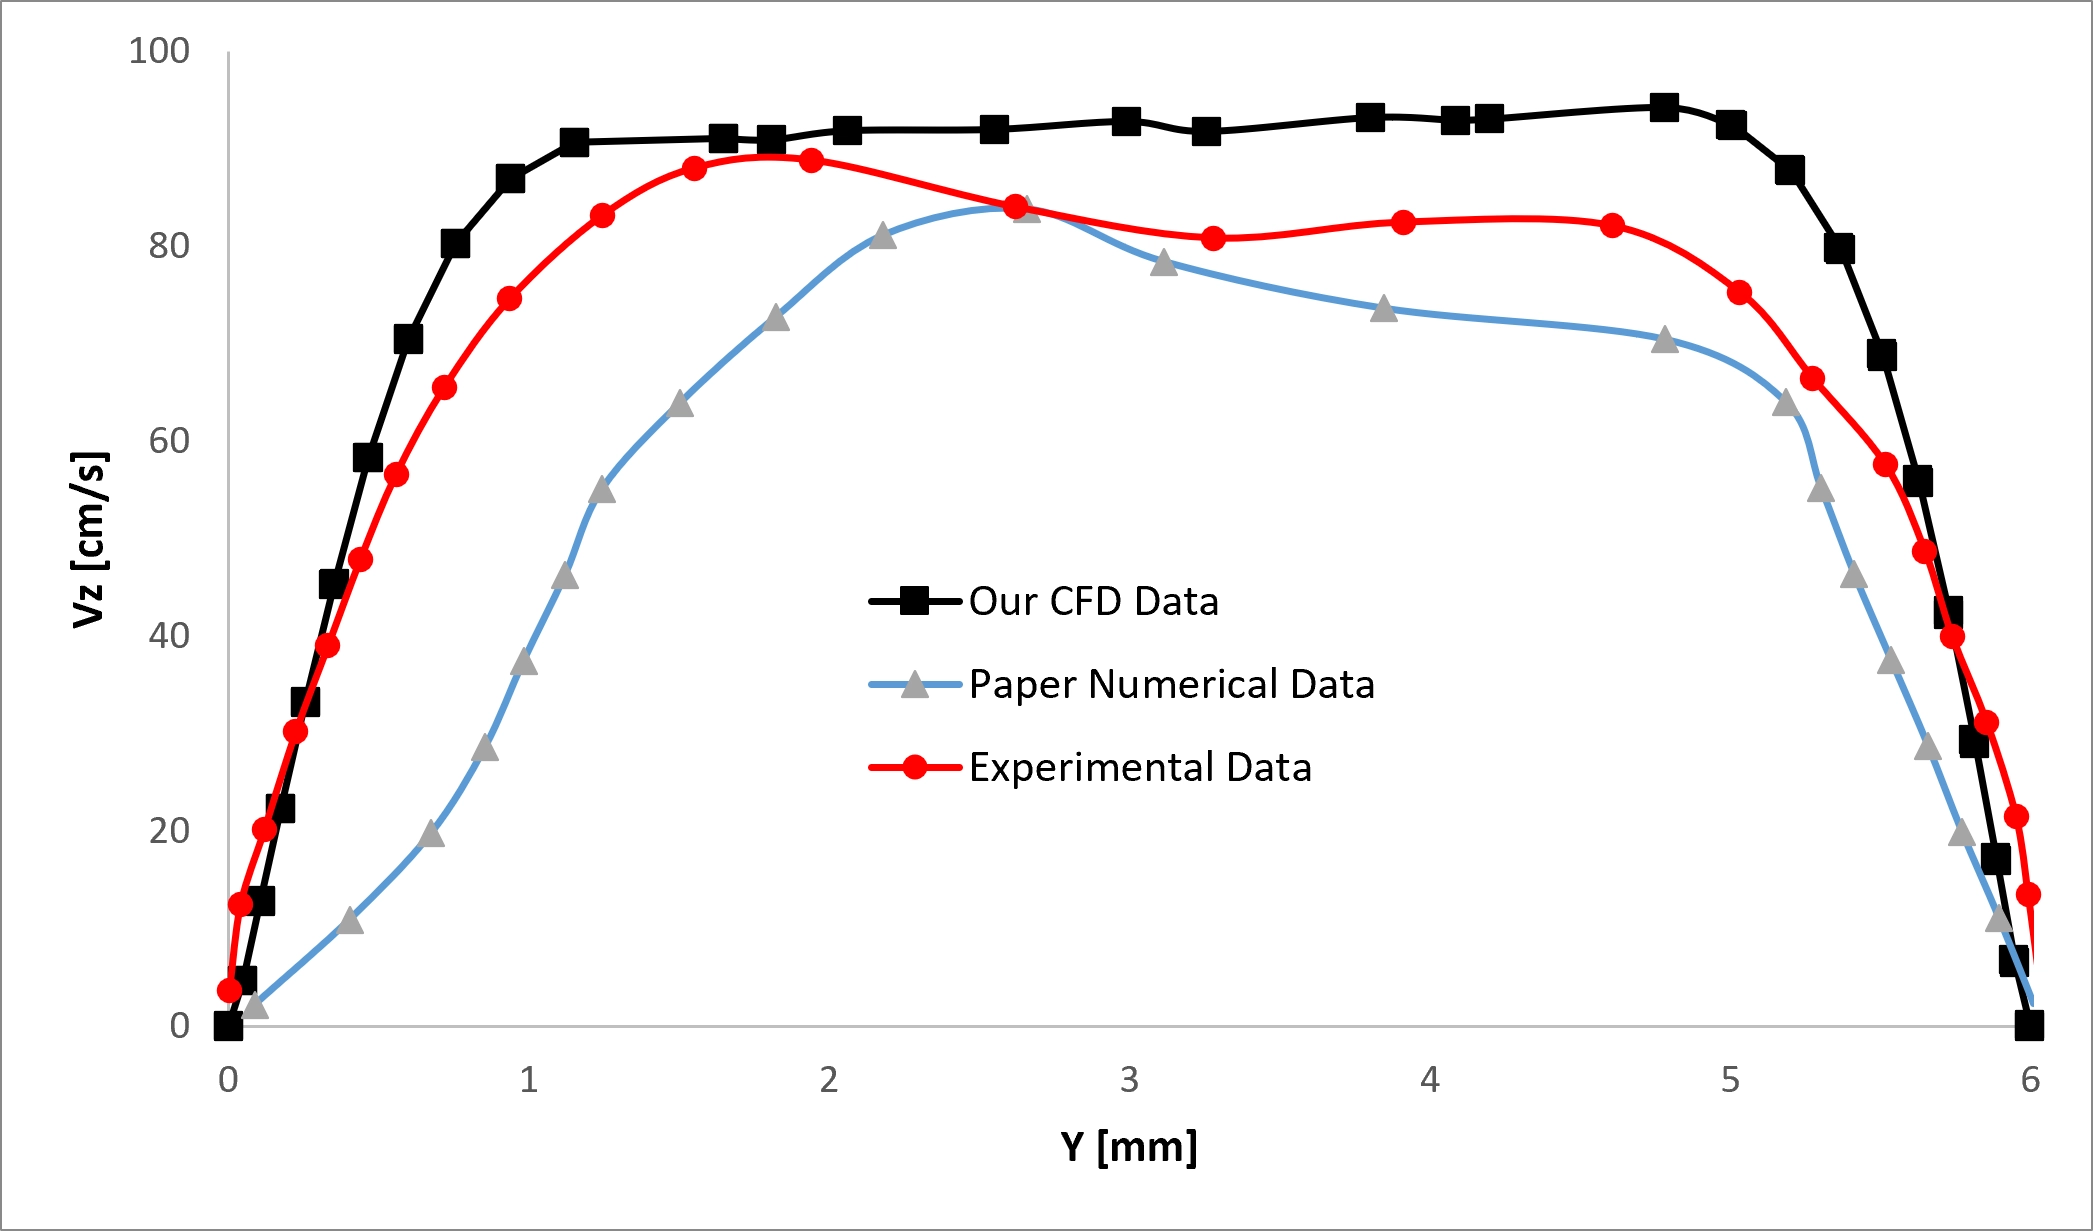
The axial velocity (Vz) chart confirms a flat, plug-like flow moving through the main central section. Our calculated Vz hits a core peak speed of 93 cm/s to 95 cm/s across the gap of Y = 1.5 mm to 5.0 mm. This result is highly accurate, sitting just 8% higher than the physical experimental peak of 88 cm/s. Near the solid boundaries, from Y = 0 mm to 1.5 mm and Y = 5.0 mm to 6.0 mm, the blood velocity drops sharply due to viscous wall friction.
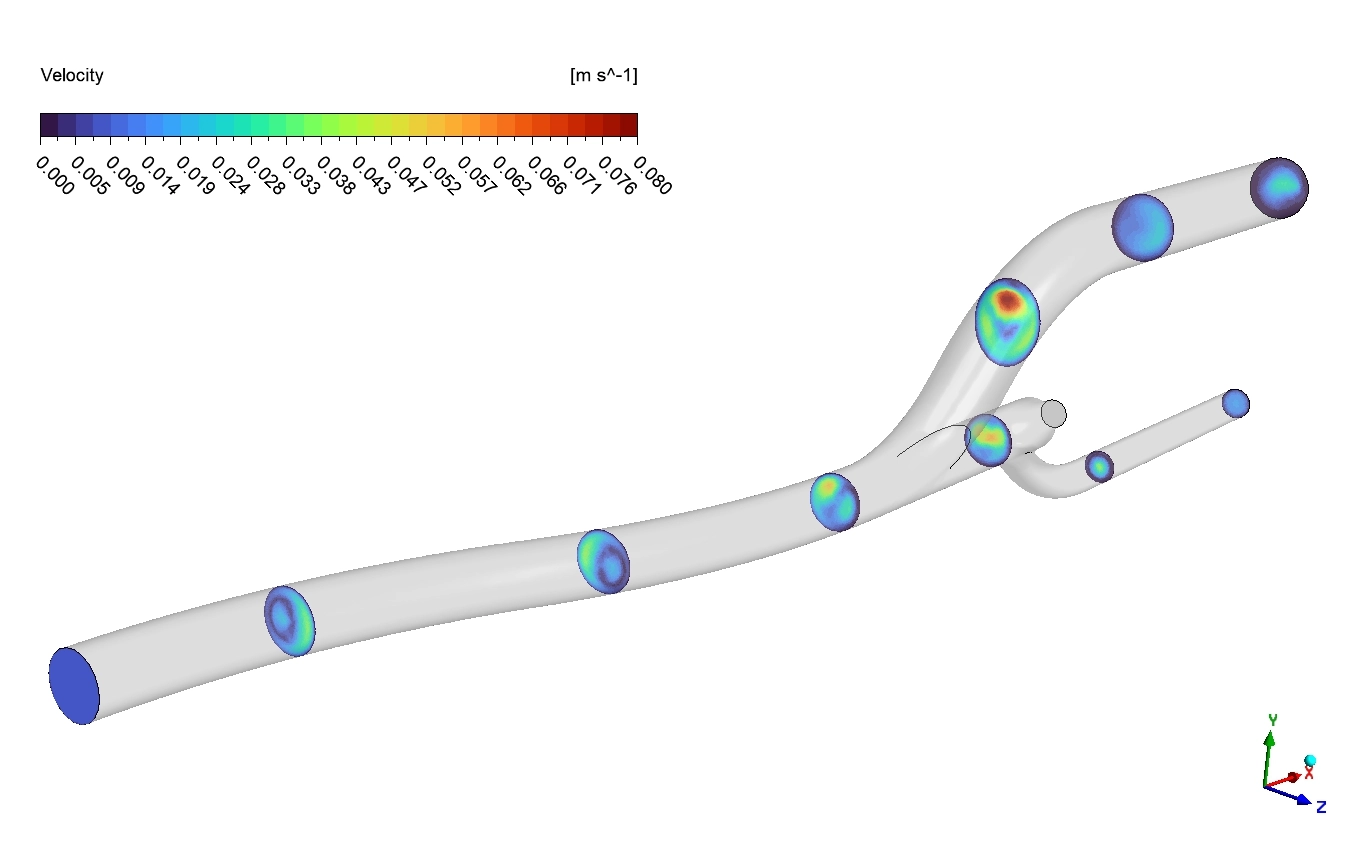
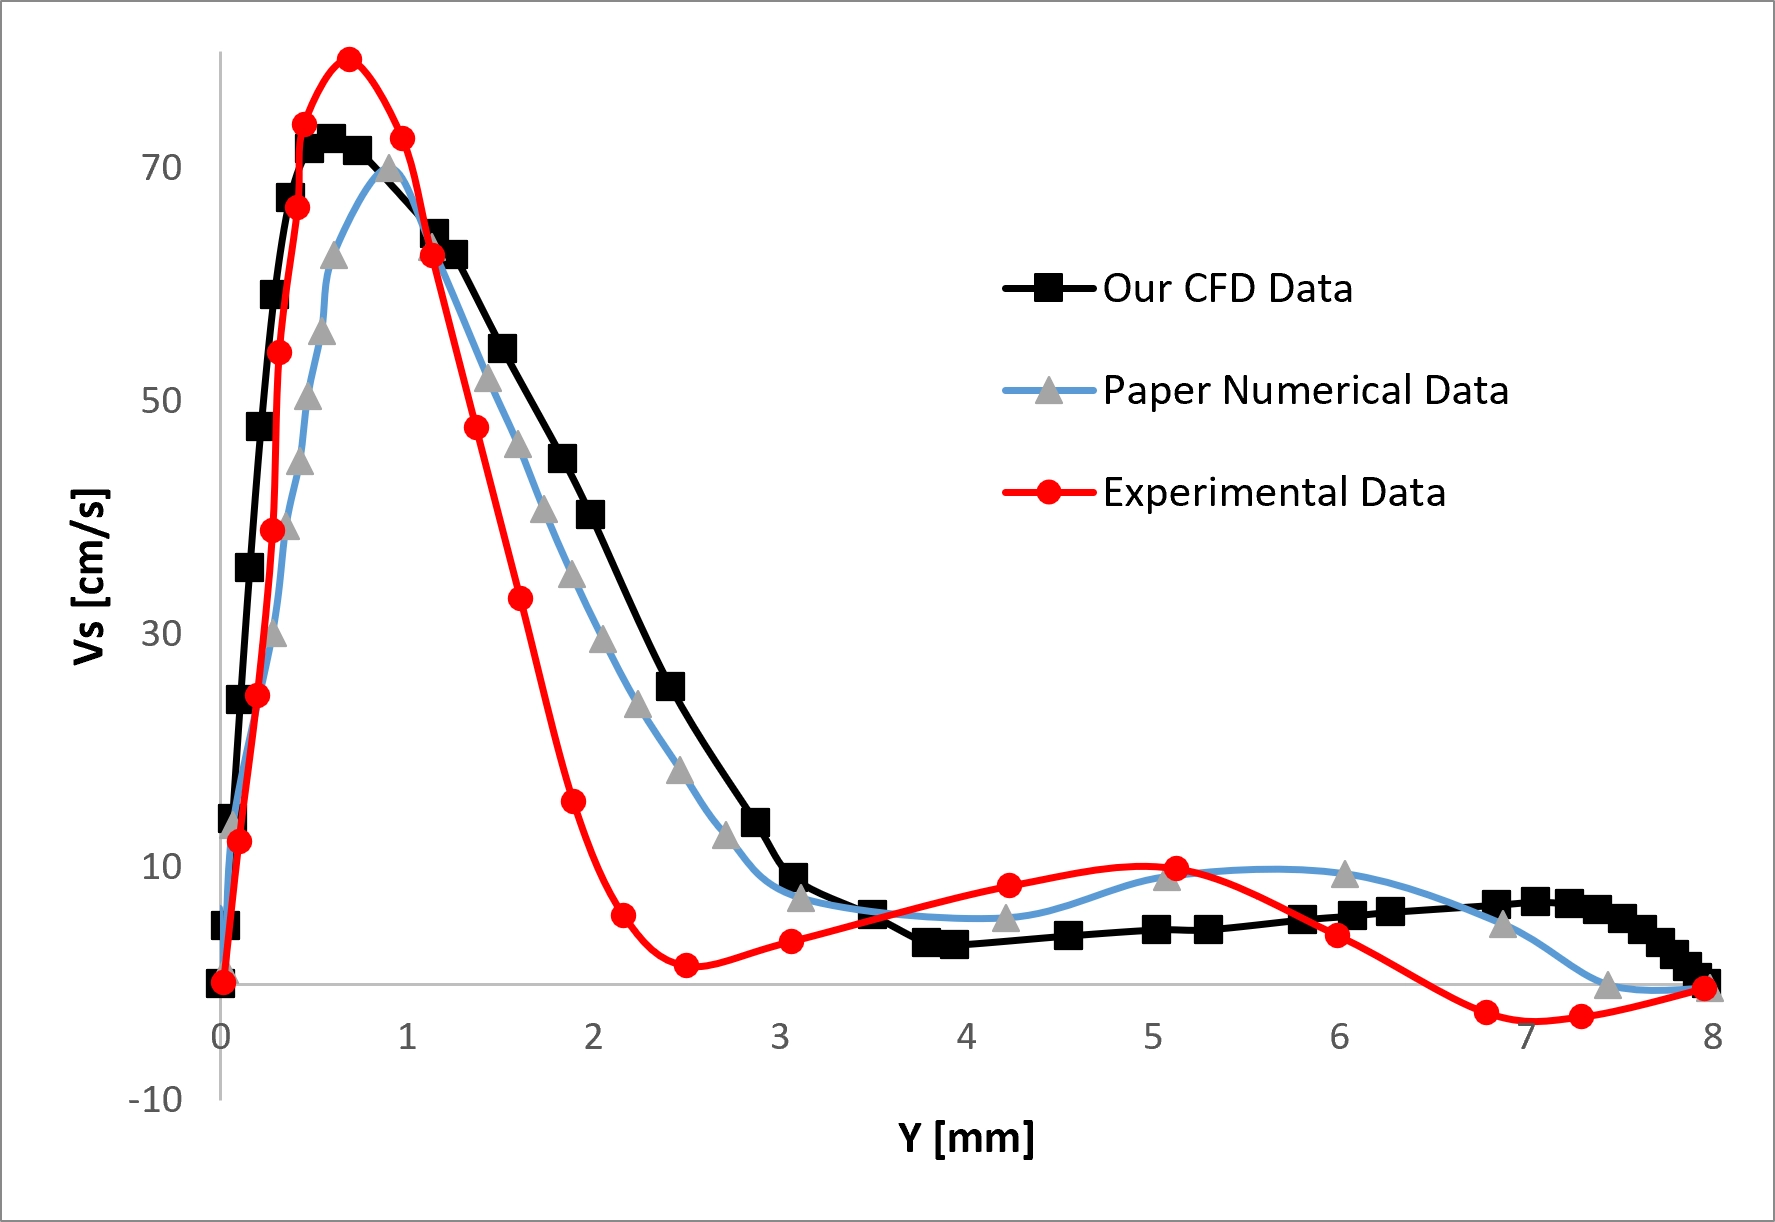
Inside the graft branch, the secondary velocity (Vs) chart tracks a fast-moving blood jet. This jet crashes near the inner wall, reaching a sharp peak of 71 cm/s to 72 cm/s at Y = 0.7 mm. This matches the physical experiment peak of 75 cm/s with a minor 5% difference. After this high-speed jet, between Y = 3.0 mm and 8.0 mm, the flow heavily decays and drops near zero.
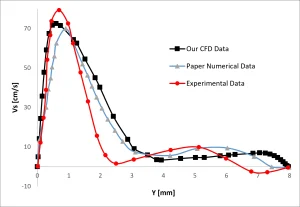
Figure 4: Validation of the secondary velocity (Vs) profile inside the graft section.
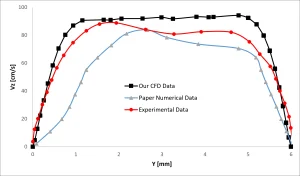
Figure 5: The axial velocity (Vz) profile showing the central core speed and wall friction.
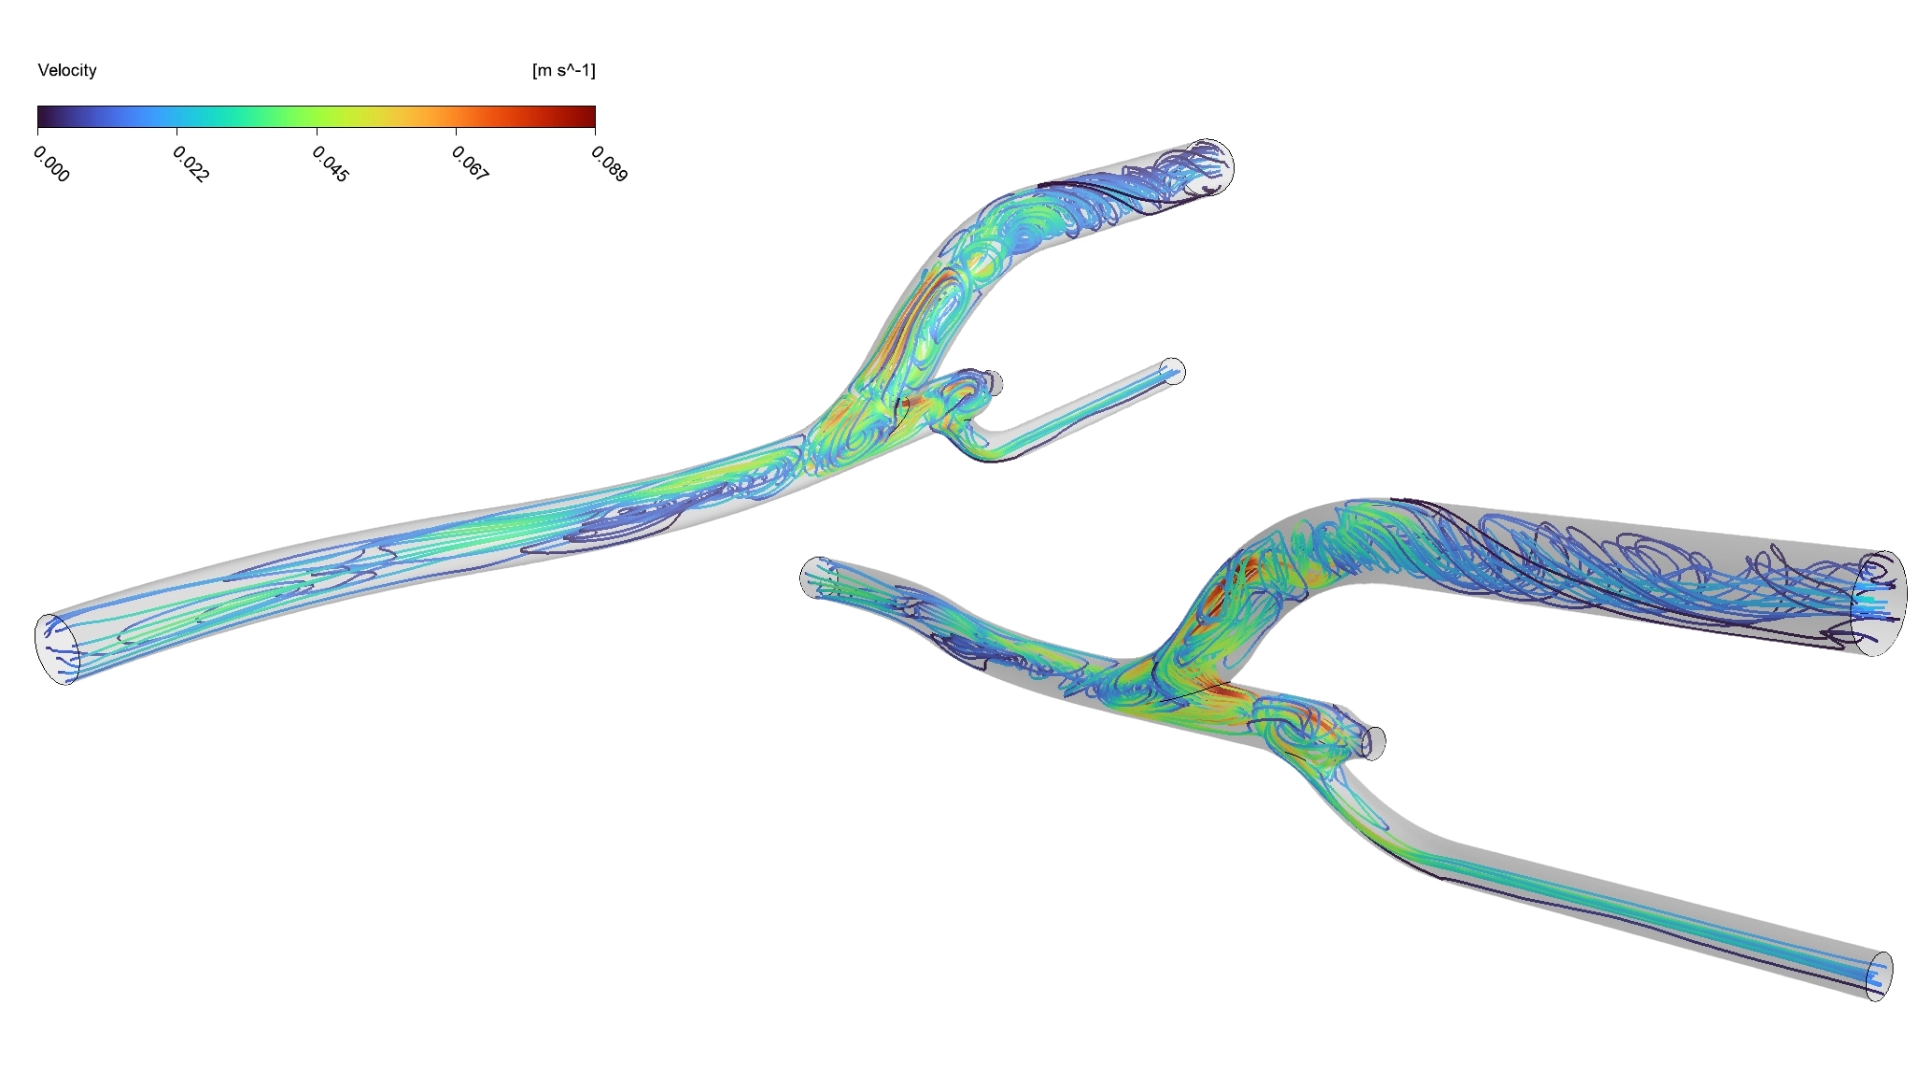
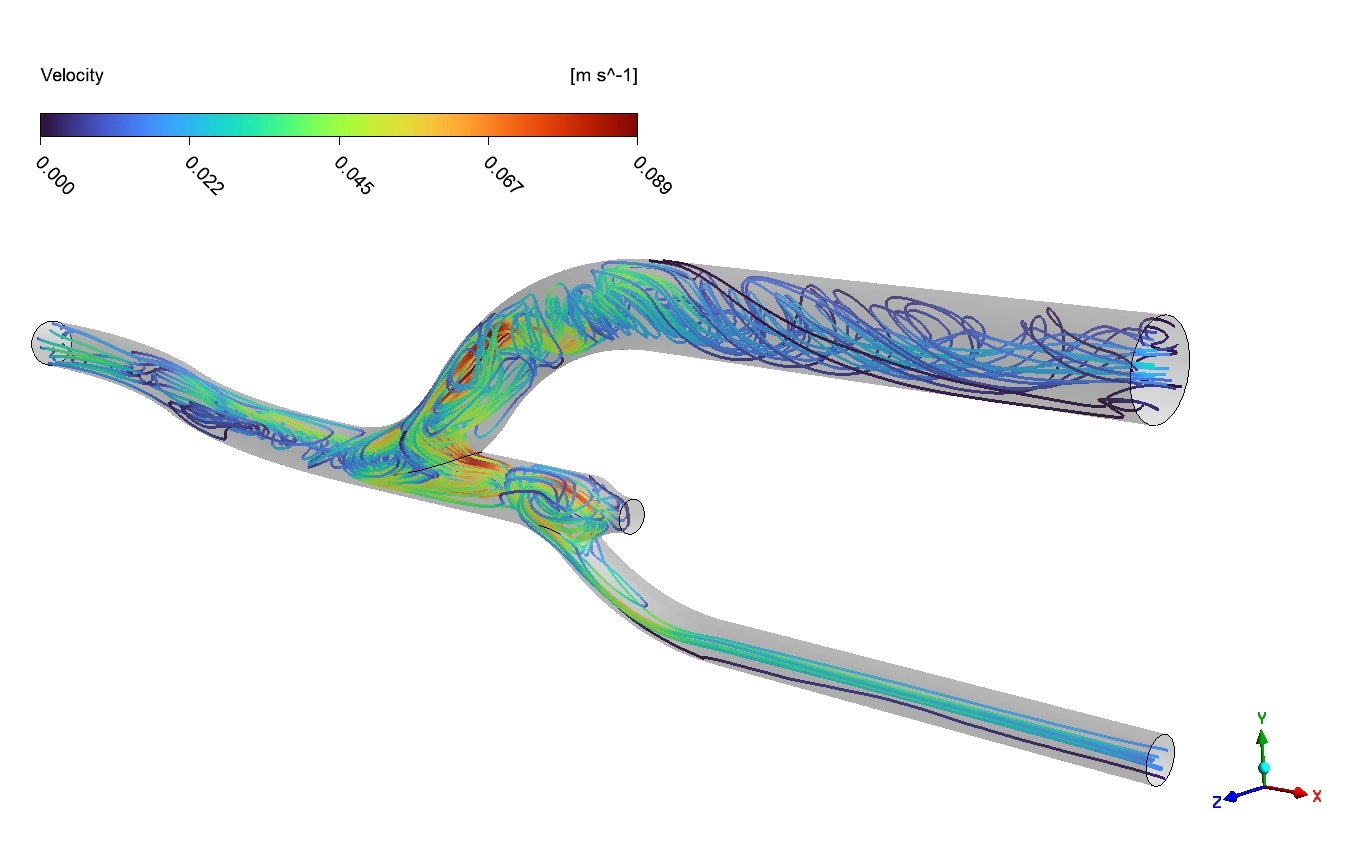
The 3D velocity streamlines physically explain this sudden velocity drop. As the fast jet shoots along the inner wall, the fluid physically separates from the outer wall. A large empty space forms. The blood curls backward into this space, spinning in a looping vortex-pair structure.
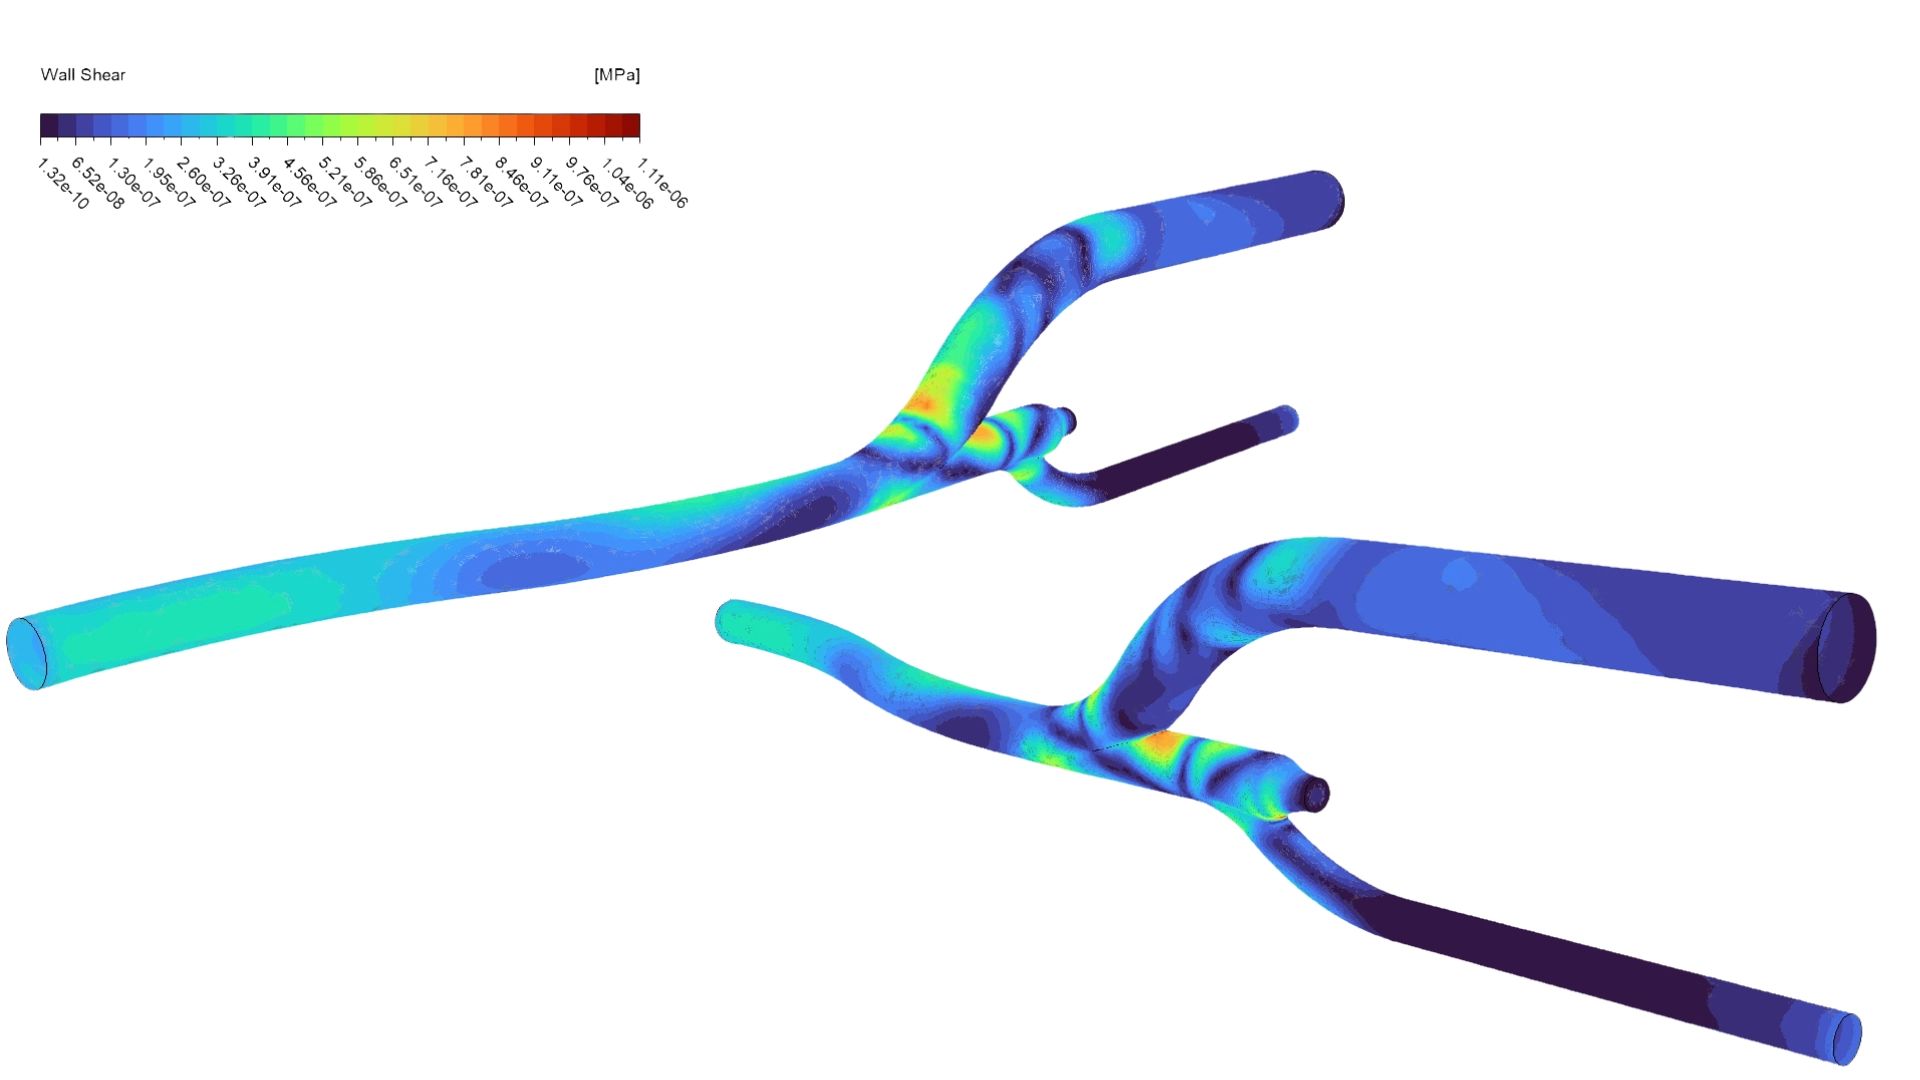
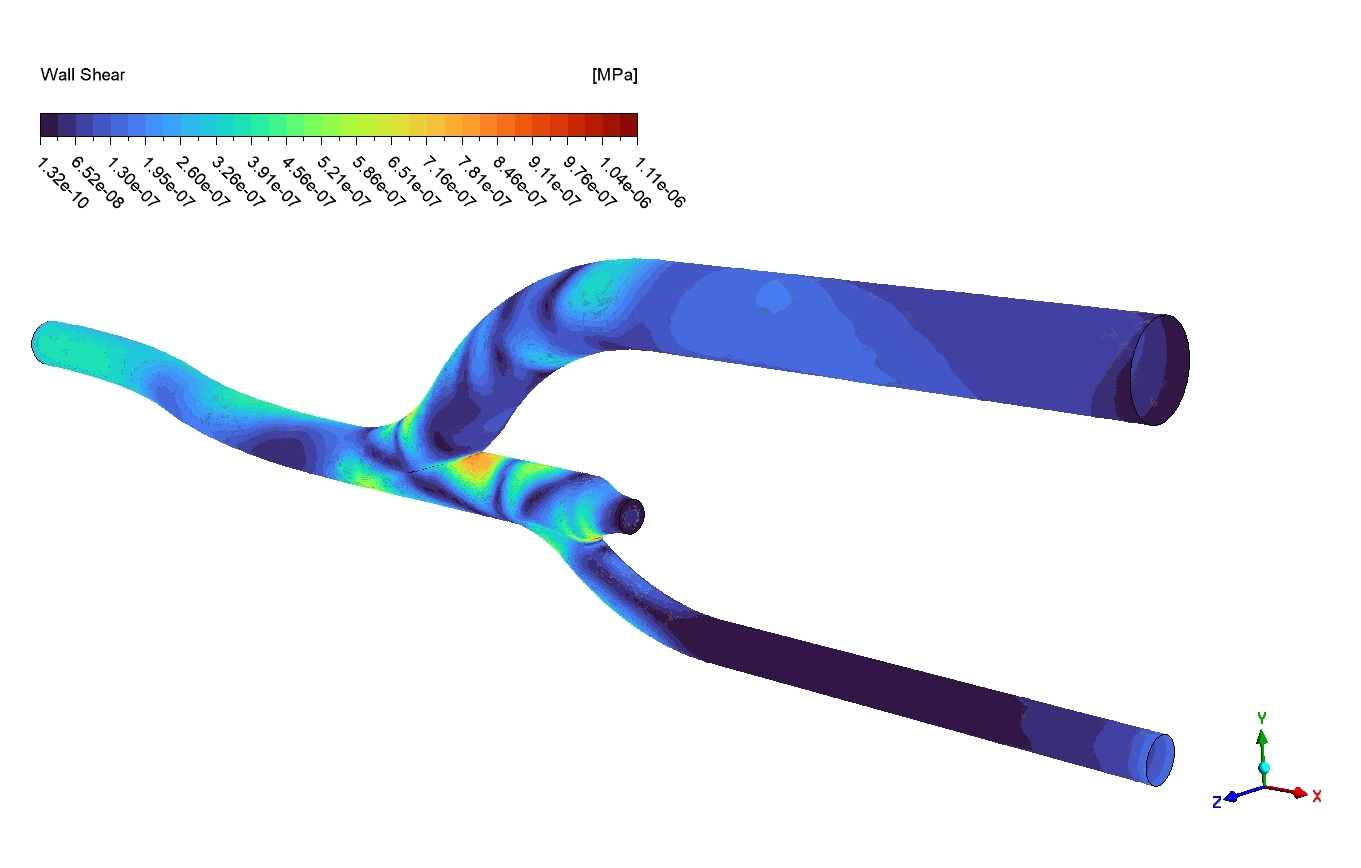
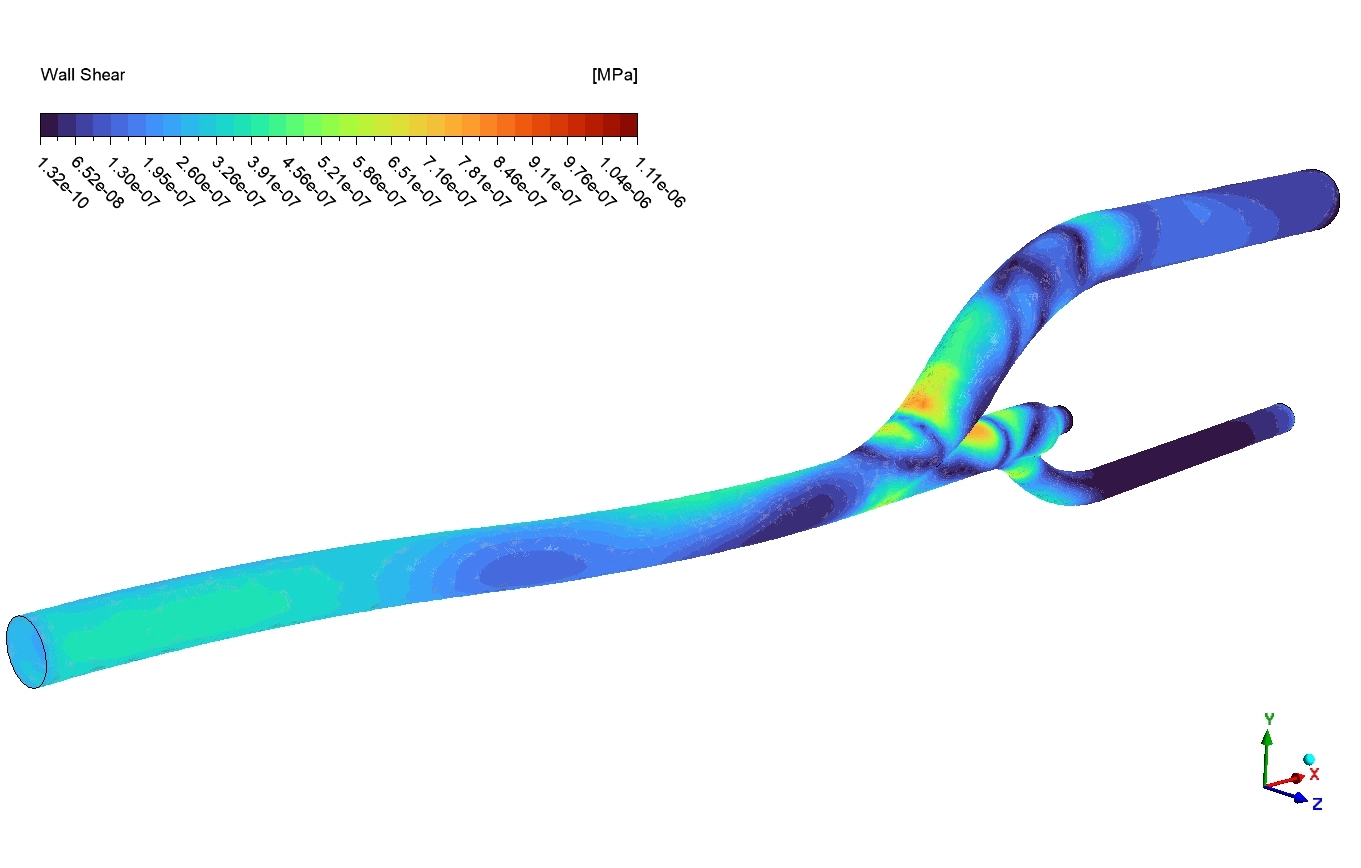
This trapped, spinning fluid directly damages the vessel. The wall shear stress contour identifies the locations of this damage. Intense friction forces concentrate heavily where the central jet strikes the inner wall and where the vortex loops scrape the outer boundary. By predicting these dangerous friction zones, this blood pulsatile flow CFD study helps engineers design safer, longer-lasting bypass shapes.
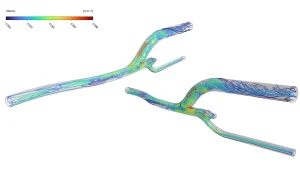
Figure 6: The three-dimensional vortex-pair structure forming on the outer vessel wall.
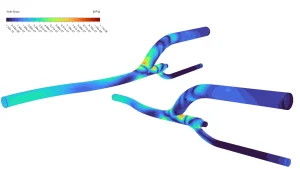
Figure 7: The physical wall shear stress distribution across the arterial network.
FAQ About Hemodynamic Physics
- Why do we use two profiles for the boundaries conditions? The bypass geometry splits the blood into different branches. Using two distinct, time-dependent flow rate curves ensures the fluid entering the system perfectly mimics the natural human heartbeat cycle.
- What creates the recirculation zone in the graft tube? When the high-speed blood jet enters the angled graft, it crashes into the inner wall. This leaves a low-pressure empty space on the opposite outer wall, causing the blood to curl backward and spin in a stagnant loop.
- Why is wall shear stress important in vascular surgery? Unnatural friction forces damage the sensitive cells lining the blood vessel. High wall shear stress or stagnant looping blood can trigger the body to form new blood clots, causing the surgical bypass to fail.





Reviews
There are no reviews yet.