

The Savonius wind turbine is a unique device in the world of renewable energy. Unlike common propeller-type turbines, it is a Vertical Axis Wind Turbine (VAWT). This means it spins around a vertical pole, allowing it to catch wind from any direction without needing to turn its head. It operates primarily on drag, using its cup-shaped blades to “catch” the wind. While simple, understanding its complex aerodynamics requires advanced 2D Savonius turbine simulation.
Engineers love the Savonius design for its self-starting ability and low noise. However, optimizing the blade shape for maximum efficiency is difficult. This is where CFD simulation becomes essential. By using ANSYS Fluent, we can visualize the airflow and calculate the forces on the blades. This report details a 2D Savonius VAWT study, guided by the design principles found in the paper by Talukdar et al. [1]. For those interested in green energy technology, please explore our Renewable energy tutorials. This guide focuses on the setup and aerodynamic analysis of the rotor.
- Reference [1]: Talukdar, Parag K., Vinayak Kulkarni, and Ujjwal K. Saha. “Performance Characteristics of Vertical-Axis Off-Shore Savonius Wind and Savonius Hydrokinetic Turbines.” International Conference on Offshore Mechanics and Arctic Engineering. Vol. 51319. American Society of Mechanical Engineers, 2018.
- Reference [2]: Farajyar, Shayan, et al. “CFD investigation and optimization on the aerodynamic performance of a Savonius vertical axis wind turbine and its installation in a hybrid power supply system: A case study in Iran.” Sustainability 15.6 (2023): 5318.
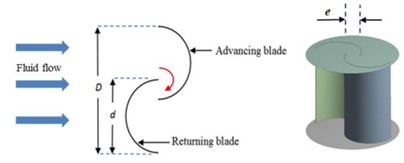
Figure 1: Schematic view of the Savonius turbine geometry used in the CFD simulation. [1].
Simulation Process: Sliding Mesh and Turbulence Modeling
The simulation begins with the geometry creation in ANSYS Design Modeler. The rotor has a diameter of nearly 200mm. In a 2D Savonius turbine CFD project, we split the domain into two parts: a stationary outer zone and a rotating inner zone containing the blades. This setup is crucial for simulating the actual rotation. For the mesh, we generated a high-quality grid. It is essential to have fine cells near the blade walls to capture the boundary layer. In ANSYS Fluent, we used the Sliding Mesh technique (also called Mesh Motion). This physically rotates the inner mesh at every time step, allowing accurate transient simulation of the blade’s movement. To solve the complex airflow, we selected the k-omega SST turbulence model. This model is the best choice for VAWT CFD simulation because it accurately predicts flow separation and the wake behind the blades. We also paid close attention to the Reference Values (like area and radius) to ensure the Torque coefficient is calculated correctly.
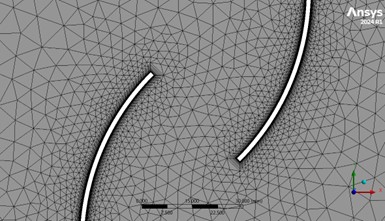
Figure 2: Detailed view of the boundary layer mesh around the Savonius blades.
Post-processing: Wake Analysis and Torque Coefficient
The results of the Fluent simulation provide deep insights into the turbine’s performance. First, we examine the Torque Coefficient (CQ). This is a dimensionless number that tells us how much turning force the wind applies to the rotor. It is calculated using the equation:

Figure 3 shows the plot of this coefficient over time. Since the simulation is transient (time-dependent), the torque fluctuates as the blades rotate. It takes some time for the flow to stabilize, so we only analyze the data after the fourth rotation. This plot is vital for determining the Power Coefficient (CP), which defines the overall efficiency of the 2D Savonius turbine.
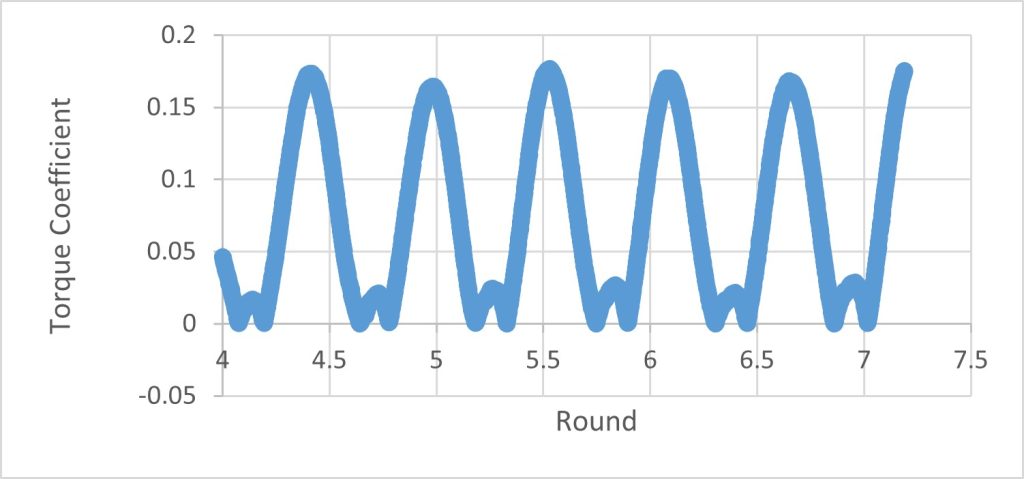
Figure 3: Torque coefficient plot showing the cyclic performance of the Savonius rotor.
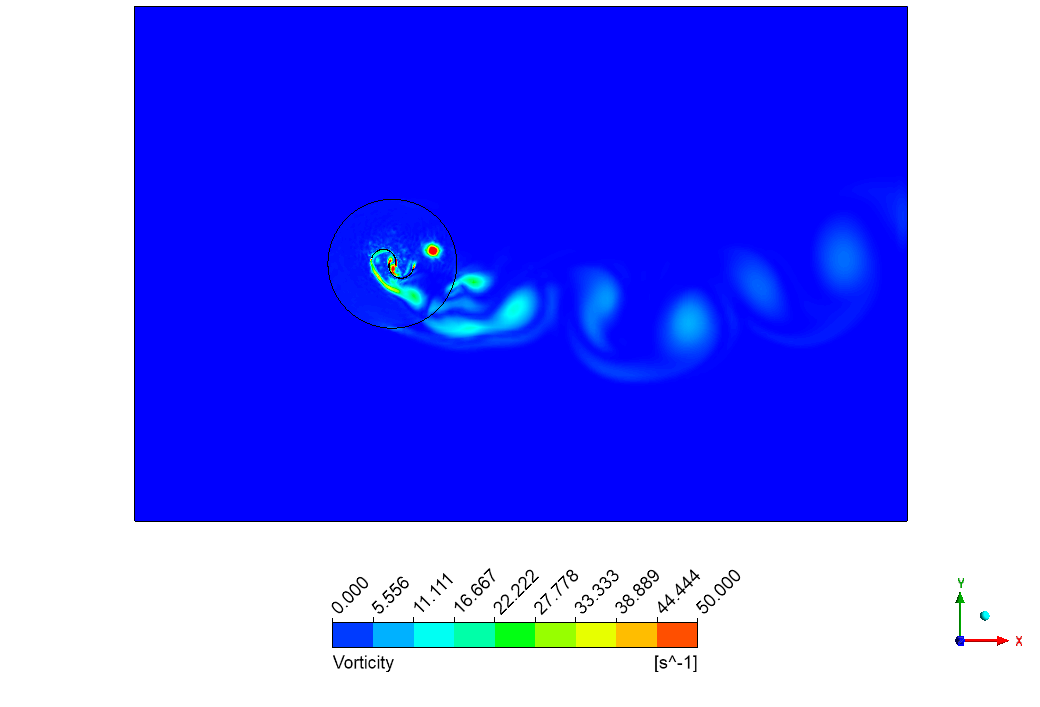
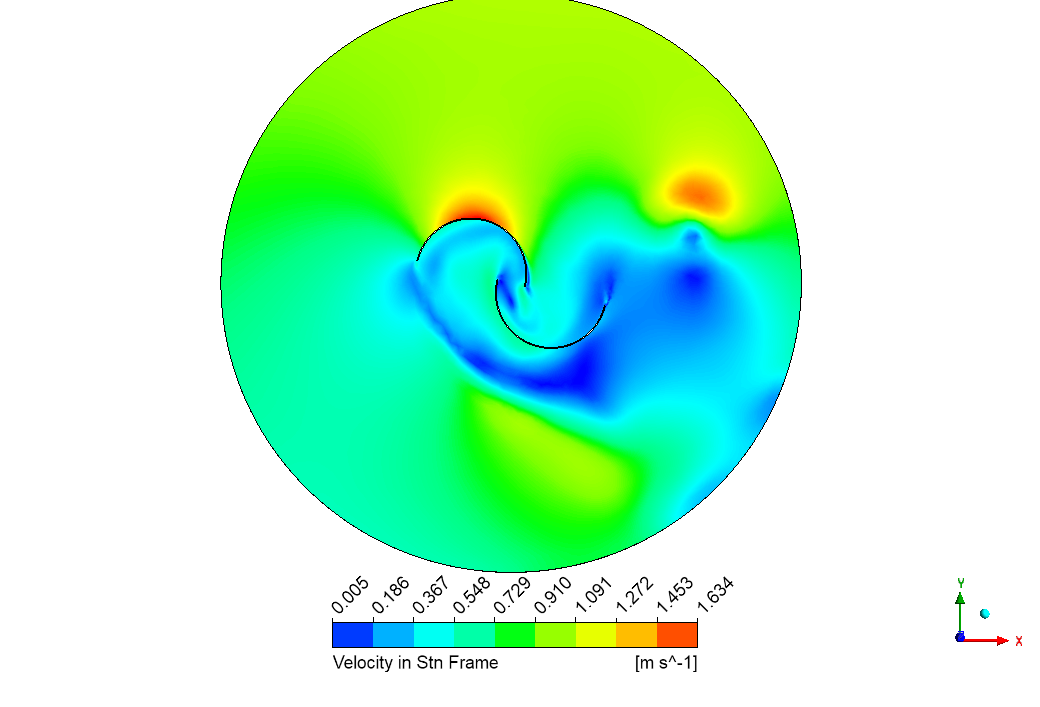
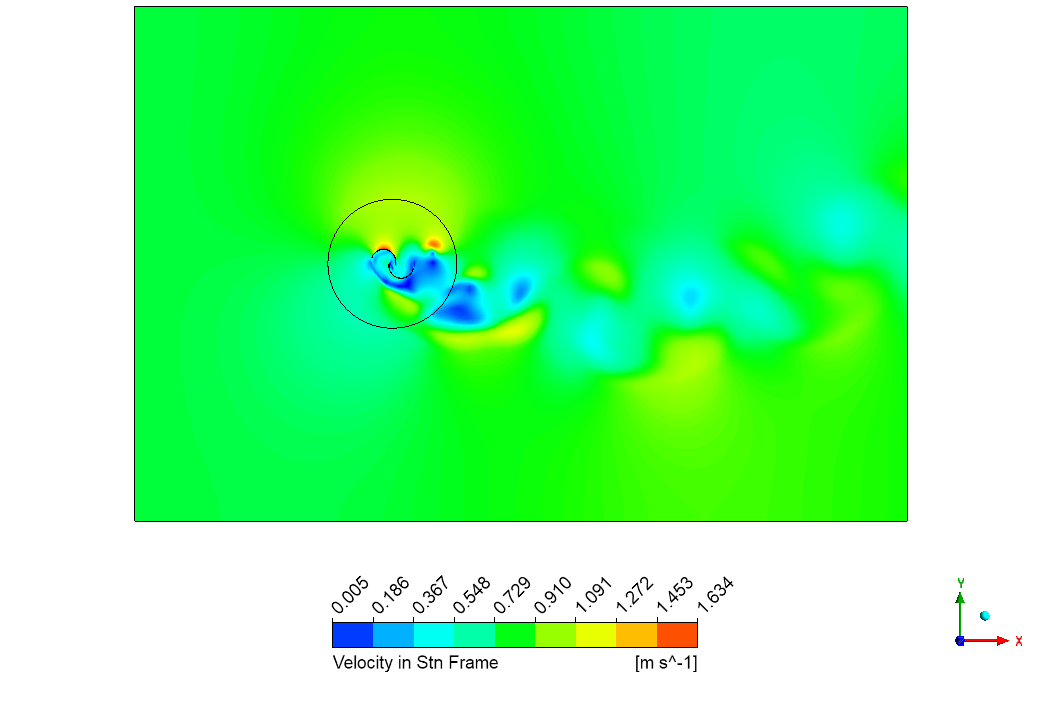
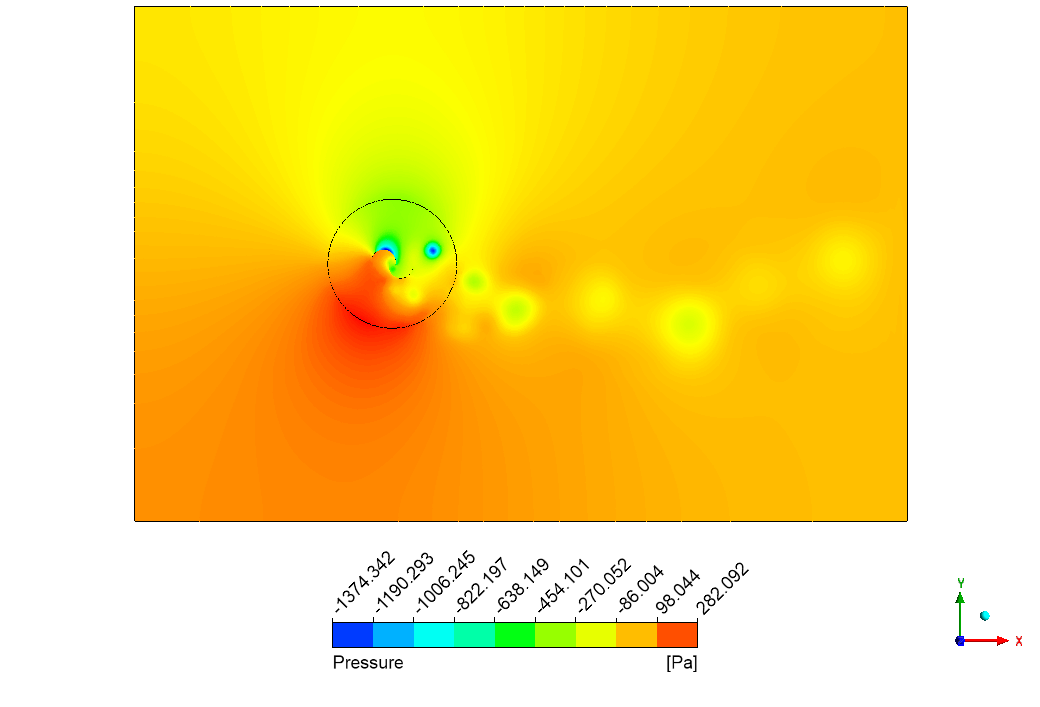
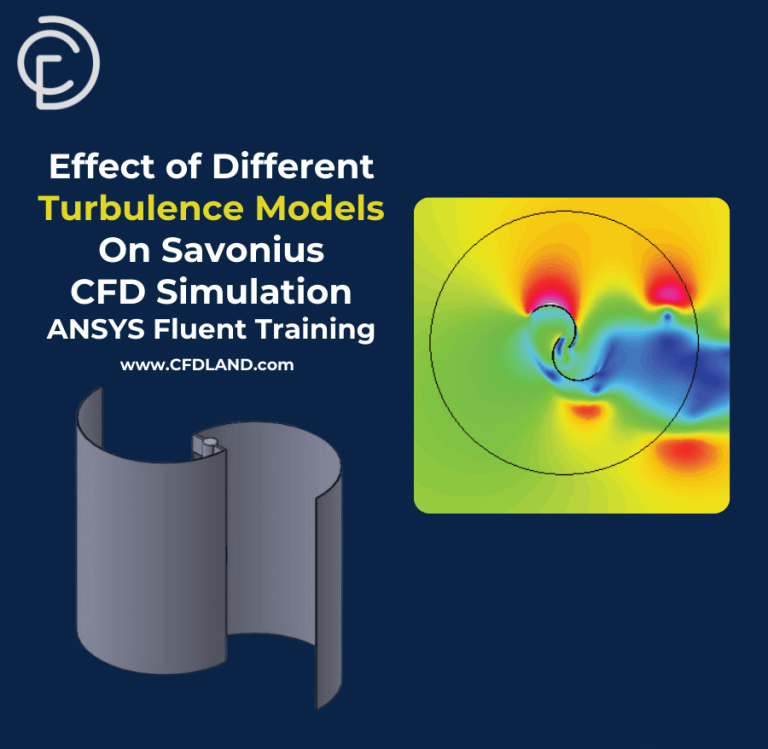
Next, we analyze the airflow physics in Figure 4. The velocity contour reveals the complex wake behind the turbine. The velocities in the domain range from 0.005 m/s to a maximum of 1.634 m/s.
- High Velocity: We see red and yellow zones near the tips of the blades where the air accelerates.
- Low Velocity (Wake): Behind the rotor, there is a large blue region representing the momentum deficit. This is where the turbine has extracted energy from the wind.
- Vortex Shedding: The contour clearly shows distinct vortices (swirling air) shedding off the blades. These alternating high and low-velocity zones extend 3-4 diameters downstream. This “Karman vortex street” effect is typical for drag-based turbines. The Sliding Mesh technique in Ansys Fluent perfectly captures this interaction between the rotating blades and the stationary air, proving that the 2D Savonius turbine simulation is capturing the real-world physics of the flow.

Figure 4: Velocity contour showing the wake region and vortex shedding behind the Savonius turbine.
Key Takeaways & FAQ
- Q: Why is the Savonius turbine called “drag-based”?
- A: Unlike a standard wind turbine that uses lift (like an airplane wing), a 2D Savonius turbine works because the wind pushes harder on the cup side than the rounded side. This difference in drag force causes it to spin.
- Q: What is the Sliding Mesh technique?
- A: Sliding Mesh is a method in ANSYS Fluent where the mesh surrounding the turbine physically rotates during the simulation. It is the most accurate way to simulate VAWT CFD because it captures the transient interaction between the moving blades and the wake.
- Q: Why use the k-omega SST turbulence model?
- A: The flow around a Savonius turbine involves massive separation (stalling) and swirling vortices. Standard models like k-epsilon often fail here. k-omega SST is designed to handle these separation zones near the walls, making it ideal for 2D Savonius turbine simulation.


Reviews
There are no reviews yet.