

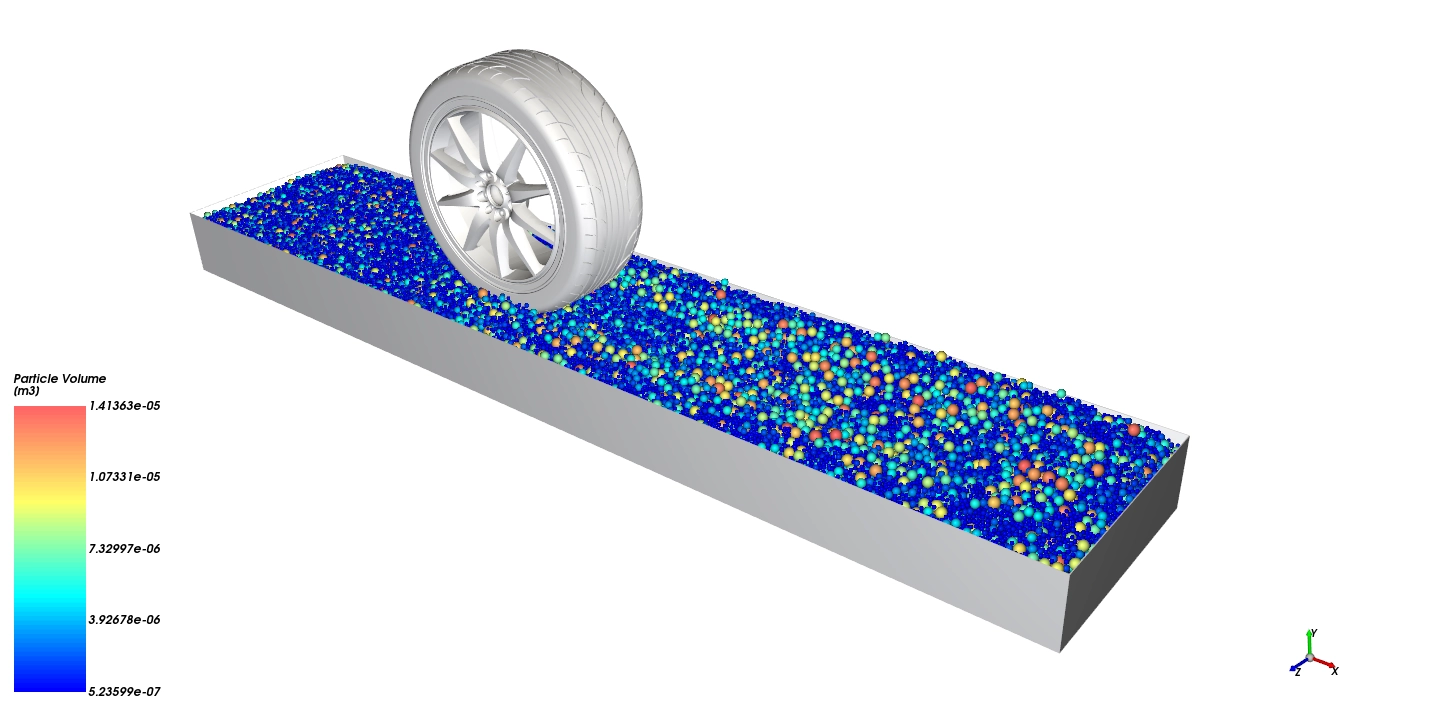
Driving a heavy car on loose desert sand is a very difficult and dangerous challenge. The rubber tires often sink deep into the ground, which causes the vehicle to lose grip and get completely stuck. To solve this major problem before building real vehicles, smart engineers perform a Wheel Motion on Sandy Road DEM simulation to see exactly how the tires push and compress the small sand grains. Instead of driving real cars in the desert and spending a lot of money, designers use this highly accurate computational representation to track millions of small rocks and measure the exact traction grip of the tire. This engineering test helps tire manufacturers build better and wider wheels that drive safely over soft ground. To learn more about how software calculates the complex movement of thousands of particles, please explore our comprehensive DEM tutorials. Practicing this tutorial project will give you the perfect skills to solve real automotive challenges.

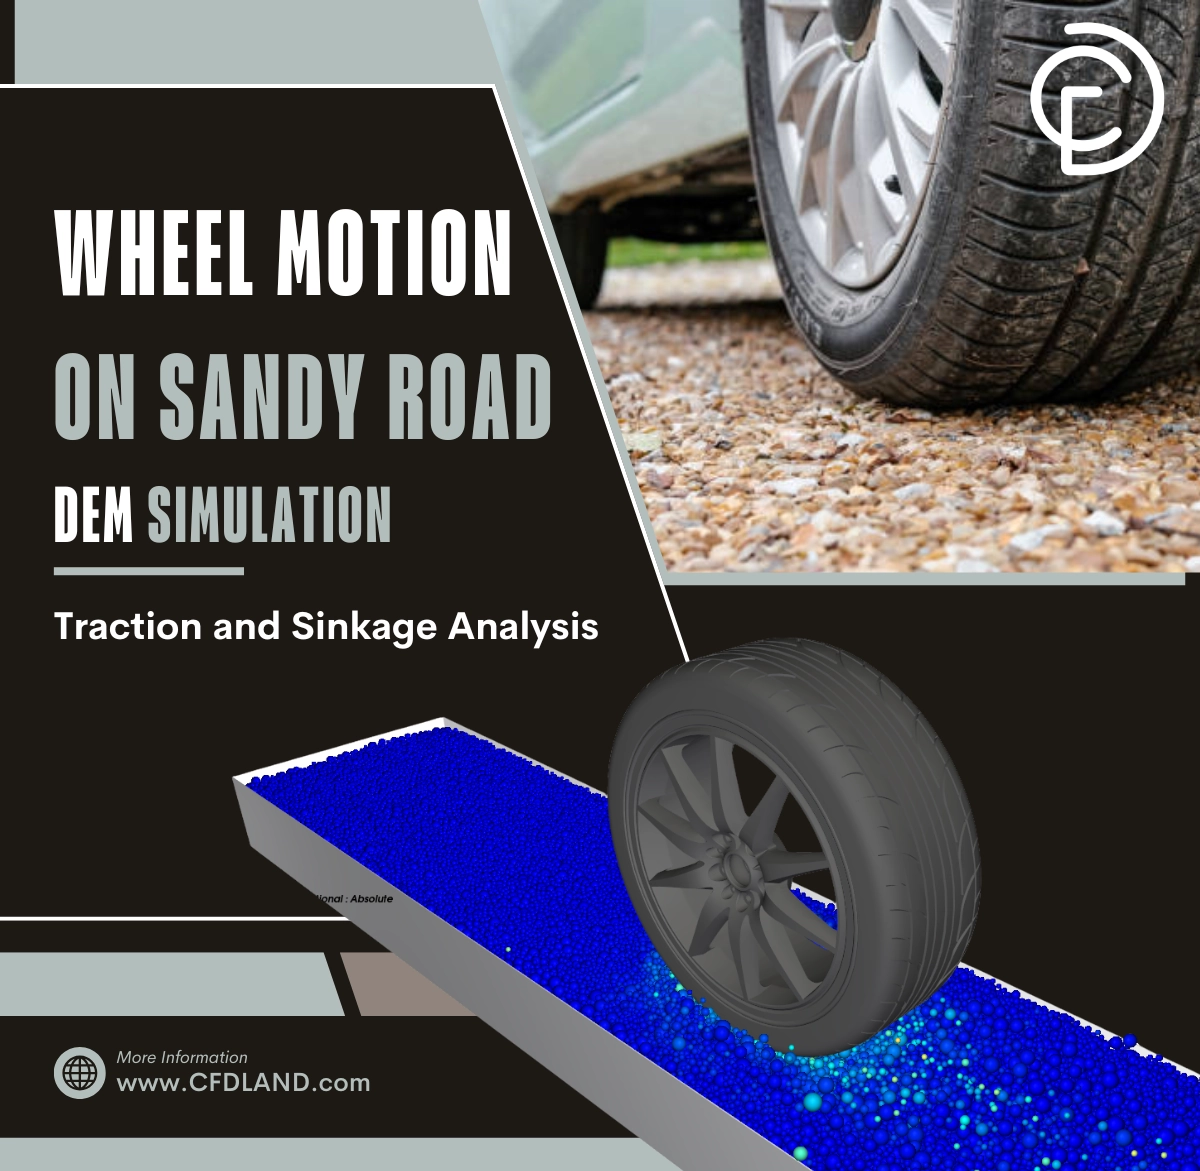
Figure 1: Car wheel motion on gravel and sand road, showing the initial 3D geometry of the tire and the granular terrain.
Simulation Process: Boundary Collision Statistics and Rocky DEM Setup
For this automotive off-road project, we built a highly accurate 3D geometry of a rubber tire and a long, flat sandy road. We imported these parts into the Rocky DEM software to run the complex wheel motion simulation. We completely filled the road area with hundreds of thousands of different sand and gravel particles ranging from 1 to 3 cm in diameter. This creates a highly realistic loose terrain. We strictly did not use a standard 6DOF solver for this test. Instead, we activated the special Boundary Collision Statistics module inside Rocky. This smart module acts perfectly like a 6DOF system because it correctly calculates all the pushing forces and twisting moments that the moving sand particles apply to the wheel surface.
We set the wheel to spin at a constant speed of 120 RPM, which matches a car driving at a moderate speed. Furthermore, we gave the wheel free translational motion. This means the heavy tire can naturally sink down into the sand or move forward when it grabs the ground. The software tracks every single collision between the rubber wheel and the small stones using the professional Hertz-Mindlin friction math rules. Finally, we extract all tangential and normal forces based on valid references to perfectly calculate the rolling resistance and traction power.
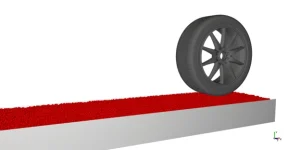
Figure 2: Wheel above the sand and gravel road initially, displaying the heavy tire waiting to drop onto the loose particle surface.
Post-processing: Analysis of Contact Forces and Sinkage Depth
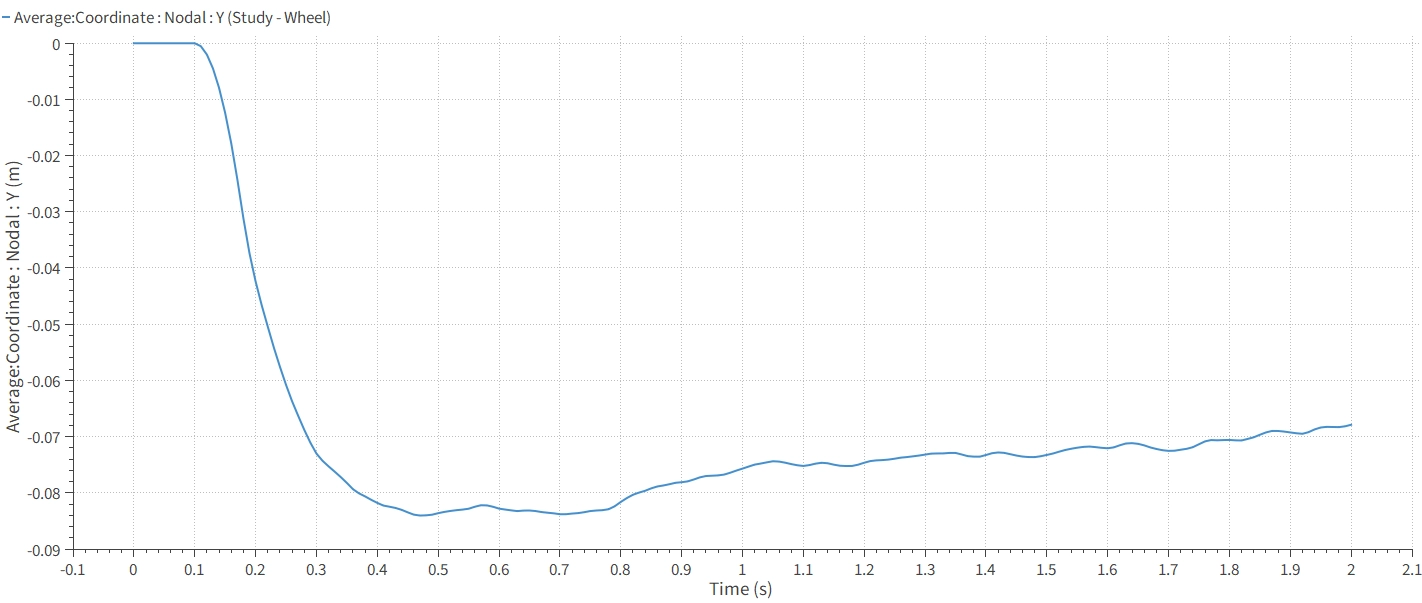
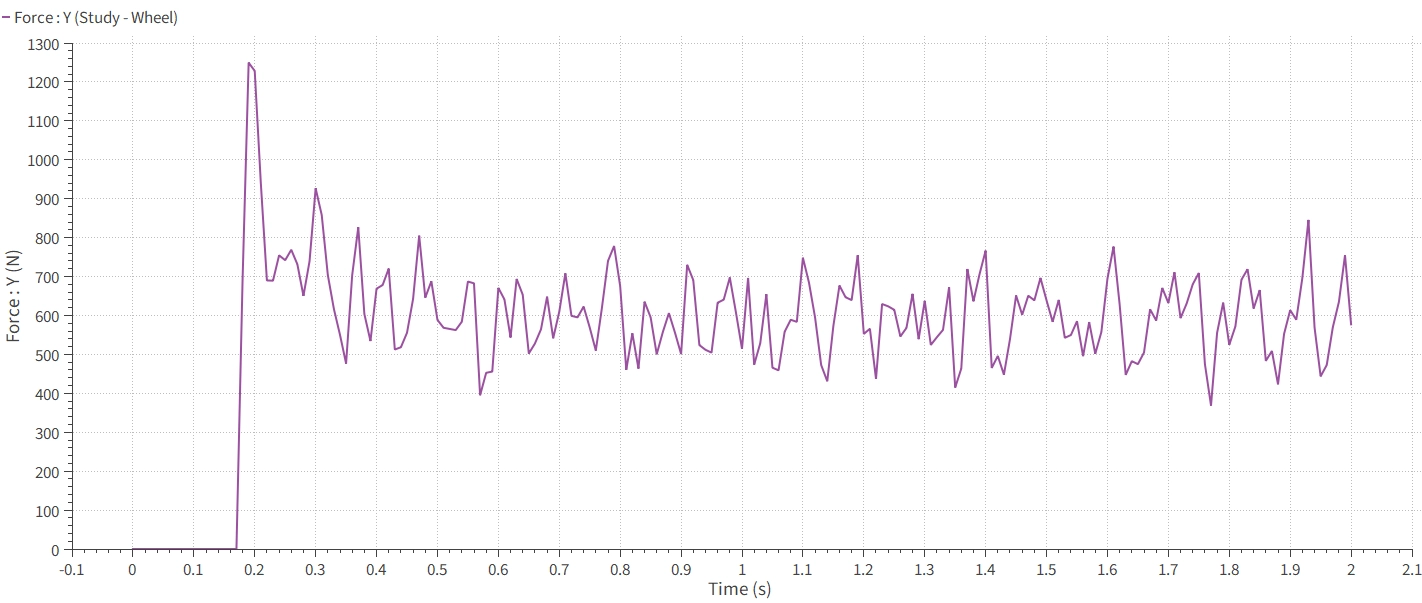
Let us carefully analyze the force graphs and velocity contours to explain the exact tire driving performance. First, we evaluate the Force Y Time History to measure the vertical bouncing of the wheel. When the test starts at 0.2 seconds, the heavy wheel drops and hits the sand very hard. This creates a massive initial impact spike of exactly 1250 N. After this first drop, the wheel stabilizes. The graph shows a steady average support force of 550 to 600 N, which exactly matches the static weight of the tire. However, the vertical force constantly jumps up and down between 400 and 800 N. These large force jumps of ±200 N prove that driving on sand is extremely rough. The wheel continuously hits small 3 cm stones, which creates heavy vibrations that will strongly shake a real car suspension.
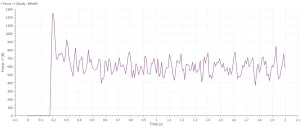
Figure 3: Force Y time history from Rocky DEM, showing the vertical wheel-sand reaction force from 0 to 1300 N over the 2.1-second test.
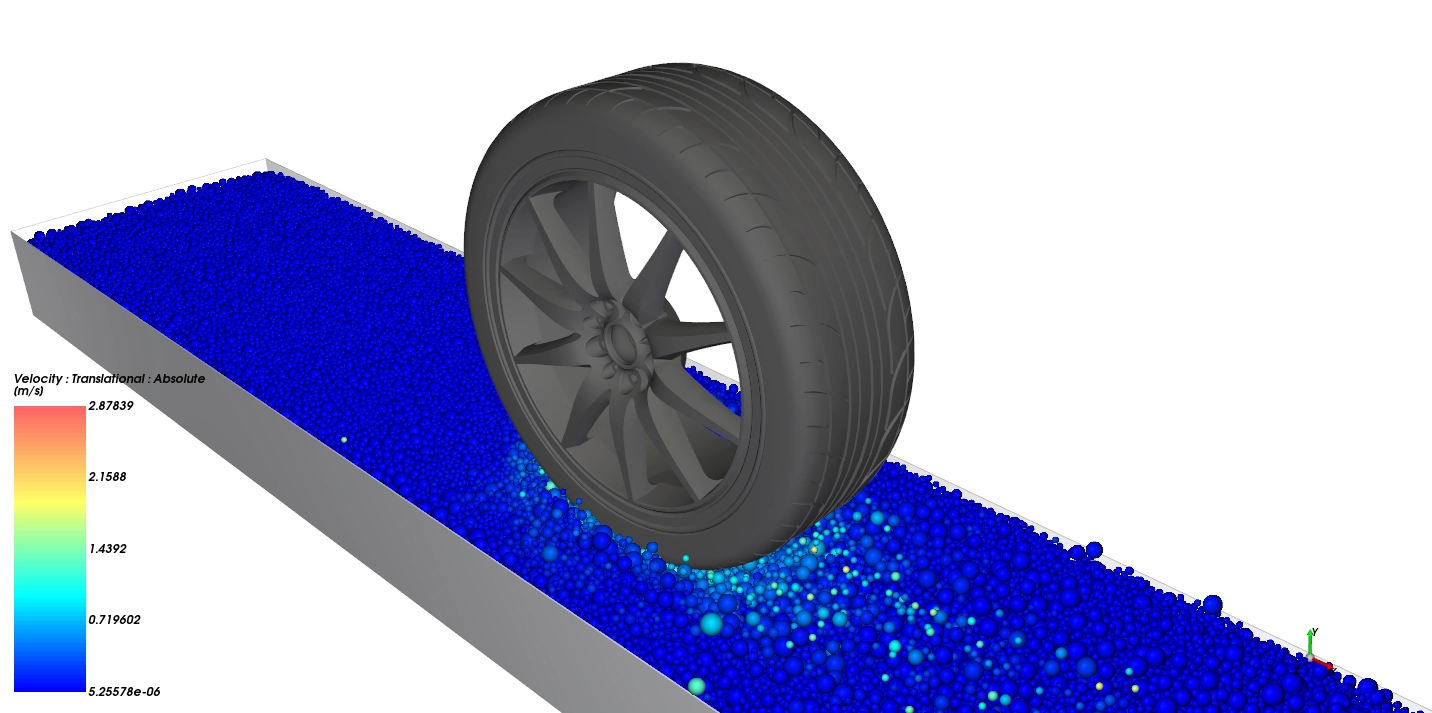
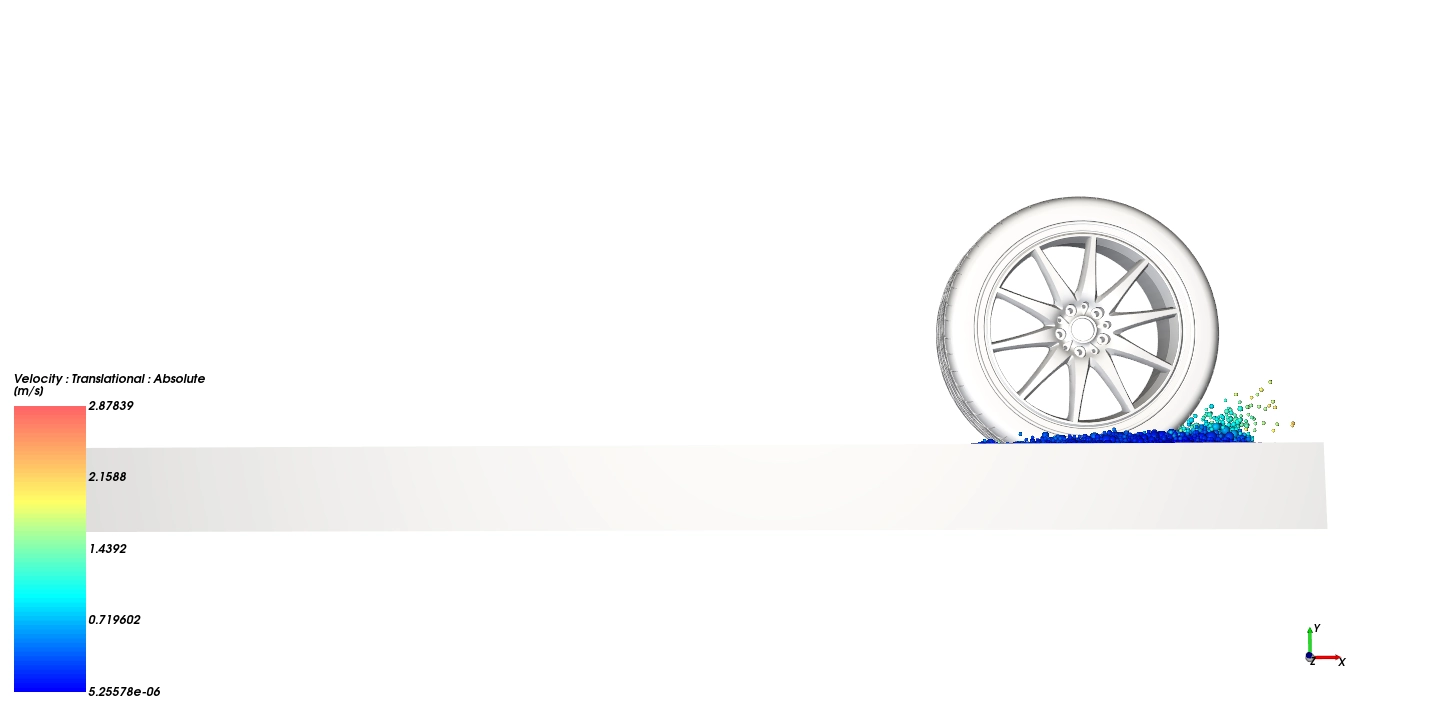
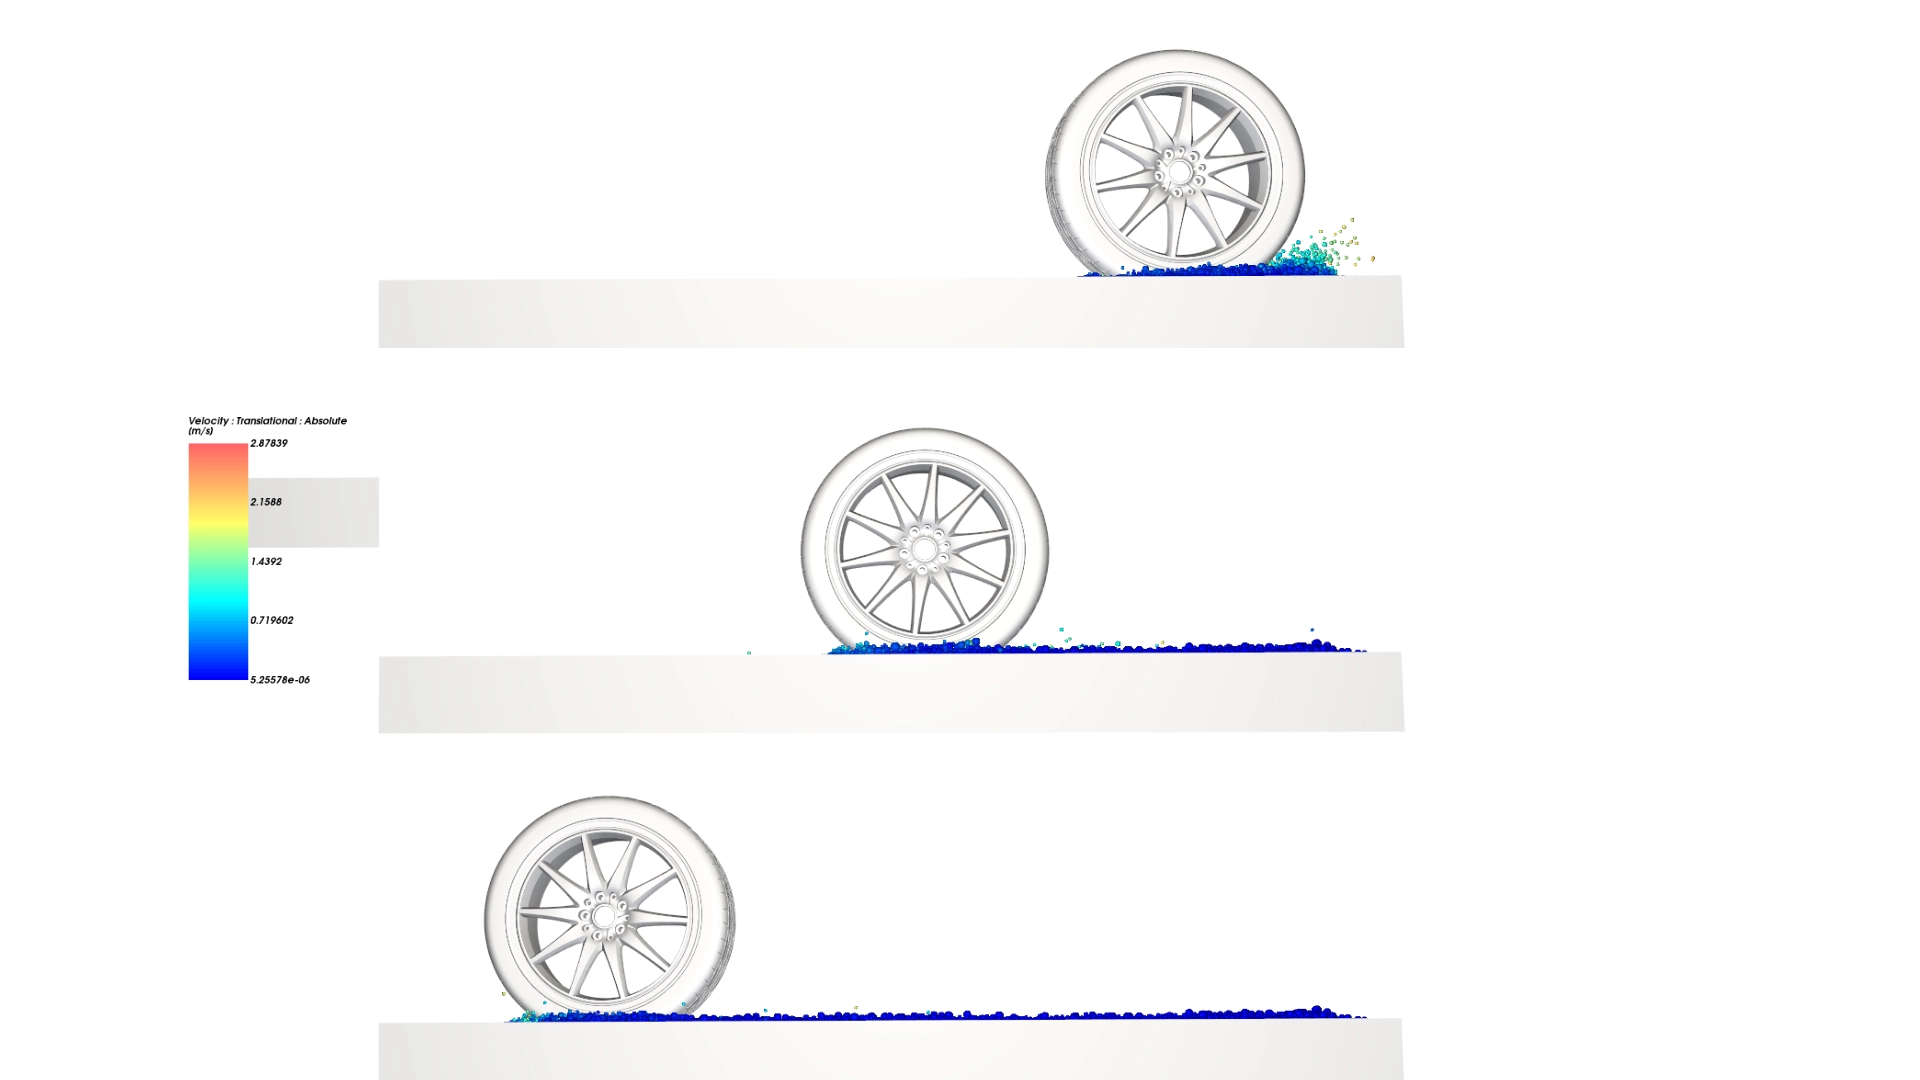
Next, we study the Translational Velocity Contours and the free wheel sinkage. As the wheel spins at 120 RPM, the free translational motion allows the tire to sink down 30 to 80 mm into the soft ground. The contours show cyan and green compressed sand under the tire moving at a speed of 0.72 to 1.44 m/s. Behind the moving tire, we clearly see a red rooster-tail of ejected sand flying at a fast speed of 2.16 to 2.88 m/s. This visual data is highly critical. It tells the designer exactly how much engine energy is lost to rolling resistance because the tire wastes power throwing heavy sand into the air.
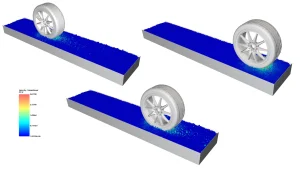
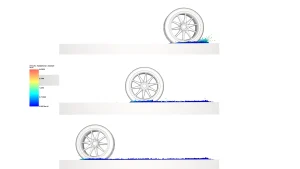
Figure 4: Velocity Translational contours from Rocky DEM (0.00 to 2.88 m/s), visualizing the fast red sand particles flying behind the moving wheel in a rooster-tail shape..
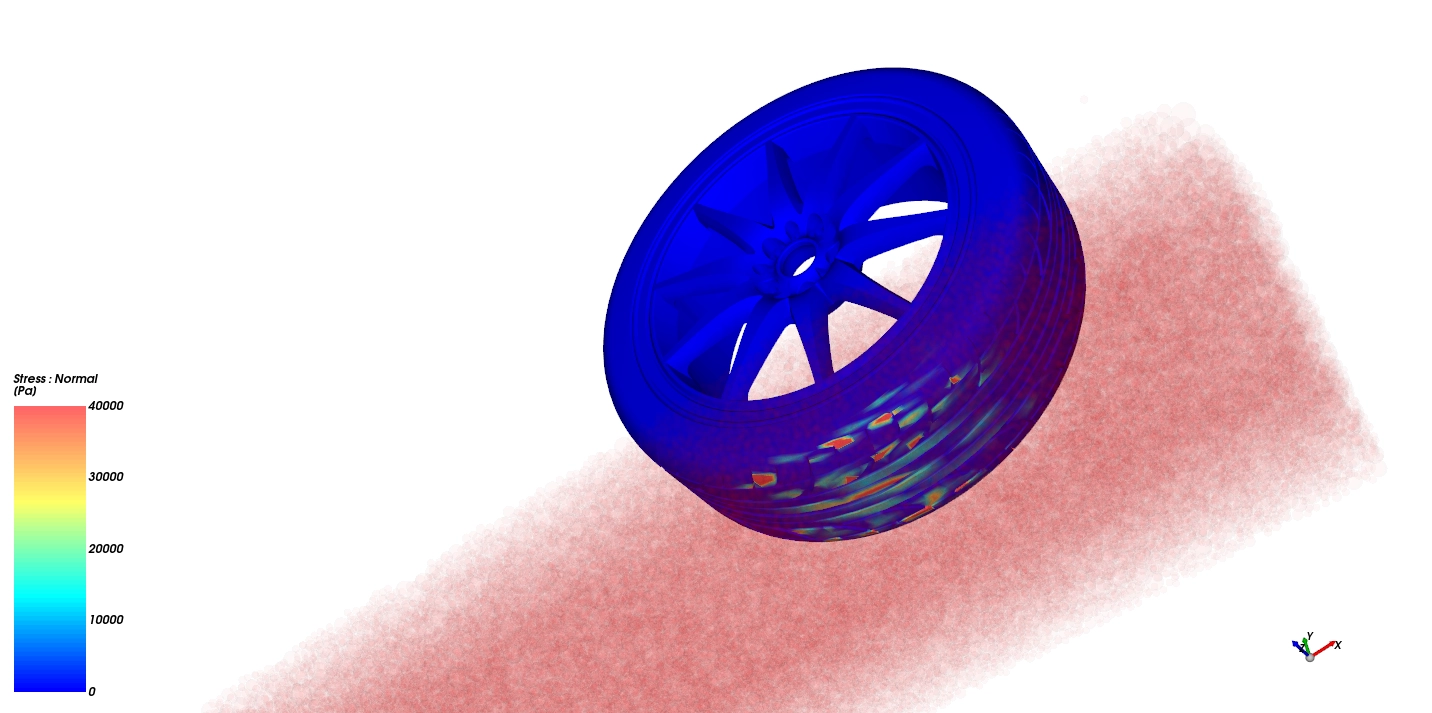
Finally, we analyze the Normal Stress Contours on the bottom surface of the tire. The colors show a maximum contact pressure of exactly 40,000 Pa (40 kPa) located near the trailing edge where the treads push off the sand. A normal car tire on a hard city road feels over 200 kPa of pressure. Because the average stress here is only 40 kPa, it mathematically proves that the loose sand cannot support heavy weight. This design change will spread the heavy vehicle weight over millions of more sand particles and stop the tire from sinking.

Figure 5: Normal Stress on the wheel surface from Rocky DEM (0 to 40,000 Pa), illustrating the rainbow pressure bands where the rubber tire strongly pushes against the sand.
Frequently Asked Questions (FAQ)
- What is the Boundary Collision Statistics module in Rocky DEM?
- This is a smart mathematical tool inside the software that acts just like a 6-Degree of Freedom (6DOF) solver. It accurately calculates all the normal forces, pushing forces, and twisting moments created when thousands of sand particles hit the moving tire.
- Why does the vertical force jump between 400 and 800 N?
- The sand is not perfectly smooth; it contains hard stones up to 3 cm in diameter. When the tire rolls over these stones, it causes the wheel to bounce up and down. This creates heavy vibrations and large force jumps of ±200 N.


Reviews
There are no reviews yet.