


In the medical field, a cerebral aneurysm is a highly dangerous condition. It occurs when a weak spot in a brain artery expands like a balloon, creating a blood-filled sac. If the blood pressure inside the artery becomes too strong, this weak sac can rupture, causing a life-threatening brain hemorrhage. To help doctors prevent this, engineers use fluid mechanics to study the exact blood flow behavior inside the brain. Throughout this educational guide, we will mathematically explore a Cerebral Aneurysm CFD analysis to understand exactly how blood pressure and velocity damage the vessel walls over time. Please note that this specific bioengineering project serves purely as an educational demonstration of hemodynamics and is absolutely not a validation study. Running a Cerebral Aneurysm fluent simulation helps researchers locate the exact danger zones where a rupture might happen. Inside the software, engineers import the patient-specific geometry and mathematically measure the forces acting on the fragile tissue. Calculating these complex internal forces requires a very strong understanding of human blood flow, viscosity, and pressure changes. To deeply learn how to simulate biological fluids moving through complex anatomical structures, please carefully explore our comprehensive Bioengineering tutorials.
- Reference [1]: Shojima, Masaaki, et al. “Magnitude and role of wall shear stress on cerebral aneurysm: computational fluid dynamic study of 20 middle cerebral artery aneurysms.” Stroke11 (2004): 2500-2505.
- Reference [2]: Lim, Sheh Hong, et al. “Study of extracted geometry effect on patient-specific cerebral aneurysm model with different threshold coefficient (Cthres).” CFD Letters10 (2020): 1-14.
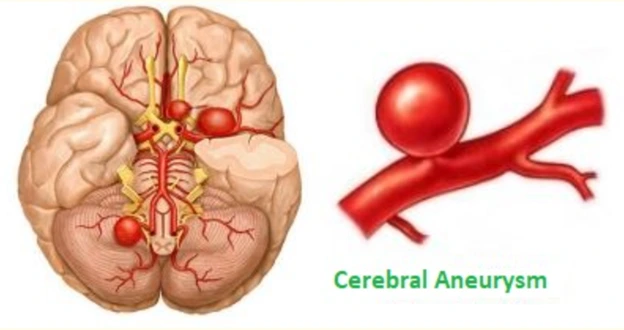
Figure 1: Schematic of cerebral aneurysm
Simulation Process: Virtual Anatomy Generation
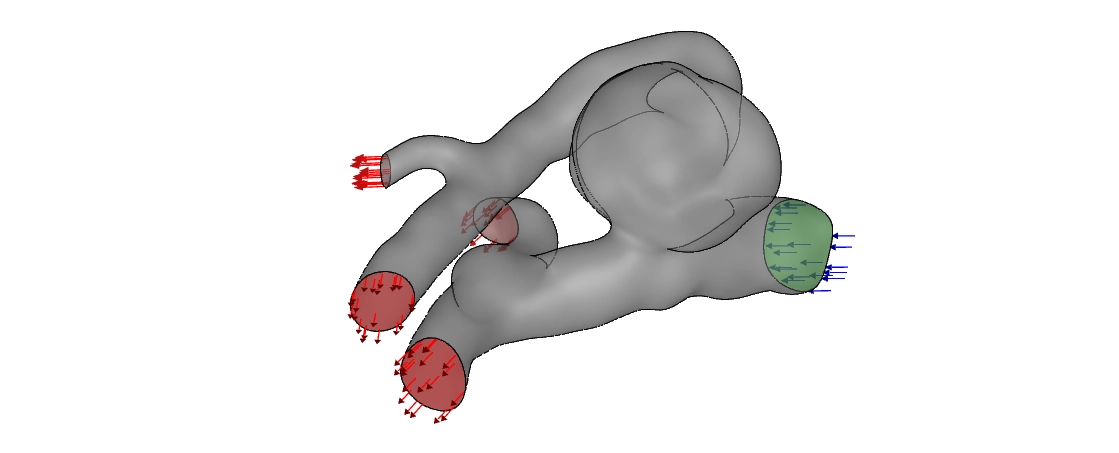
To begin this CFD Analysis of Cerebral Aneurysm, we extracted a 3D computational representation of a human artery directly from a patient’s MRI scan. This geometry includes the main feeding artery and a large, bulbous aneurysm sac protruding from the side. Next, we used the Fluent meshing tool to divide the blood volume into exactly 903,360 polyhedral cells. This highly efficient polyhedral mesh perfectly captures the complex, curved shapes of the biological vessel walls. For the fluid boundary conditions, we defined human blood as the working fluid. To simulate a realistic human heartbeat, we applied an inlet blood velocity of exactly 0.3 m/s.
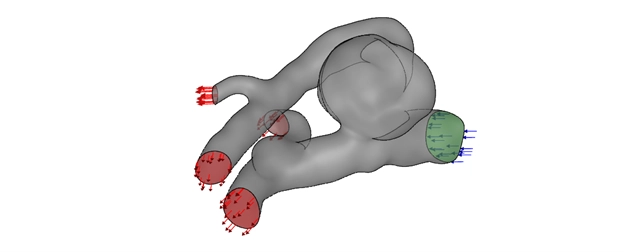
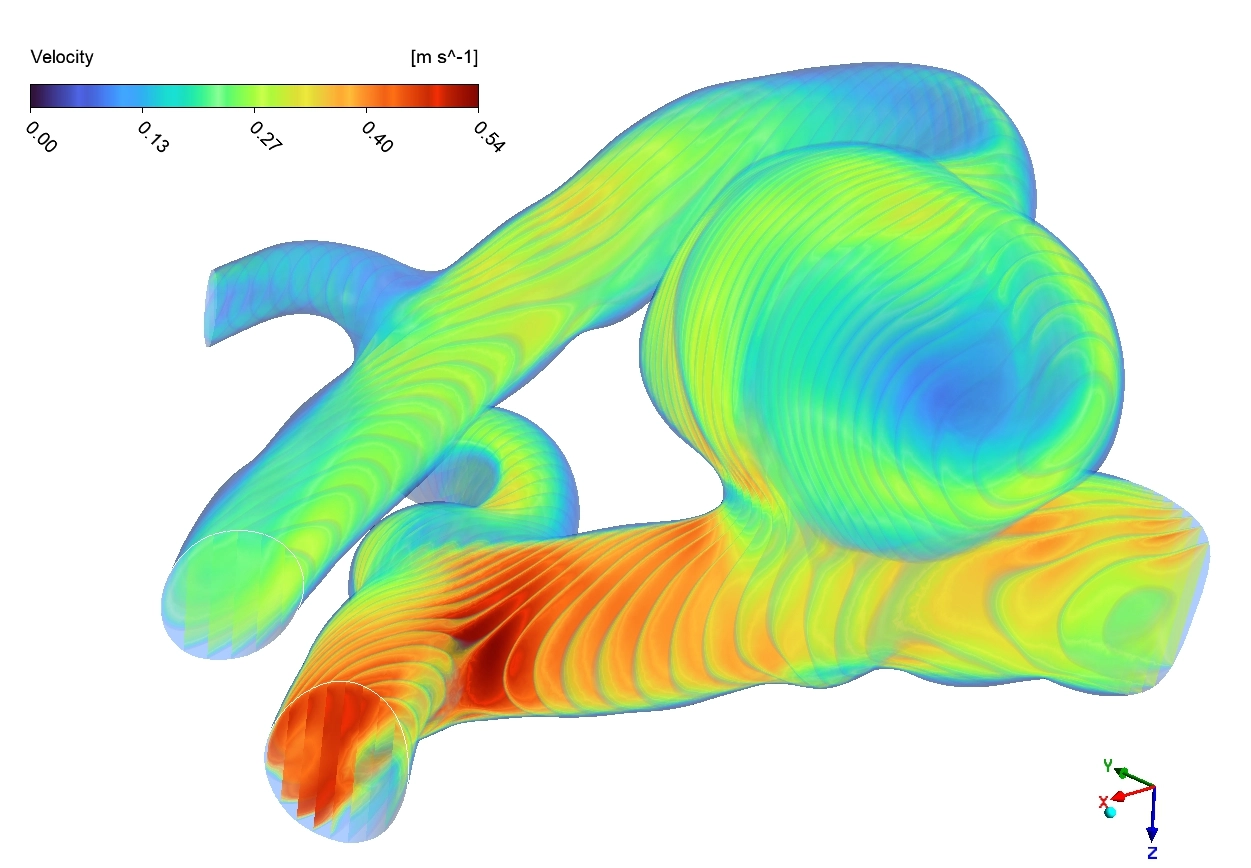
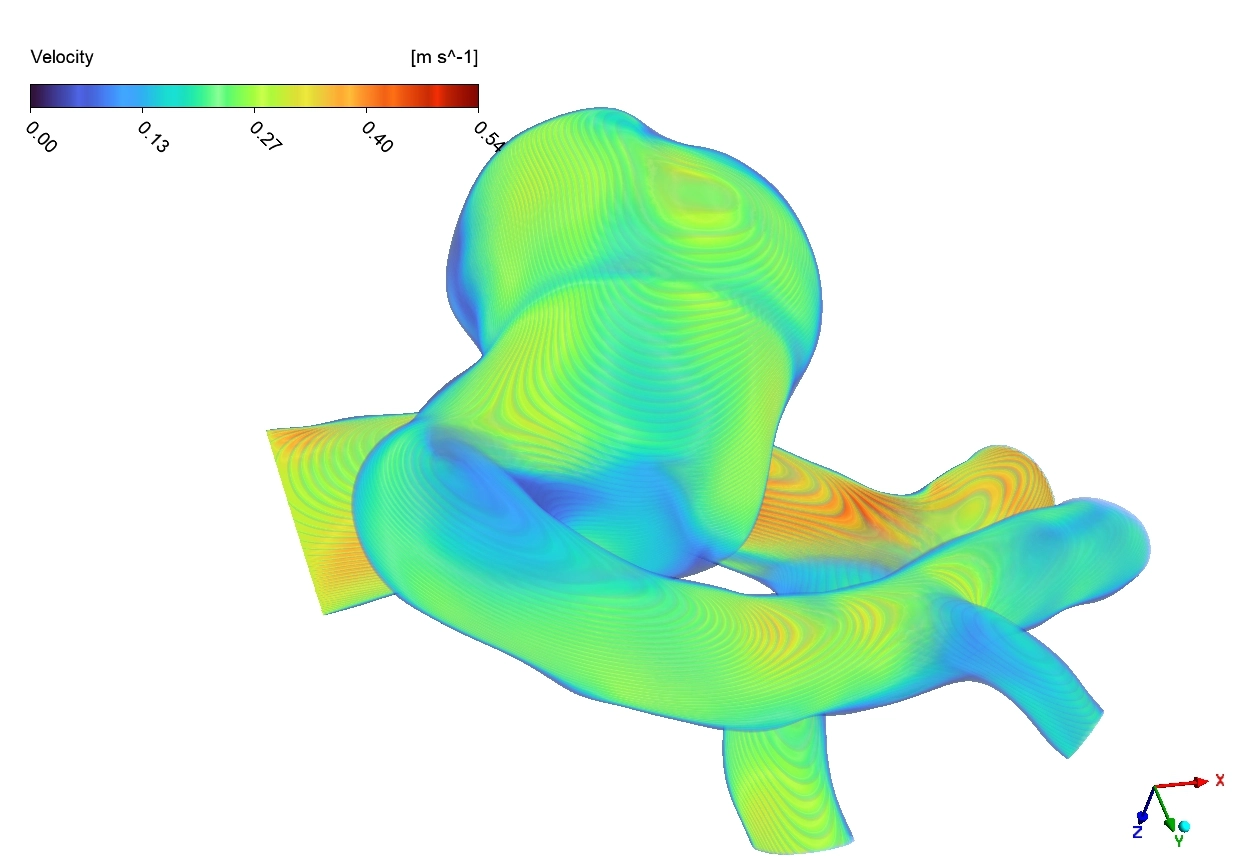
Figure 2: patient-specific cerebral aneurysm geometry model
Post-processing: Analysis of Blood Flow and Pressure
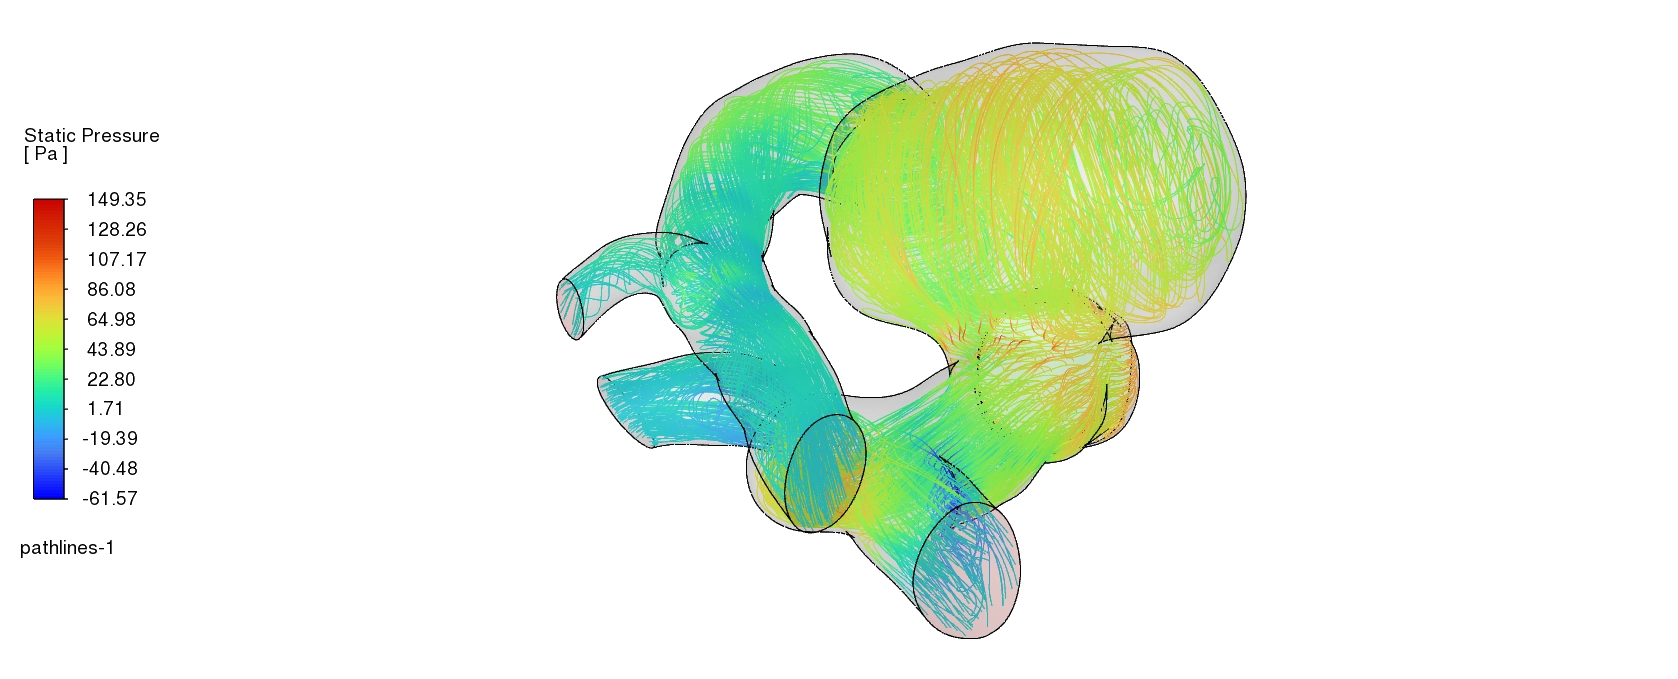
Let us evaluate the exact numerical data to understand the hemodynamic danger. First, we must analyze the aerodynamic pressure contours acting directly on the vessel walls. The software calculated a global static pressure scale ranging from a minimum of -61 Pa to a maximum of 149.35 Pa. When we observe the main aneurysm dome, we see a moderate, uniform pressure distribution measuring between 86.83 Pa and 107.67 Pa. However, the most critical finding appears exactly at the neck of the aneurysm, where the sac connects to the main artery. The contour displays a highly concentrated red hotspot reaching the absolute peak of 149.35 Pa. This dangerous hotspot occurs because the incoming blood jet from the 0.3 m/s inlet directly crashes into the neck wall. This sudden flow impingement converts the kinetic energy of the moving blood into a massive mechanical force. Because this specific neck region experiences nearly double the pressure compared to the main dome, it becomes the most likely location for a structural failure or rupture.
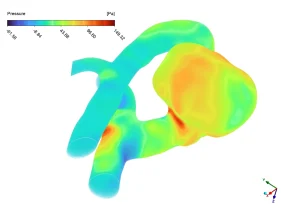
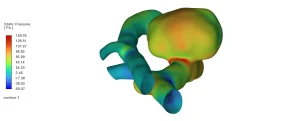
Figure 3: Pressure contours from ANSYS Fluent CFD showing blood pressure distribution
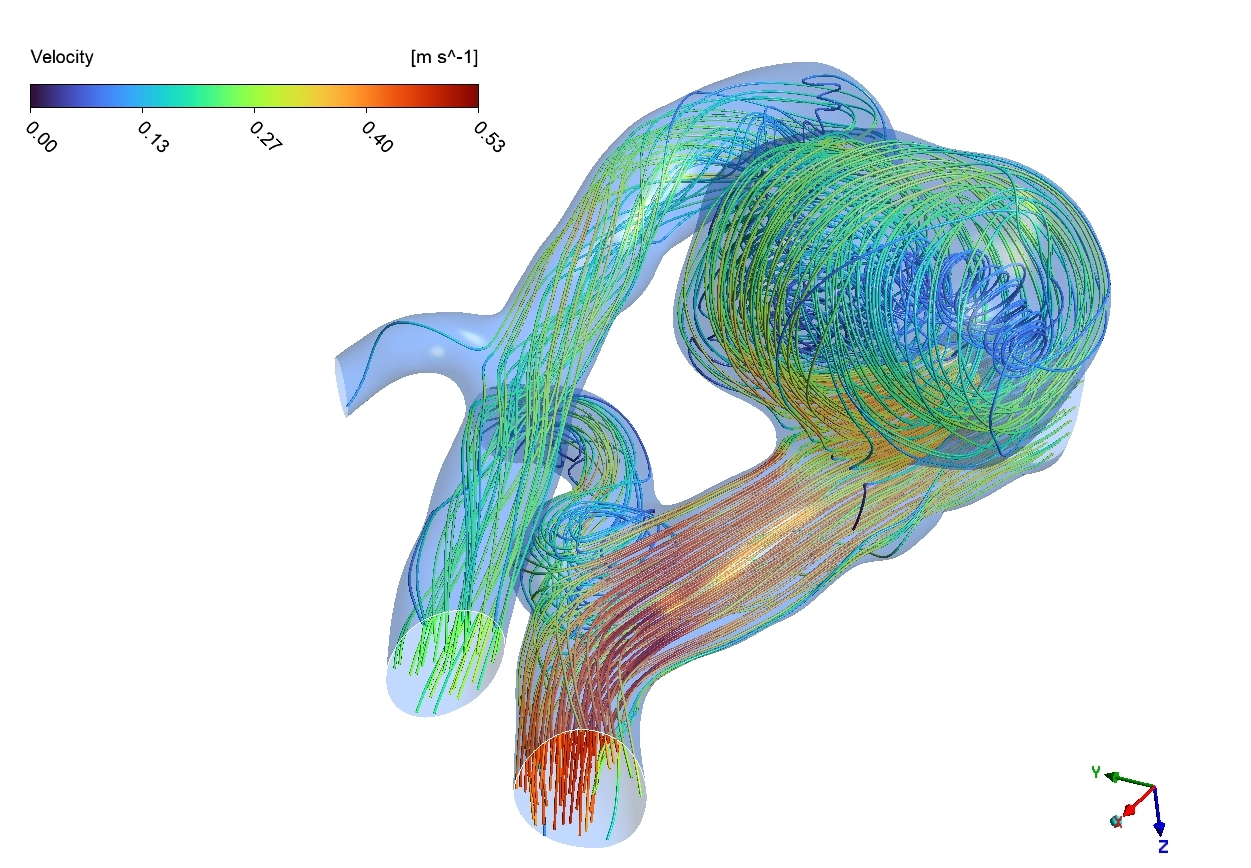
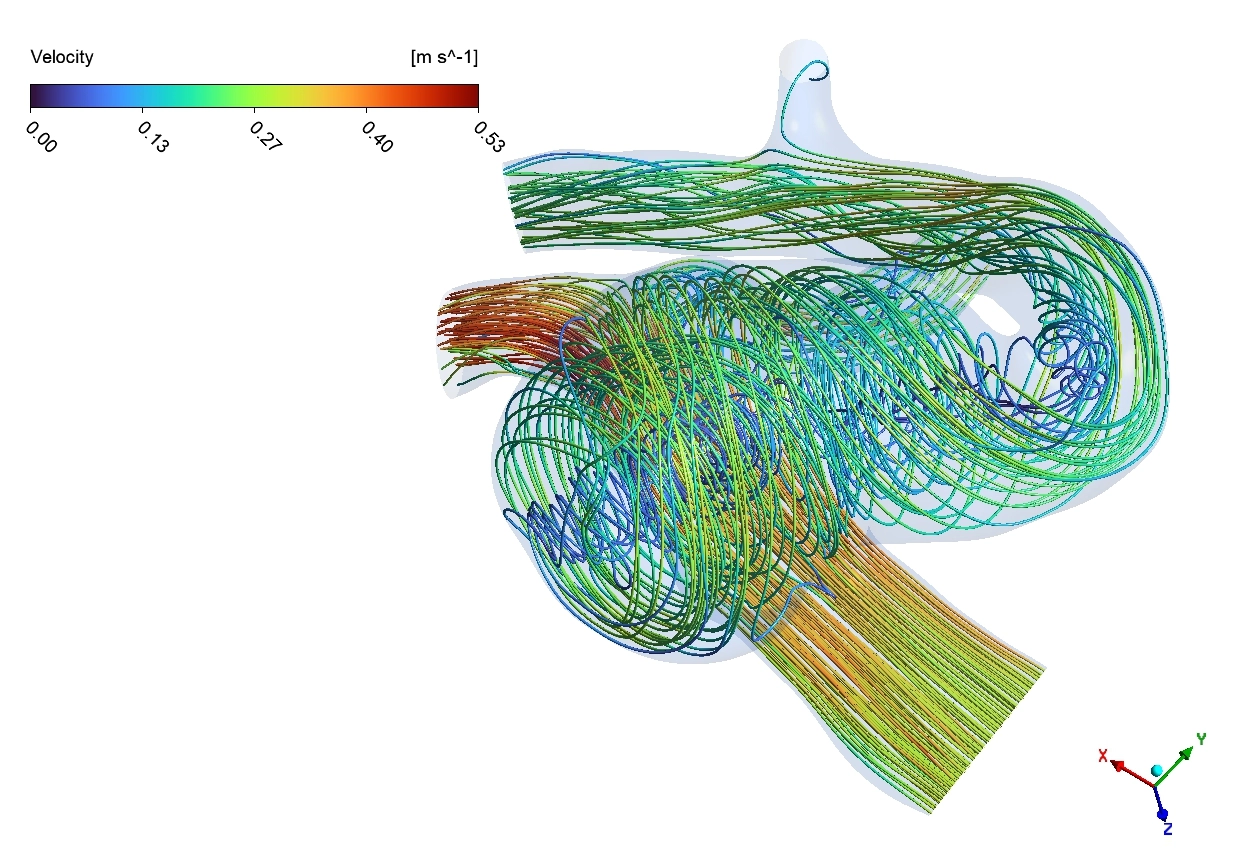
Next, we examine the streamline contours to visualize the internal blood flow patterns. In a healthy, straight artery, blood flows smoothly in parallel lines. However, as the blood enters the wide aneurysm sac, the flow area suddenly expands. This sudden expansion forces the fast 0.3 m/s blood to drastically slow down to less than 0.05 m/s. The streamlines show that a massive recirculation vortex forms, trapping the blood and occupying 70% to 80% of the entire dome volume. Because the blood is swirling so slowly in this stagnation zone, it creates extremely low wall shear stress on the dome tissue. In human biology, abnormally low shear stress degrades the healthy cells of the blood vessel, making the wall even weaker over time. This step-by-step bioengineering analysis mathematically proves that the combination of a high-pressure impact at the neck and a slow, degrading vortex inside the dome creates a severe, long-term rupture risk for the patient.

Figure 4: Hemodynamic streamline visualization demonstrating the 0.3 m/s inlet flow expanding into a large, slow-moving recirculation vortex inside the aneurysm dome.
Frequently Asked Questions (FAQ)
- What is the purpose of a Cerebral Aneurysm ANSYS Fluent simulation?
- The simulation helps engineers and doctors visualize how blood flows inside a weakened brain artery. By calculating the exact pressure and velocity, medical professionals can evaluate the physical stress acting on the vessel walls and predict the risk of rupture.
- Why is the pressure highest at the aneurysm neck?
- The peak pressure of 149.35 Pa occurs at the neck because of flow impingement. The fast-moving blood jet coming from the main artery directly strikes the angled wall of the neck, transferring all of its kinetic energy into a concentrated, dangerous mechanical force.
- What happens to the blood velocity inside the aneurysm sac?
- As the blood enters the wide aneurysm sac, it suddenly loses its forward momentum. The velocity drops drastically from 0.3 m/s down to less than 0.05 m/s. This creates a slow, swirling recirculation vortex that traps the blood and weakens the surrounding biological tissue.


Reviews
There are no reviews yet.