
A Diffuser-Augmented Horizontal Axis Wind Turbine (DAWT) is a highly special machine designed to create green electricity. Unlike normal open wind turbines, a DAWT has a large, solid ring surrounding the spinning blades. This large ring acts exactly like a funnel. It catches the slow moving wind and actively squeezes it, speeding the air up before it hits the blades. Because the air moves much faster, this special turbine creates significantly more power than a standard design of the same size. Therefore, these compact and powerful machines are highly popular for urban areas and busy city environments where space is very limited. However, placing powerful wind turbines inside cities creates a massive environmental problem: noise pollution. When the fast wind violently hits the spinning blades and the solid ring wall, it generates loud, annoying sounds. If the machine is too loud, it becomes illegal to build near homes. To safely solve this serious acoustic problem, smart engineers perform a highly accurate Diffuser-Augmented HAWT Aeroacoustics CFD Simulation.
By using a computational representation, engineers can safely watch the invisible wind and hear the exact machine noise without building an expensive, heavy metal prototype. The Ansys Fluent CFD software mathematically calculates how the fast air spins off the blades and predicts exactly how loud the sound will be for the people living nearby. If you want to deeply understand how advanced engineering software calculates complex sound waves traveling through moving air, please explore our professional Acoustics tutorials. By practicing this exact tutorial project, designers can successfully reshape the turbine blades to build incredibly quiet, highly efficient machines for city neighborhoods.
- Reference: Avallone, Francesco, Daniele Ragni, and Damiano Casalino. “On the effect of the tip-clearance ratio on the aeroacoustics of a diffuser-augmented wind turbine.” Renewable Energy152 (2020): 1317-1327.
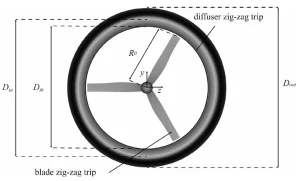
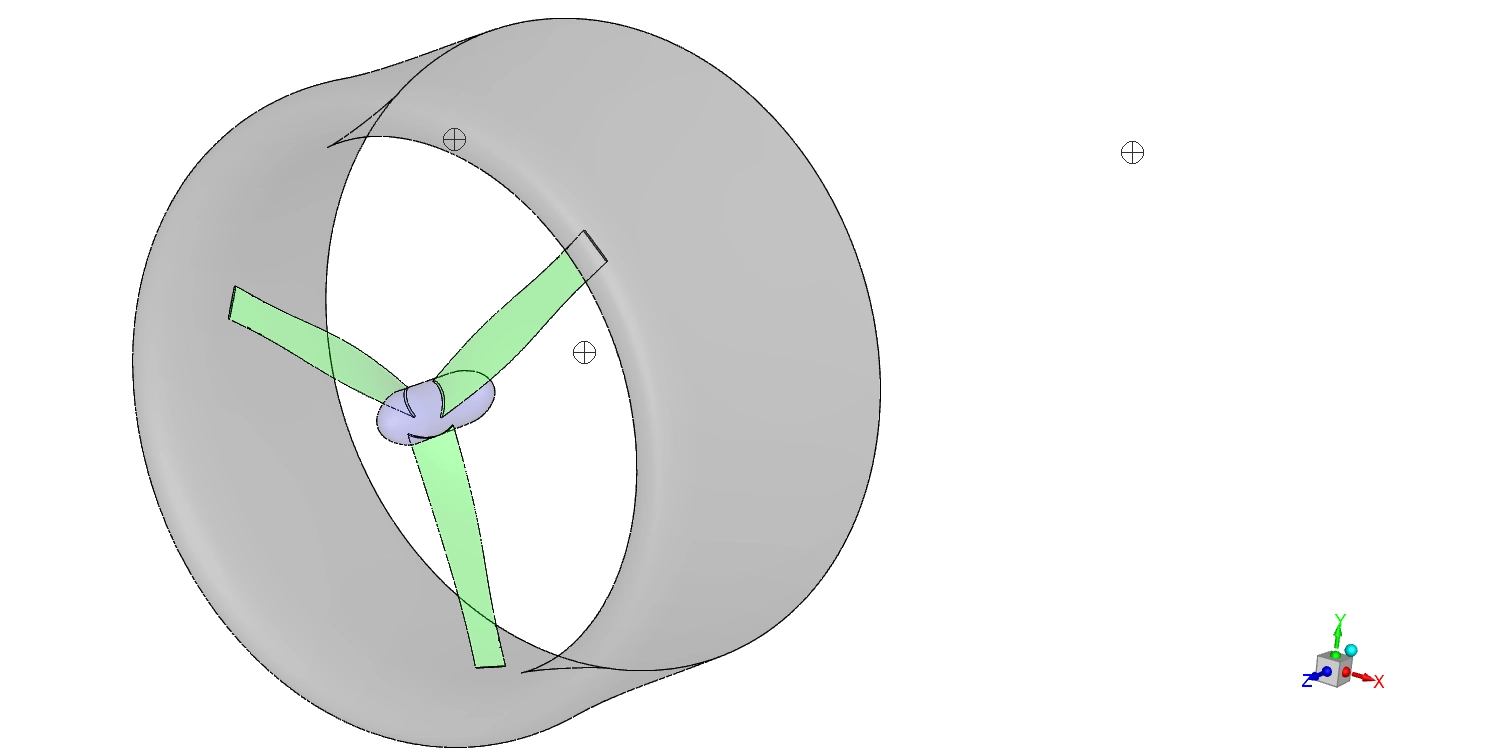
Figure 1: Wind turbine geometry and receiver positions, showing the front view of the DonQi turbine and the three exact locations where the digital microphones record the sound. [1]
Simulation Process: SAS Turbulence and FW-H Acoustic Modeling Setup
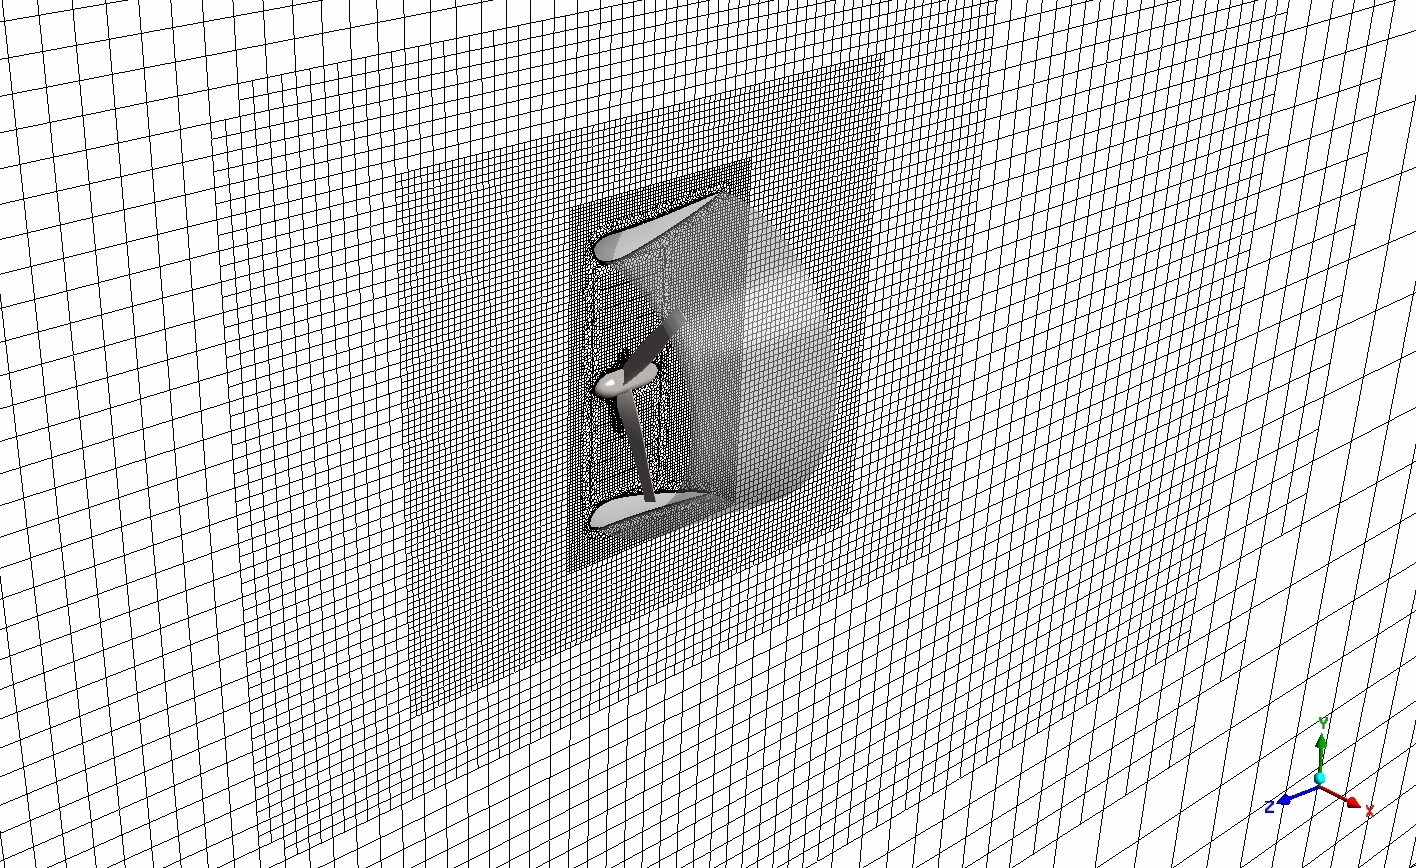
To capture the true physical sound of this machine, we carefully built a 3D geometry of the three-blade turbine sitting inside the ring-shaped diffuser. We imported this exact CAD geometry into the ANSYS Fluent Meshing tool to create a highly detailed poly-hexcore mesh. This complex mesh contains exactly 2,220,557 cells. We specifically placed very flat, thin cells directly on the solid metal walls to perfectly calculate the sticky boundary air layer.
To properly simulate the wild and highly unstable air moving around the rotating blades, we activated the advanced Scale-Adaptive Simulation (SAS) turbulence model. We also turned on the moving mesh (Mesh Motion) feature to spin the turbine rotor at a fast, steady speed of 380 rpm (39.84 rad/s). Because sound waves require time to travel, we used a transient solver with very tiny time steps. Finally, to mathematically predict the exact noise traveling through the city air, we activated the Ffowcs Williams-Hawkings (FW-H) acoustic analogy. We placed three acoustic receivers in the 3D space to record the exact sound pressure levels.
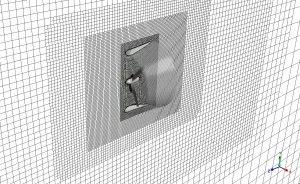
Figure 2: Poly-hexcore mesh elements, displaying the highly detailed mesh cells safely wrapped around the solid blade and ring objects to calculate the air perfectly.
Post-processing: Analysis of Acoustic Waves and Aerodynamic Turbulence
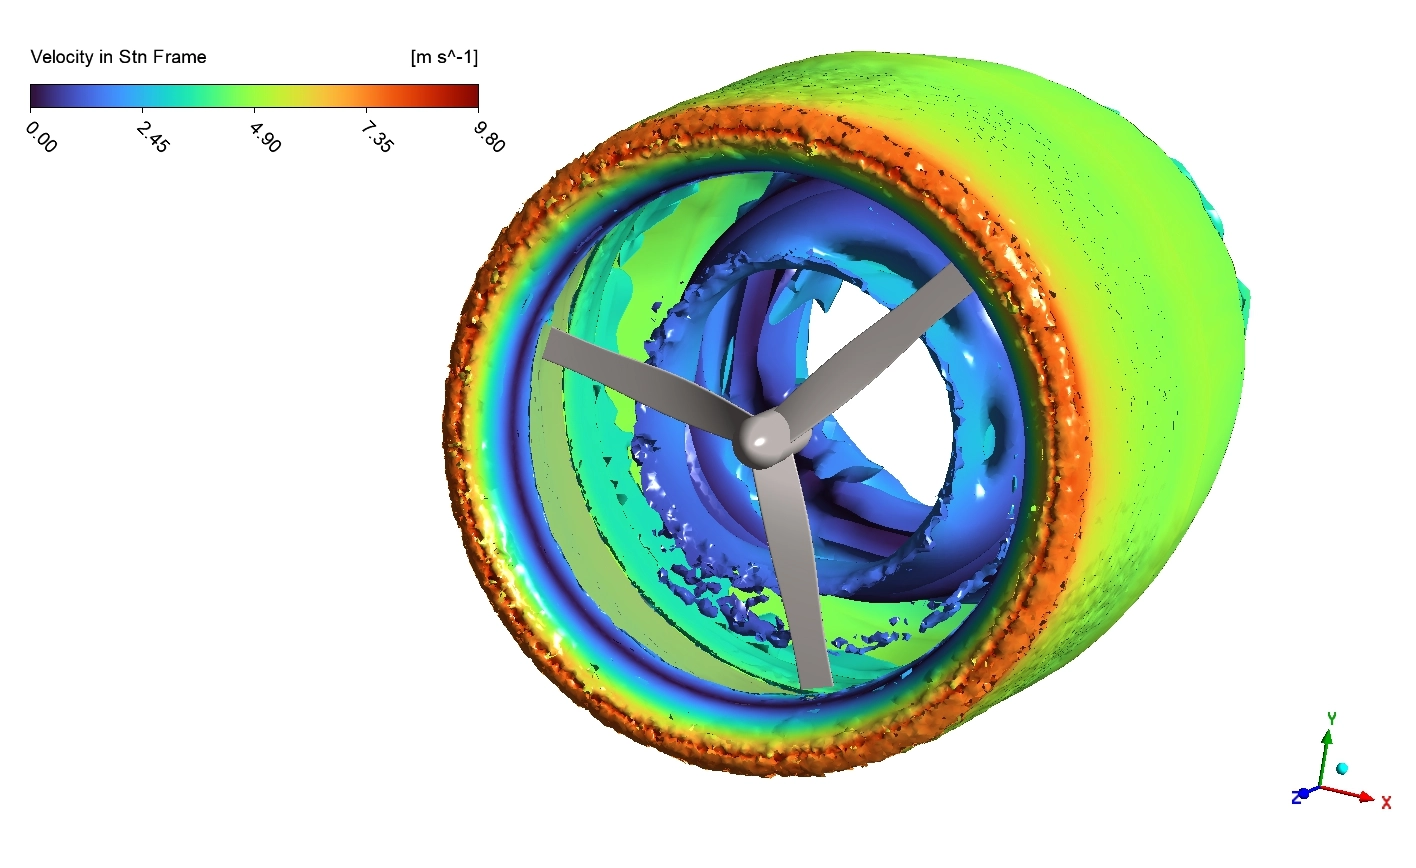
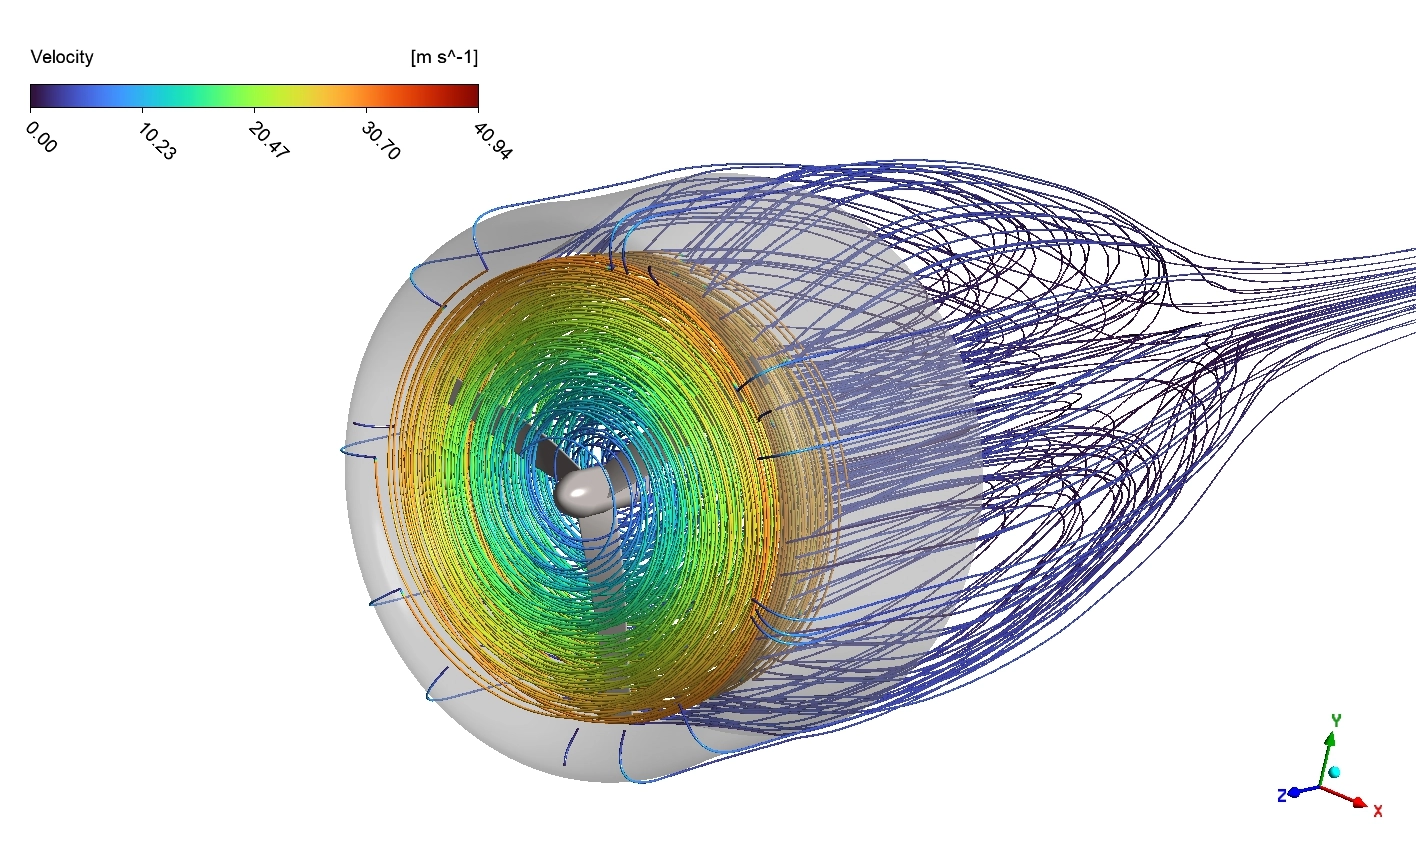
Evaluating the true performance of this machine requires a deep understanding of how the invisible moving air creates loud sounds. Instead of looking at simple velocity shapes, we used an advanced mathematical tool called the Lambda Q-criterion. The provided visual contour uses the Q-criterion method colored by the exact air speed. This special vortex identification tool highlights regions where the air spins strongly in circles. This spinning air is the exact physical source of HAWT aeroacoustics noise.
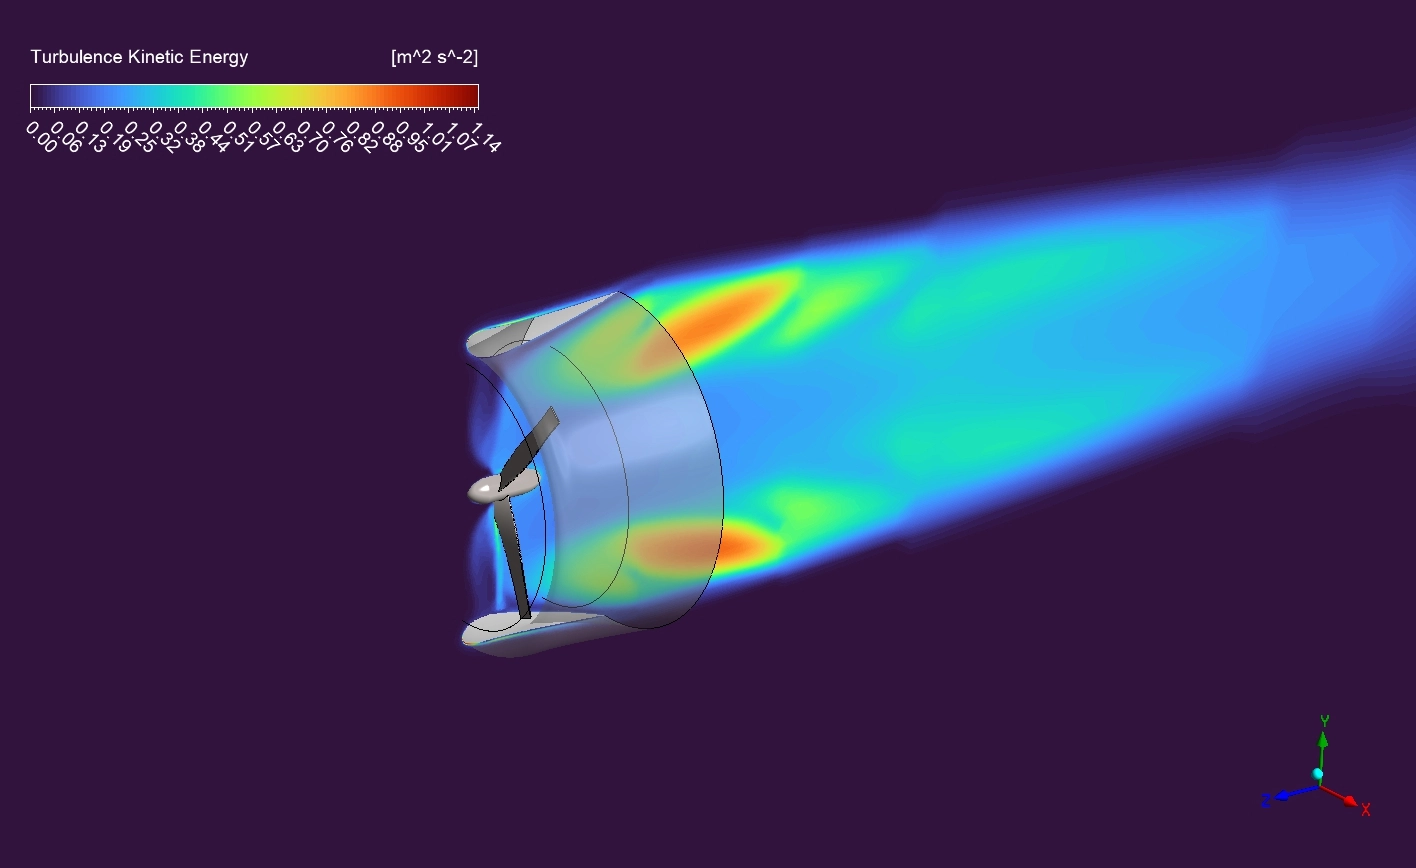
When the wind is squeezed by the diffuser ring, it hits the blades very hard. Because the blades are spinning fast at 380 rpm, the air breaks away from the blade edges and forms strong, invisible spinning shapes called tip vortices. The 3D Q-criterion image clearly shows these complex helical vortex structures wrapping around the blades and trailing backward into the deep wake zone. The bright colors on these spinning structures prove that the air speed inside these vortices reaches an extreme maximum of 33.78 m/s. This fast, violently spinning air directly creates high-energy aerodynamic turbulence. The mathematical calculations show this heavy turbulence reaches 0.6 to 0.74 m²/s² right at the sharp blade tips. Furthermore, the air strongly wants to escape, so it violently leaks through the tiny empty gap between the moving blade and the stationary outer wall. This leaking air creates a strong turbulence zone of 0.4 to 0.6 m²/s², causing a very loud, rolling broadband noise.
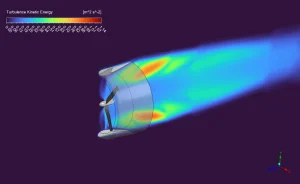
Figure 3: Turbulence kinetic energy (TKE) contour, visualizing the high-energy red turbulent zones located directly at the sharp blade tips and inside the small wall gap.
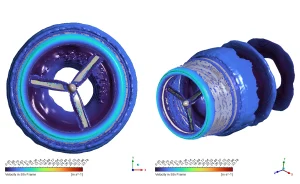
Figure 4: Lambda Q-criterion contour colored by velocity magnitude, beautifully visualizing the complex 3D spinning tip vortices and wake structures reaching exactly 33.78 m/s.
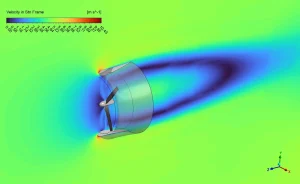
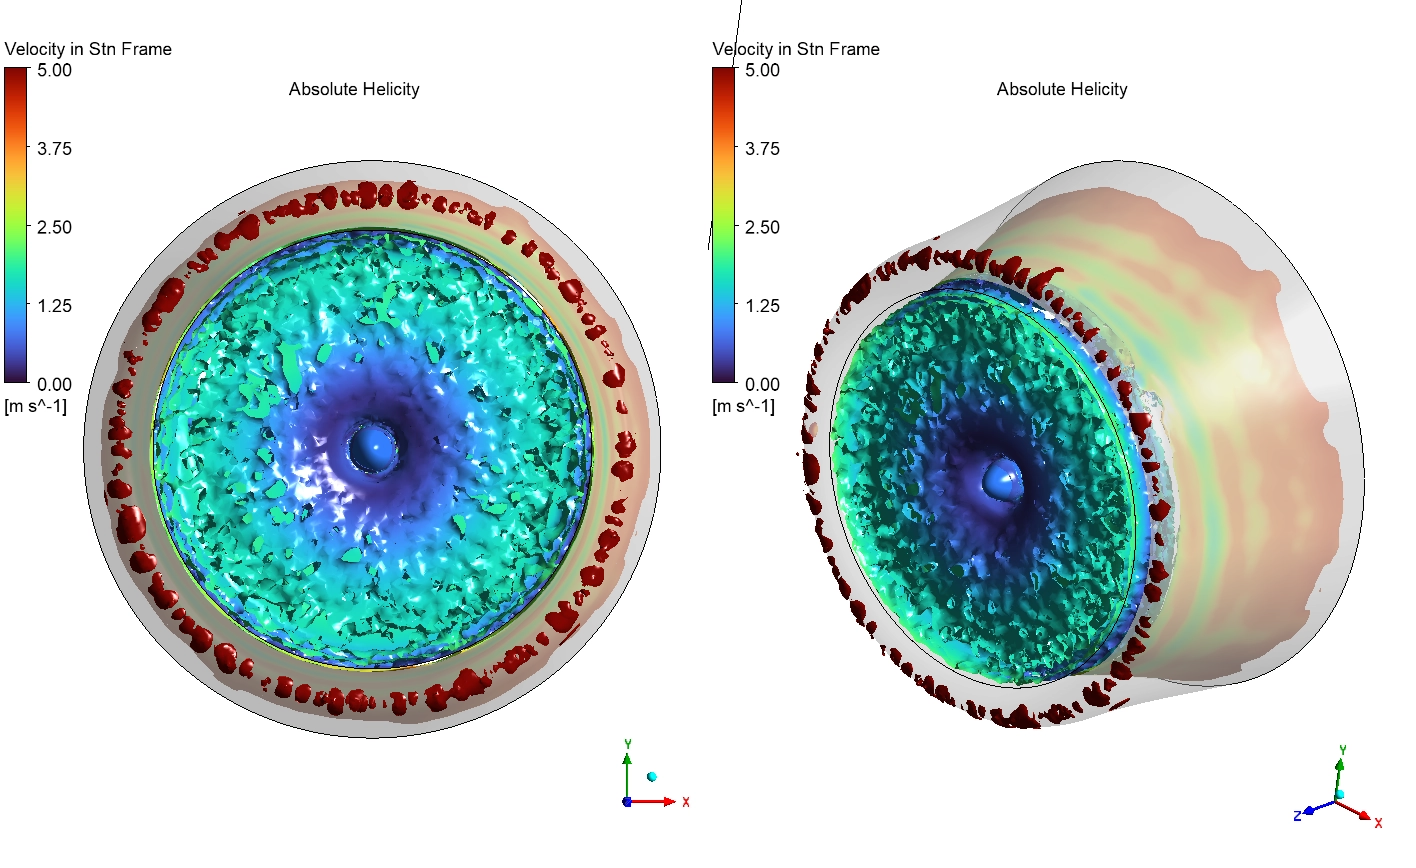
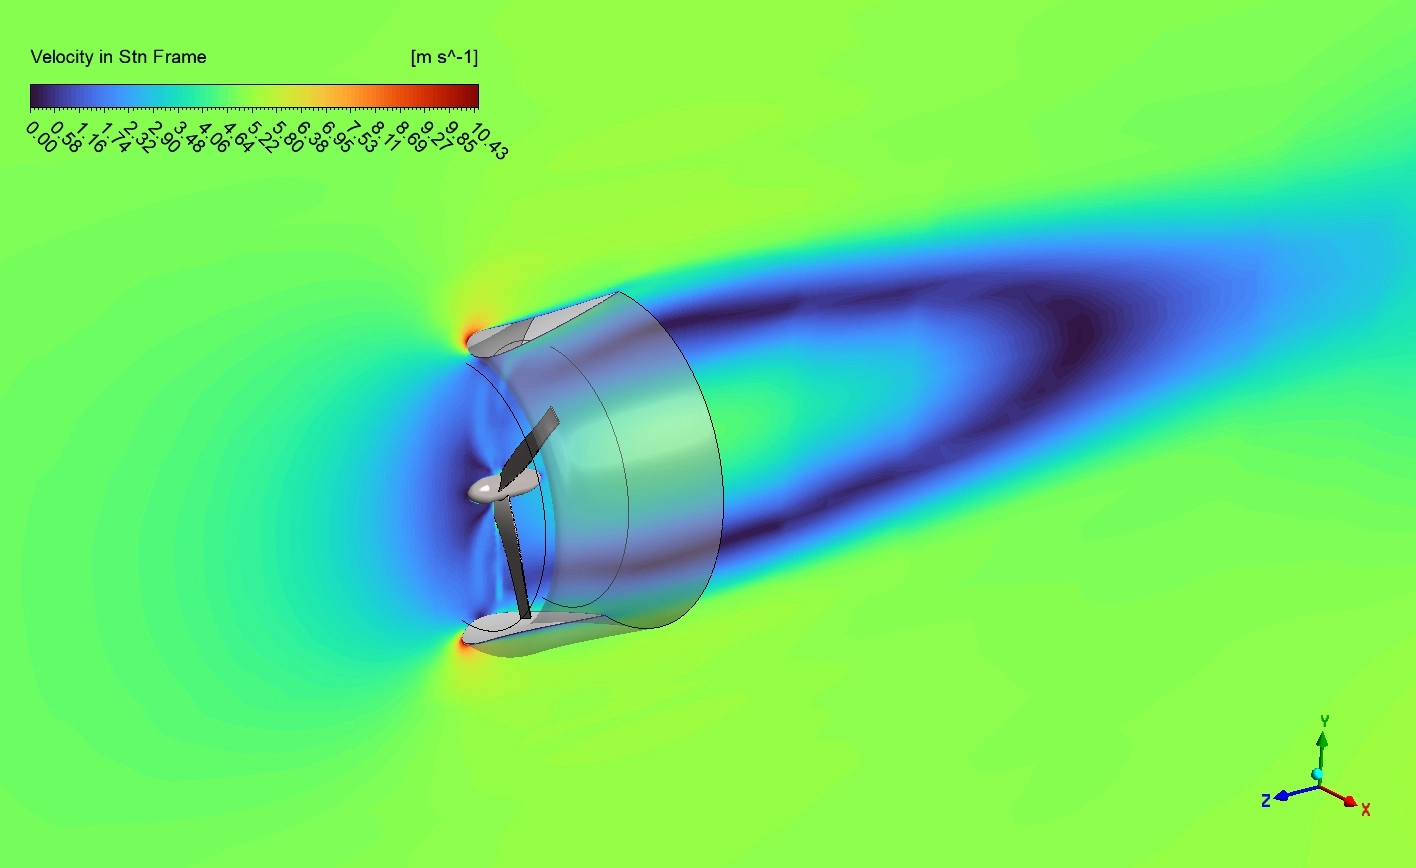
Figure 5: Velocity magnitude in stationary frame contour, showing the slow ambient wind speeding up as it travels through the ring-shaped diffuser.
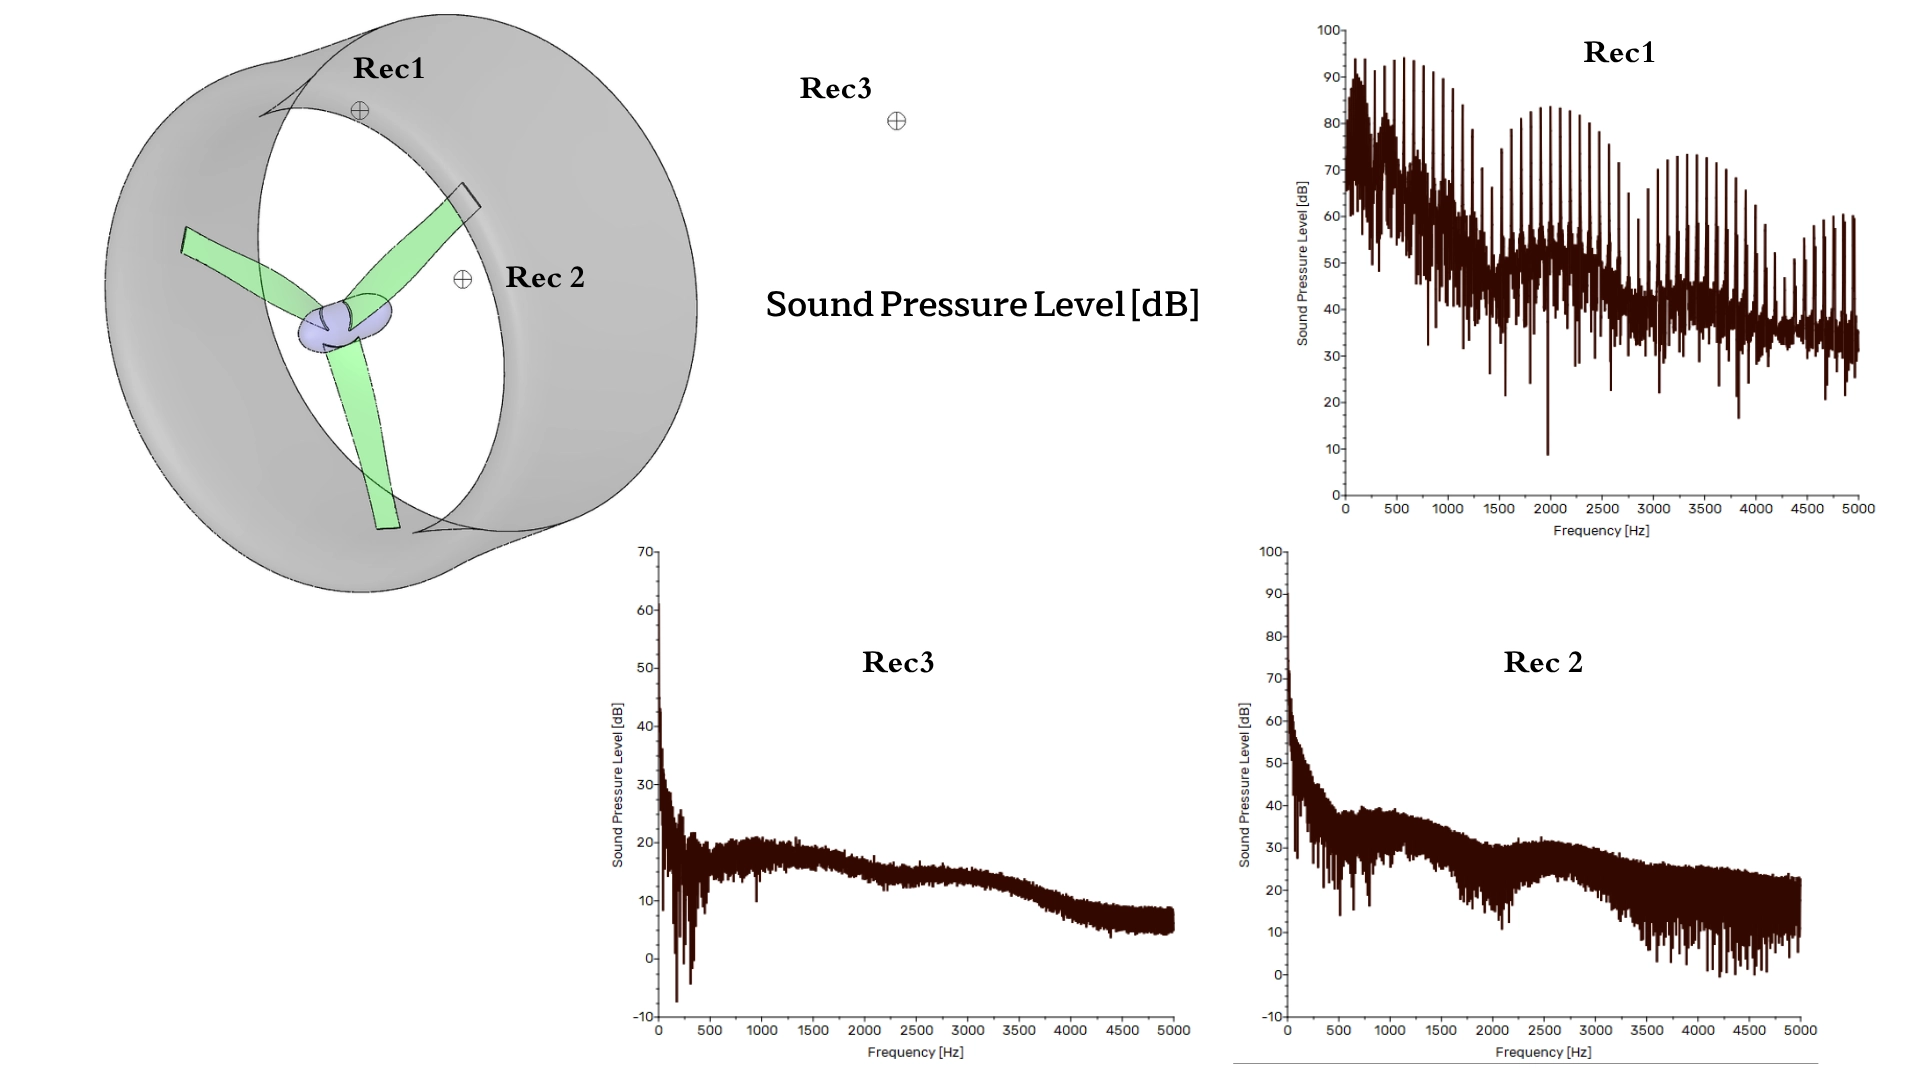
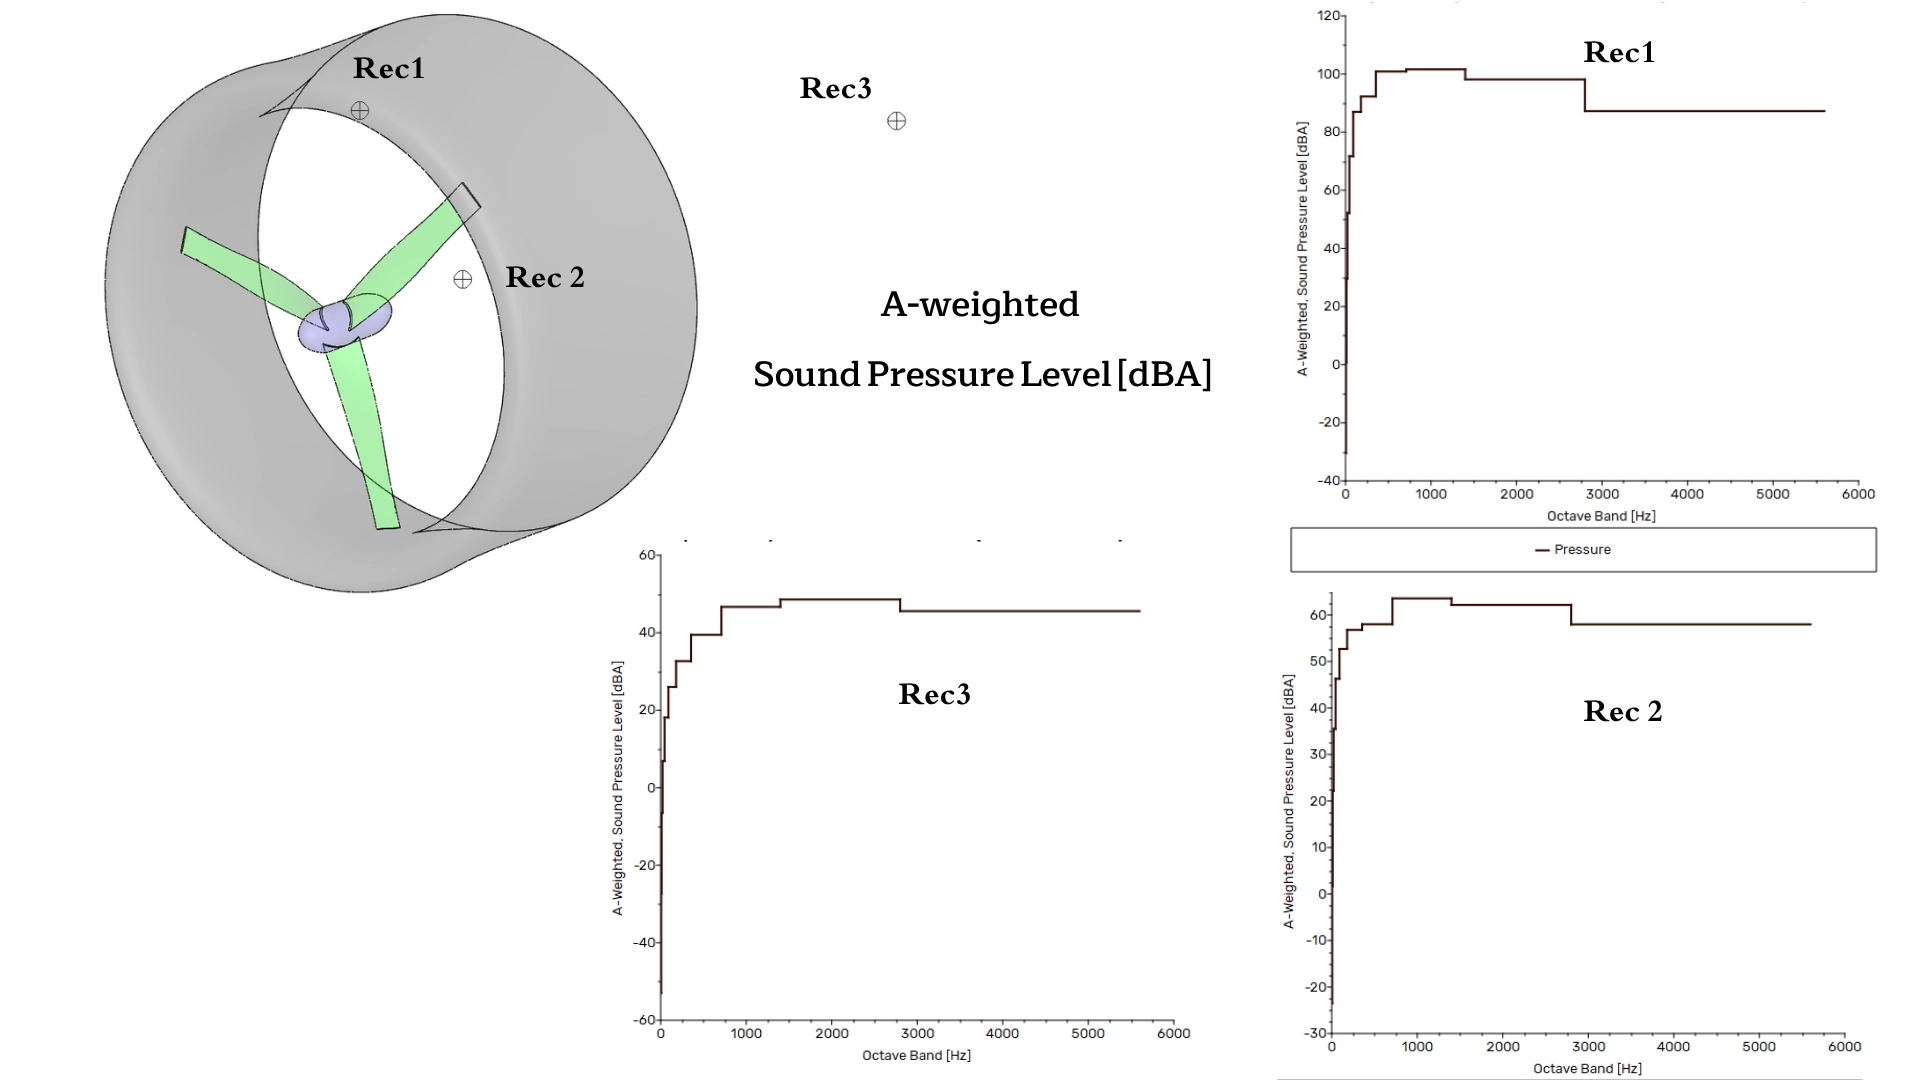
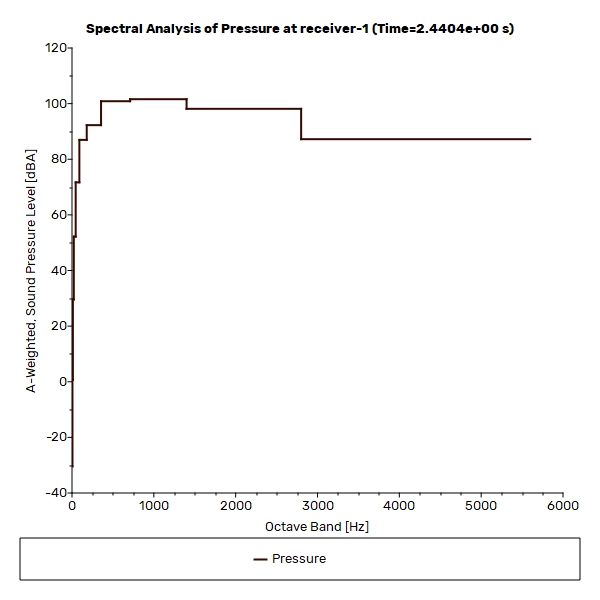
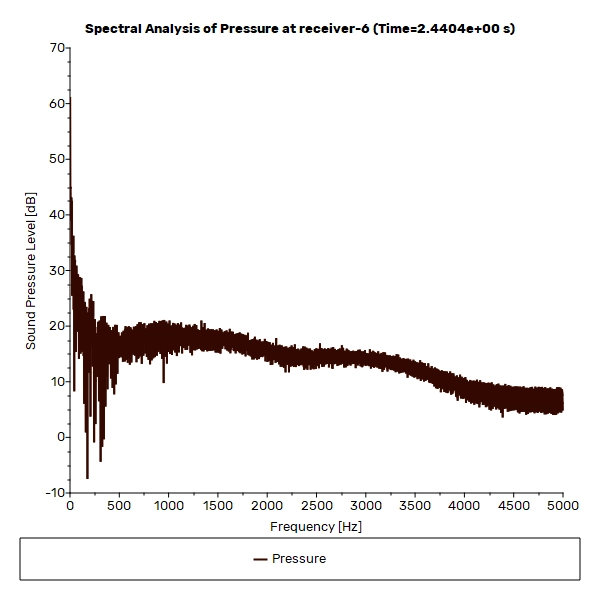
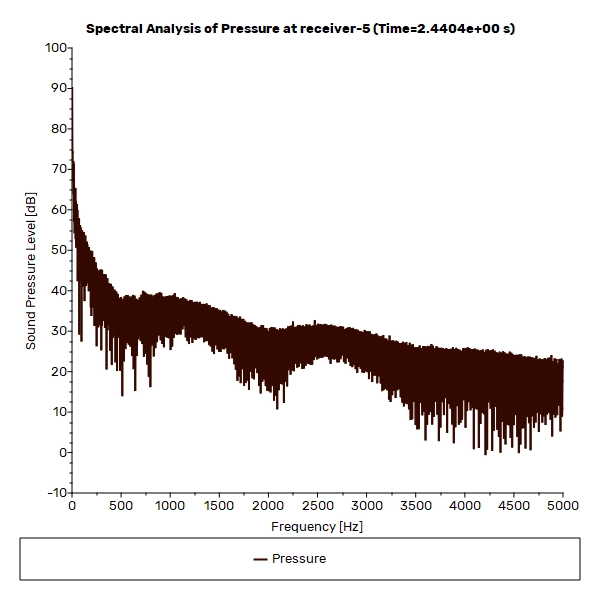
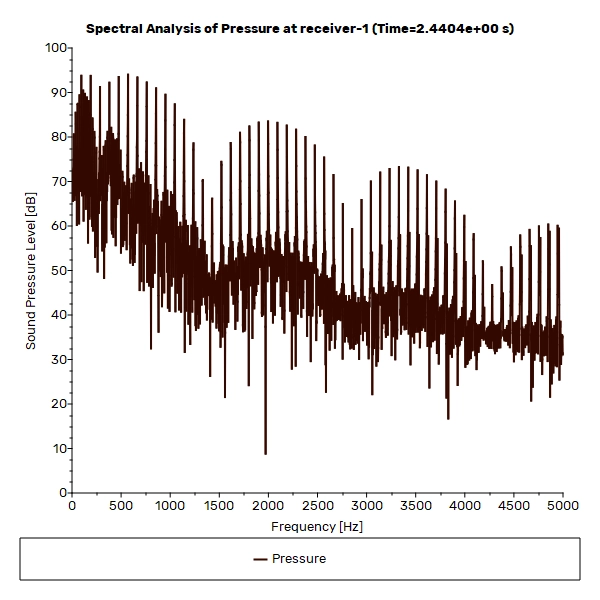
To fully understand this noise wind turbine problem, the CFD software mathematically recorded the exact sound waves using three specific receiver locations. At Receiver 1, which sits near the center hub of the blades, the noise is extremely loud. The sound reaches an exact Sound Pressure Level of 80 to 100 dBA. The data shows sharp tonal peaks because the three blades constantly chop the heavy air at the exact blade passing frequency. However, this dangerous sound drops very quickly as it travels away from the machine. At Receiver 3, located exactly 5 meters away at the exit part of the augment, the loud sounds weaken massively, dropping to a very quiet 5 to 50 dBA. This scientifically proves that high-frequency screaming sounds lose their energy very fast in open air.
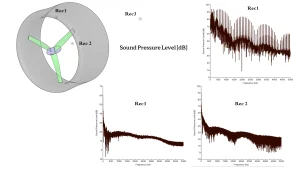
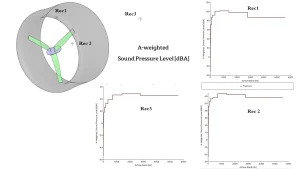
Figure 6: Detailed Sound Pressure Level spectra, illustrating the exact loud tonal peaks caused by the blades chopping the air, reaching up to 100 dBA near the center hub.
Despite these acoustic challenges, the thrust of wind turbine analysis proves the aerodynamic shape is highly successful. The spinning blades violently catch the fast 33.78 m/s air. Because the air pushes so hard against the blades, the turbine extracts massive rotational energy. The software calculates a very strong exact aerodynamic thrust coefficient (Cd) for the blade wall of 0.30272518, alongside a torque coefficient (Cm) of -0.0321. These exact numbers mathematically guarantee the turbine is successfully turning the wind into heavy electrical power. By looking at this exact Q-criterion flow data and acoustic sound pressure, designers can confidently change the blade shape to keep the high thrust power while completely destroying the noisy tip vortices.
Table 1: Aeroacoustics and Turbine Performance Data
| Wind Turbine Parameter | Measurement Location | Exact CFD Calculated Value |
| Turbine Rotor Speed | Moving Mesh Zone | 380 rpm (39.84 rad/s) |
| Maximum Vortex Speed | Lambda Q-criterion Zone | 33.78 m/s |
| Maximum Inner Noise Level | Receiver 1 (Center Hub) | 80 to 100 dBA |
| Far-Field Quiet Noise Level | Receiver 3 (5 meters away) | 5 to 50 dBA |
| Aerodynamic Thrust (Cd) | Turbine Rotor Blade Wall | 0.30272518 |
| Aerodynamic Torque (Cm) | Turbine Rotor Axis | -0.0321 |
Frequently Asked Questions (FAQ)
- What is the FW-H acoustic analogy in ANSYS Fluent?
- The Ffowcs Williams-Hawkings (FW-H) analogy is an advanced mathematical tool. It allows the CFD software to calculate how the unsteady wind pushing against the solid turbine blades creates invisible sound pressure waves that travel through the open air.
- What does the Lambda Q-criterion show in this simulation?
- The Q-criterion is a special mathematical tool that highlights where the air is spinning strongly in circles. By visualizing these complex 3D structures, designers can exactly see the tip vortices that cause the loudest turbine noise.
- Why is the noise so much quieter at 5 meters away?
- Sound energy naturally weakens as it spreads out into the open city space. The CFD simulation perfectly proves that high-frequency sounds lose their power very quickly in the air, dropping the loud 100 dBA noise down to a very safe 50 dBA.
- Why does the small gap between the blade and the wall create noise?
- When the blade spins at a fast 380 rpm, the high-pressure air strongly wants to escape. It violently leaks through the tiny clearance gap between the blade tip and the stationary outer ring. This fast, leaking air creates heavy turbulence that causes very loud broadband noise.






Reviews
There are no reviews yet.