

In the mining industry, large rotating machines called Semi-Autogenous Grinding (SAG) mills crush giant rocks into valuable fine powder. Inside this heavy steel drum, thousands of rocks and steel balls crash against the outer walls every single second. Over time, these violent impacts cause severe structural damage to the metal. To prevent expensive machine failure, modern engineers perform a highly detailed SAG Mill Wear Analysis. By running an advanced SAG Mill Wear simulation, designers can safely observe the invisible rock movements and measure the exact wall friction. A comprehensive Analysis of SAG Mill Wear helps manufacturers build stronger, longer-lasting equipment. While engineers use a CFD Analysis or a fluent simulation to track fluid liquids and gases, they must use Discrete Element Method (DEM) software to track solid rocks. Inside the DEM Rocky software, the solver mathematically tracks the exact speed, weight, and collision force of every single particle. Understanding these complex physical forces is absolutely essential for heavy industrial design. To learn exactly how to set up these highly complex solid particle tracking simulations for your own engineering projects, please carefully explore our detailed DEM tutorials.
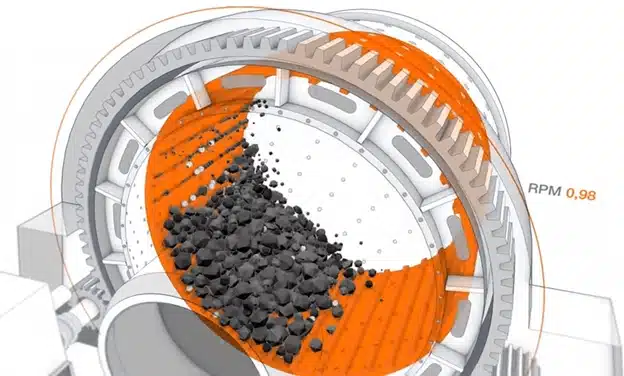
Figure 1: A schematic drawing of the massive rotating SAG Mill equipment used in the mining industry.
Simulation Process: Particle Tracking and Wear Modeling in ROCKY DEM
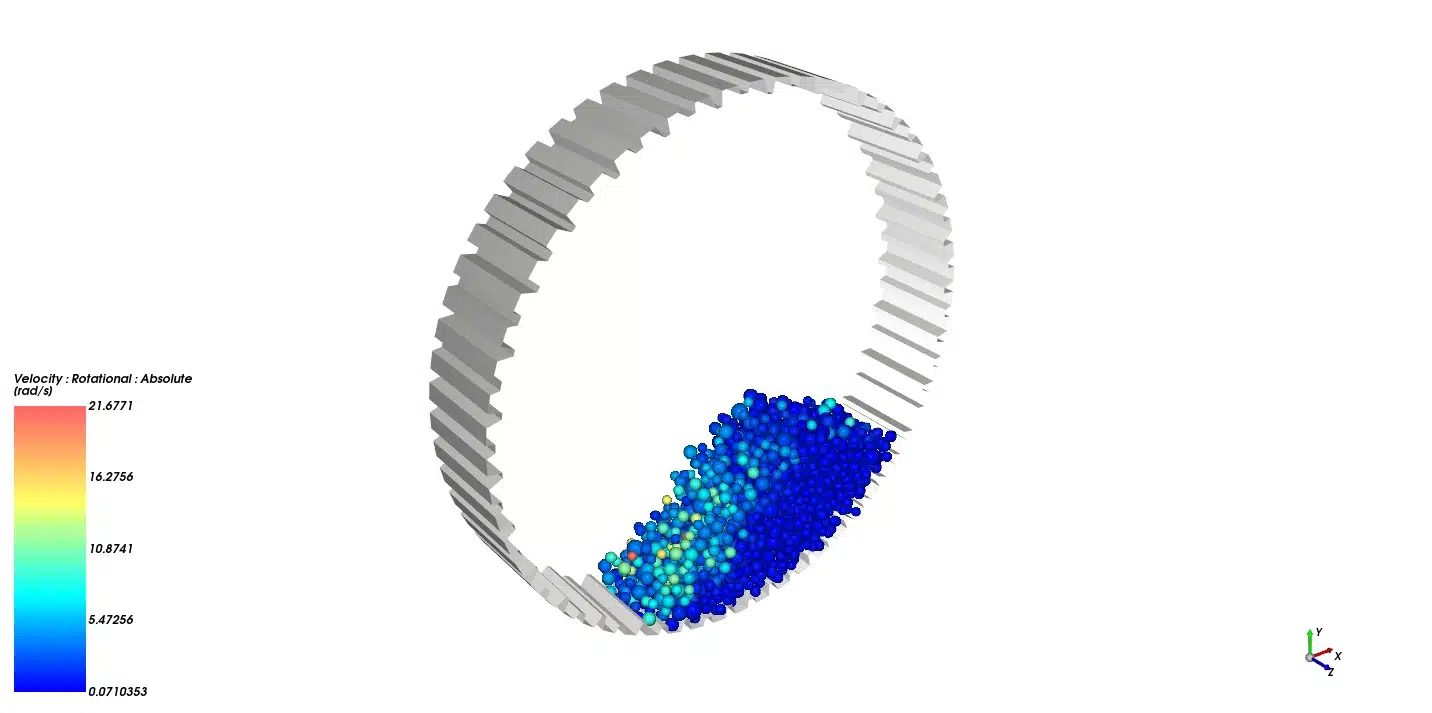
To perform this exact SAG Mill Wear Rocky project, we created a complete 3D computational representation of the rotating drum. This virtual geometry contains specific internal structures called lifters, which are designed to grab and lift the heavy rocks. Inside the simulation space, we injected exactly 32,000 kg (32 tons) of mixed rock ore. Next, we added 8,000 kg (8 tons) of heavy steel grinding balls. This creates a highly realistic 4:1 grinding mixture.
To simulate the physical rotation, we applied specific kinematic boundary conditions. We set the computational drum to accelerate gently at 0.35 rad/s² until it reached a constant, steady operating speed of exactly 1.2 rad/s (11.5 RPM). To calculate the exact metal damage during this rotation, we activated advanced mathematical wear equations. The numerical solver then carefully tracked the violent collisions of these particles over a total physical time of exactly 25 seconds.

Figure 2: The initial state of the computational representation, showing the 32 tons of rock and 8 tons of steel resting at the bottom.
Post-processing: Analysis of Velocity Pathlines and Radial-Displacement
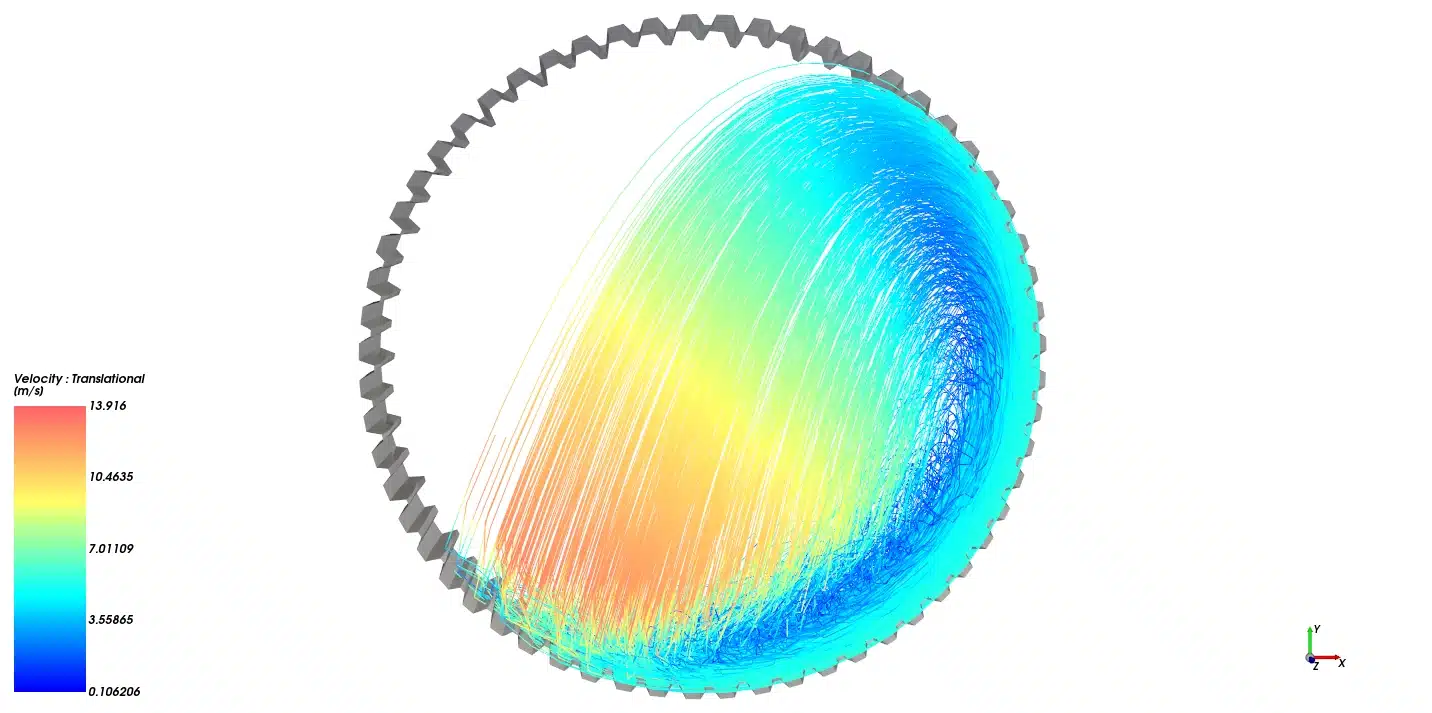
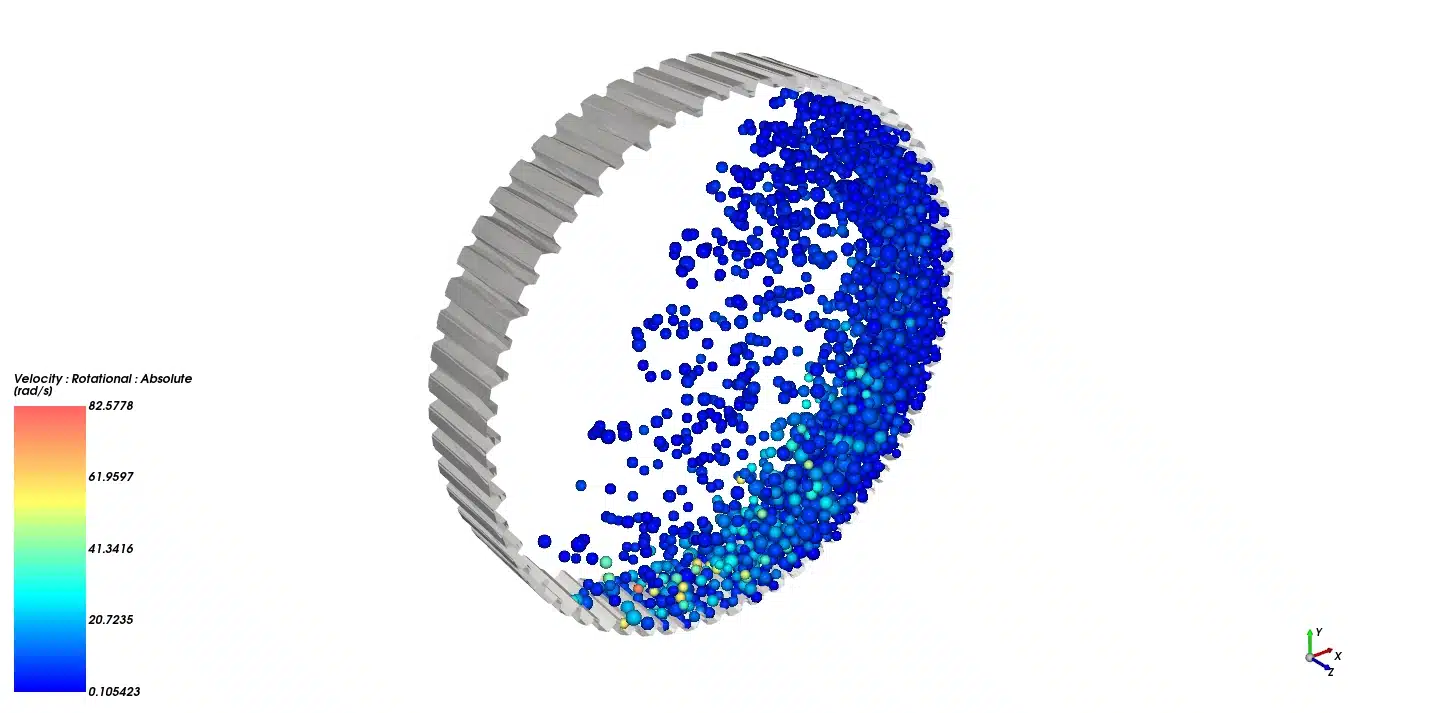
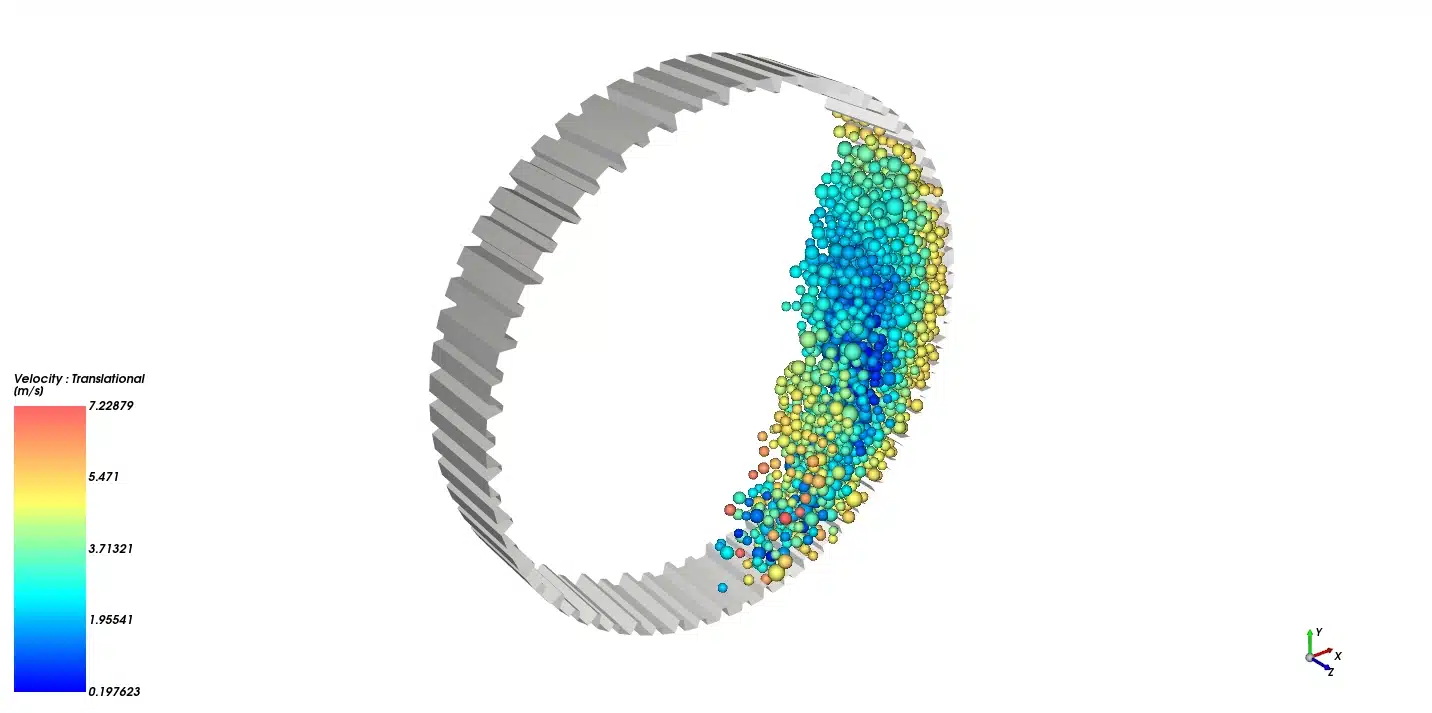
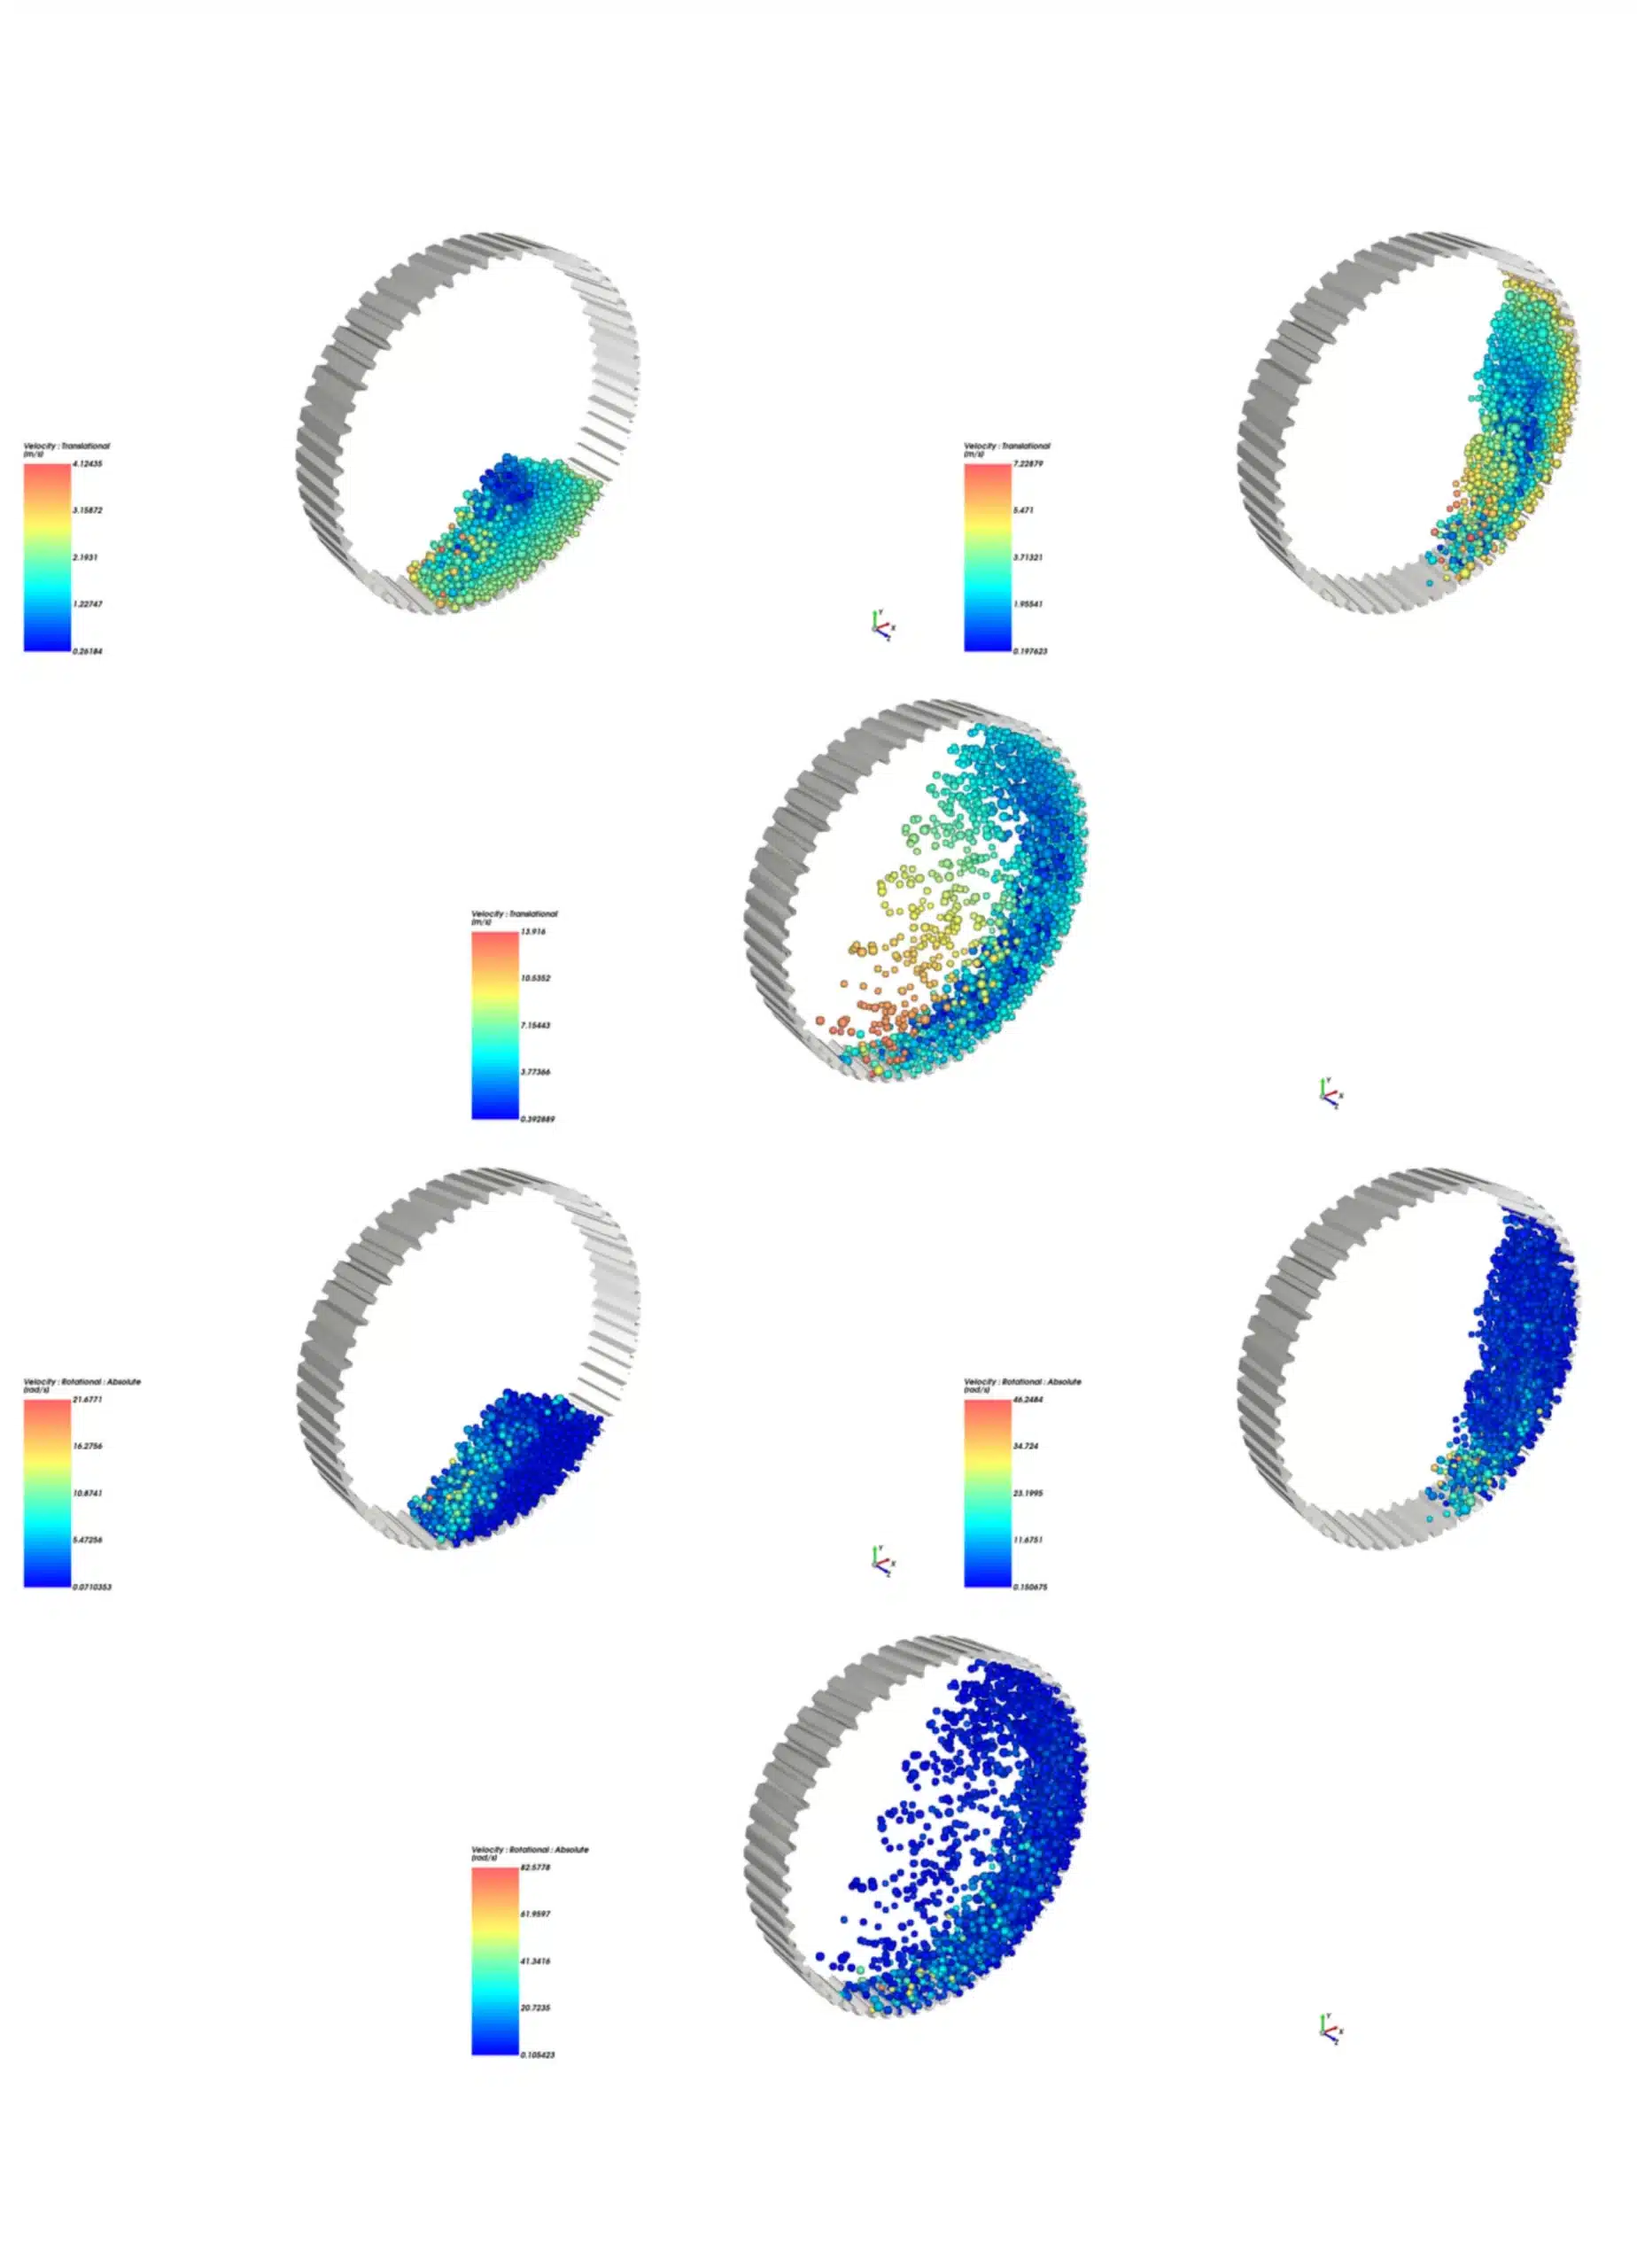
To evaluate the true engineering safety of this heavy machine, we must deeply analyze the visual contours and the mathematical graphs generated by the software. This continuous scientific analysis explains exactly how the moving rocks destroy the metal walls. We begin by examining the aerodynamic-style velocity pathlines and the colored particle distribution. The software reveals a highly complex motion inside the drum. The bottom section of the contours shows large blue and light-blue areas. In these specific zones, the rocks simply roll over each other at a very slow velocity between 0.106 m/s and 3.55 m/s. This gentle rolling causes very little damage. However, the fluid-like physics change completely near the top of the drum. The metal lifters grab the heavy rocks and carry them high into the air. Gravity eventually pulls them down. The pathline contours show bright red and orange lines, proving these falling rocks accelerate to a massive maximum velocity of exactly 13.916 m/s. In mining engineering, this extremely fast falling motion is called cataracting. Cataracting is necessary to break the rocks, but it generates massive kinetic energy that harms the machine.
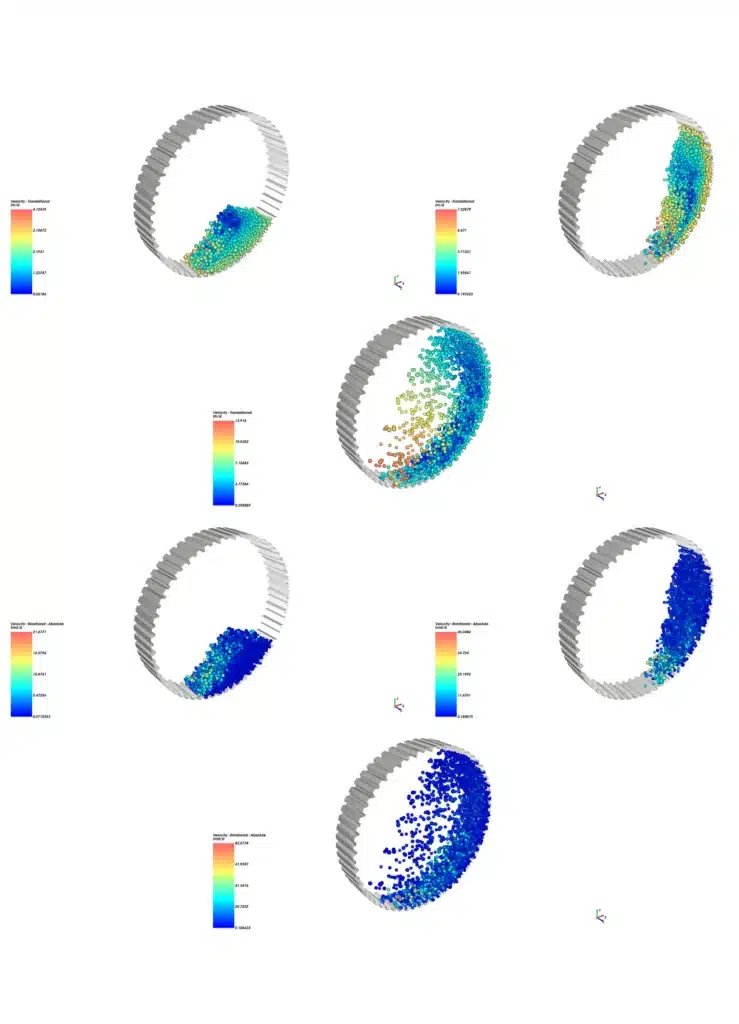
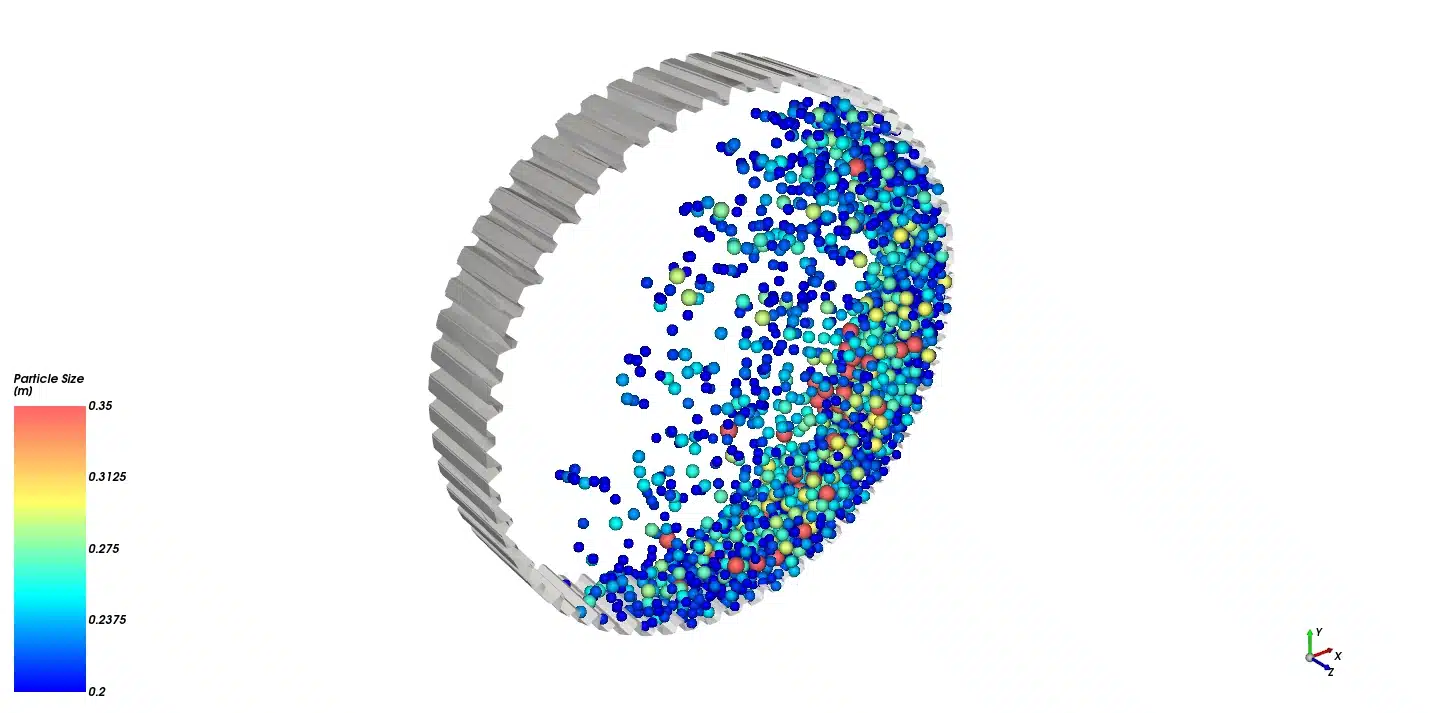
Figure 3: Particle distribution from ROCKY DEM showing 32 ton rock and 8 ton steel charge behavior
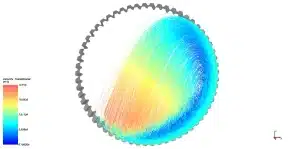
Figure 4: Velocity pathlines tracking the 13.916 m/s fast-falling rocks (red) and the 3.5 m/s slow-rolling rocks (blue).
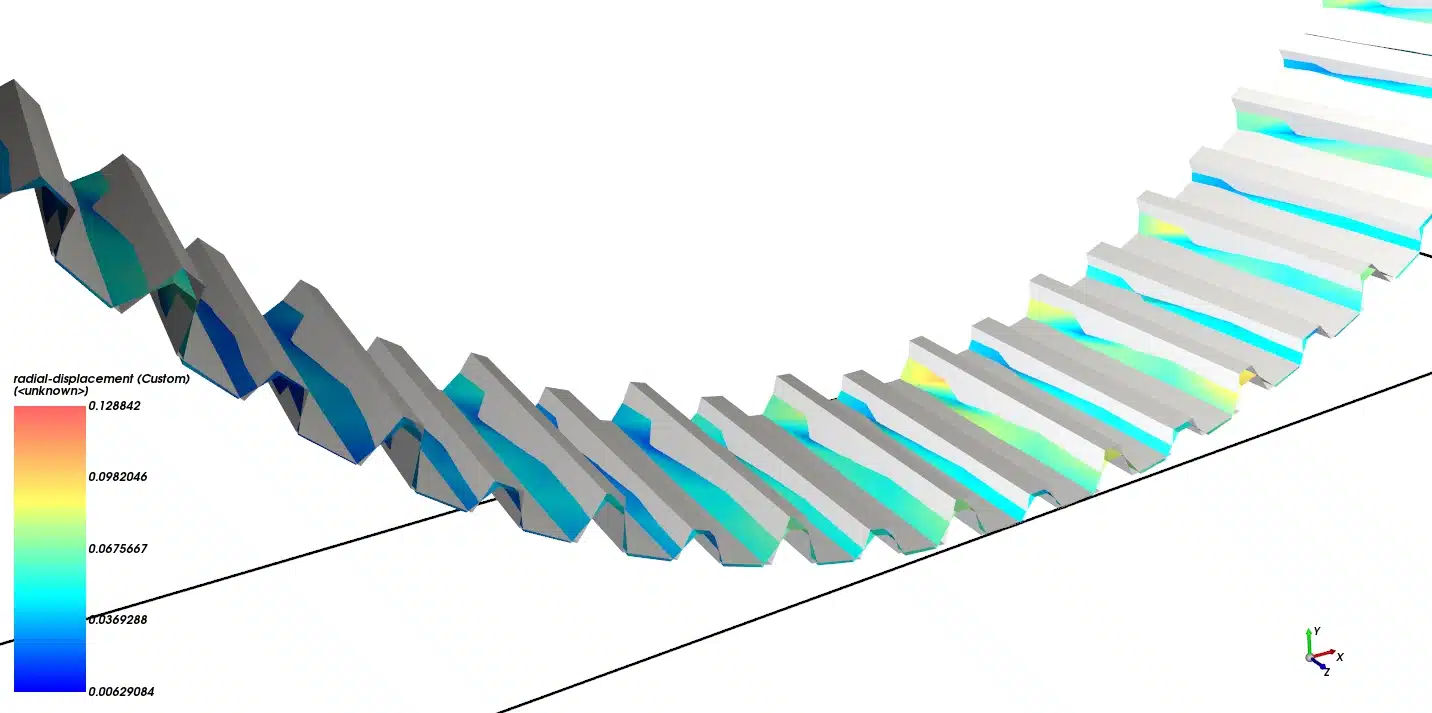
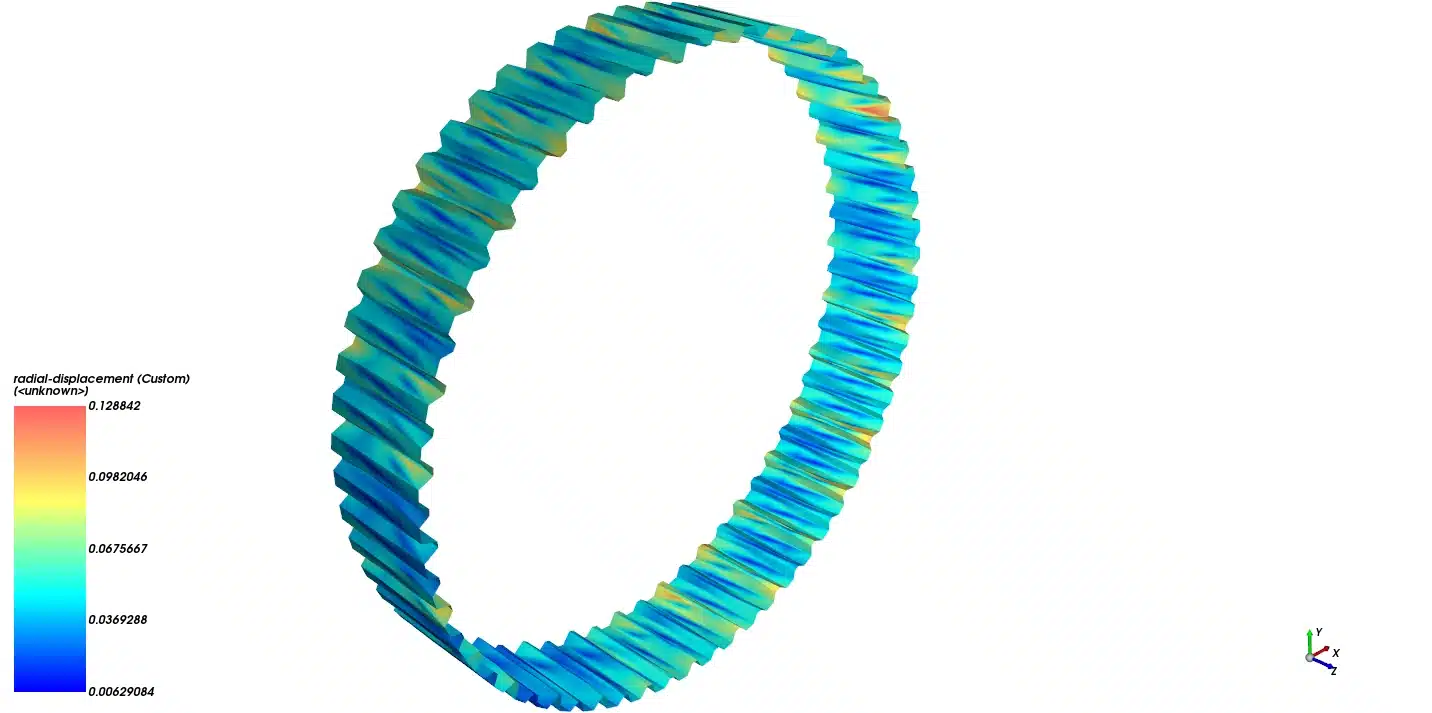
We must instantly connect this 13.916 m/s velocity data to the radial-displacement erosion contours to see the physical consequences. The erosion contour acts as a thermal-style map of metal damage. The flat valleys between the lifters show blue colors, meaning they suffer very low wear ranging from 0.006 m (6 mm) to 0.036 m (36 mm). Because the rocks only roll slowly in these flat areas, the friction is minimal. However, the leading faces of the protruding lifters show terrible, concentrated damage. The contour displays bright red and orange hotspots directly on these specific lifter edges. The software calculates an extreme maximum radial-displacement of exactly 0.128842 meters (128.84 mm). This massive erosion happens because the rocks falling at 13.916 m/s crash directly into these specific protruding metal faces. The kinetic energy from the 8,000 kg of steel balls and 32,000 kg of rock transfers directly into the metal, tearing the steel apart instantly.
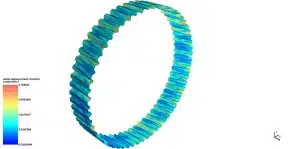
Figure 5: Radial-displacement erosion contour highlighting the extreme 128.84 mm damage hotspots strictly on the leading faces of the lifters.
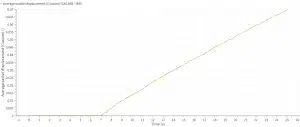
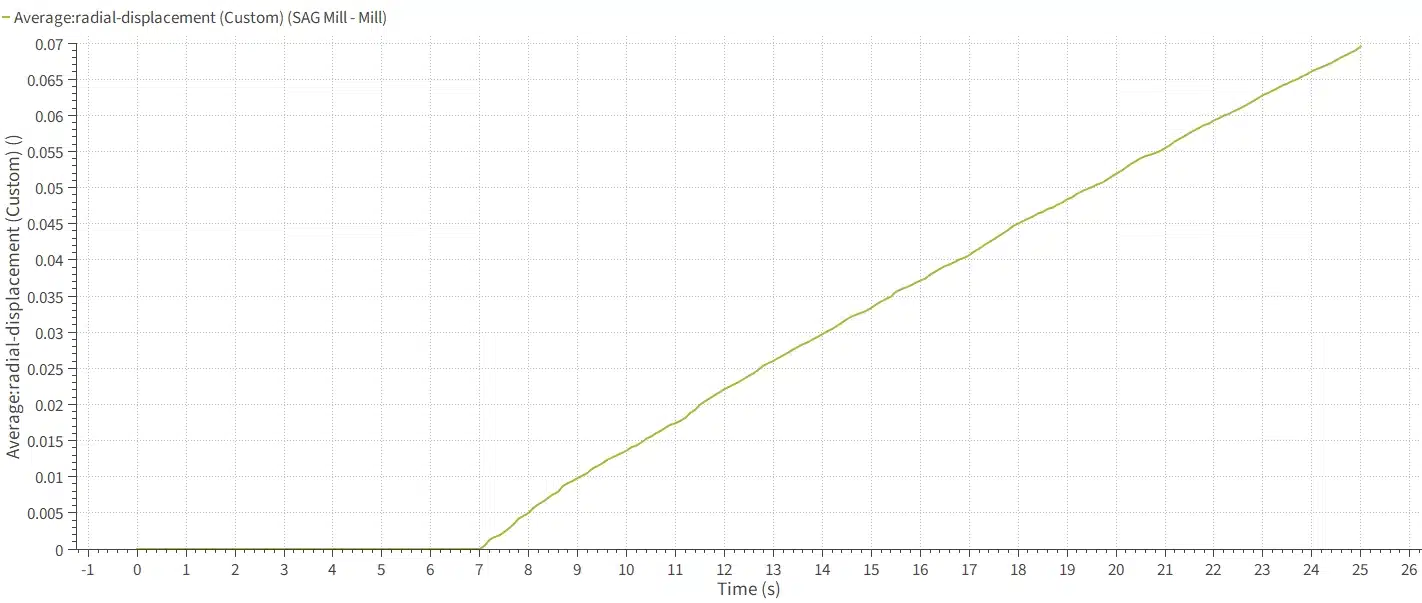
Figure 6: Average radial displacement progression from ROCKY DEM SAG mill erosion simulation, linear increase from 0 to 70 mm over 25 seconds
Finally, we analyze the average radial-displacement graph over the 25-second timeframe. The yellow line on the graph rises perfectly straight, showing that the average wear across the entire interior machine surface reaches exactly 0.07 meters (70 mm). By combining the visual 128.84 mm maximum contour with the 70 mm average graph, we uncover a critical engineering failure. We mathematically prove that the leading edges of the lifters wear down 1.84 times faster than the rest of the machine (128.84 divided by 70). This uneven erosion is terrible for manufacturing. If a factory uses this exact design, the lifters will completely break while the flat walls remain perfectly fine, forcing the factory to throw away the entire expensive drum prematurely. Using this highly accurate SAG Mill Wear simulation data, engineers can easily optimize the internal geometry. They must make the leading faces of the lifters significantly thicker or manufacture them from a much harder steel alloy. This specific geometric optimization will balance the radial-displacement perfectly, ensuring the entire machine wears down evenly and saving the factory millions of dollars in replacement costs.
Frequently Asked Questions (FAQ)
- What is a SAG Mill Wear Analysis?
- A: It is a highly advanced numerical simulation. Engineers use software like Rocky DEM to track exactly how falling rocks scratch and destroy the internal metal walls of a giant crushing machine.
- Why is the wear so high on the lifters?
- A: The lifters stick out from the wall. When rocks fall from the top of the drum at a very fast speed of 13.916 m/s, they crash directly into these protruding metal pieces. This massive kinetic energy causes the extreme 128.84 mm wear.
- What is the difference between CFD Analysis and DEM?
- A: A CFD Analysis or a fluent simulation uses mathematical equations to study moving liquids and gases, like water or air. DEM (Discrete Element Method) uses different equations to study moving solid shapes, like heavy rocks and steel balls.


Reviews
There are no reviews yet.