
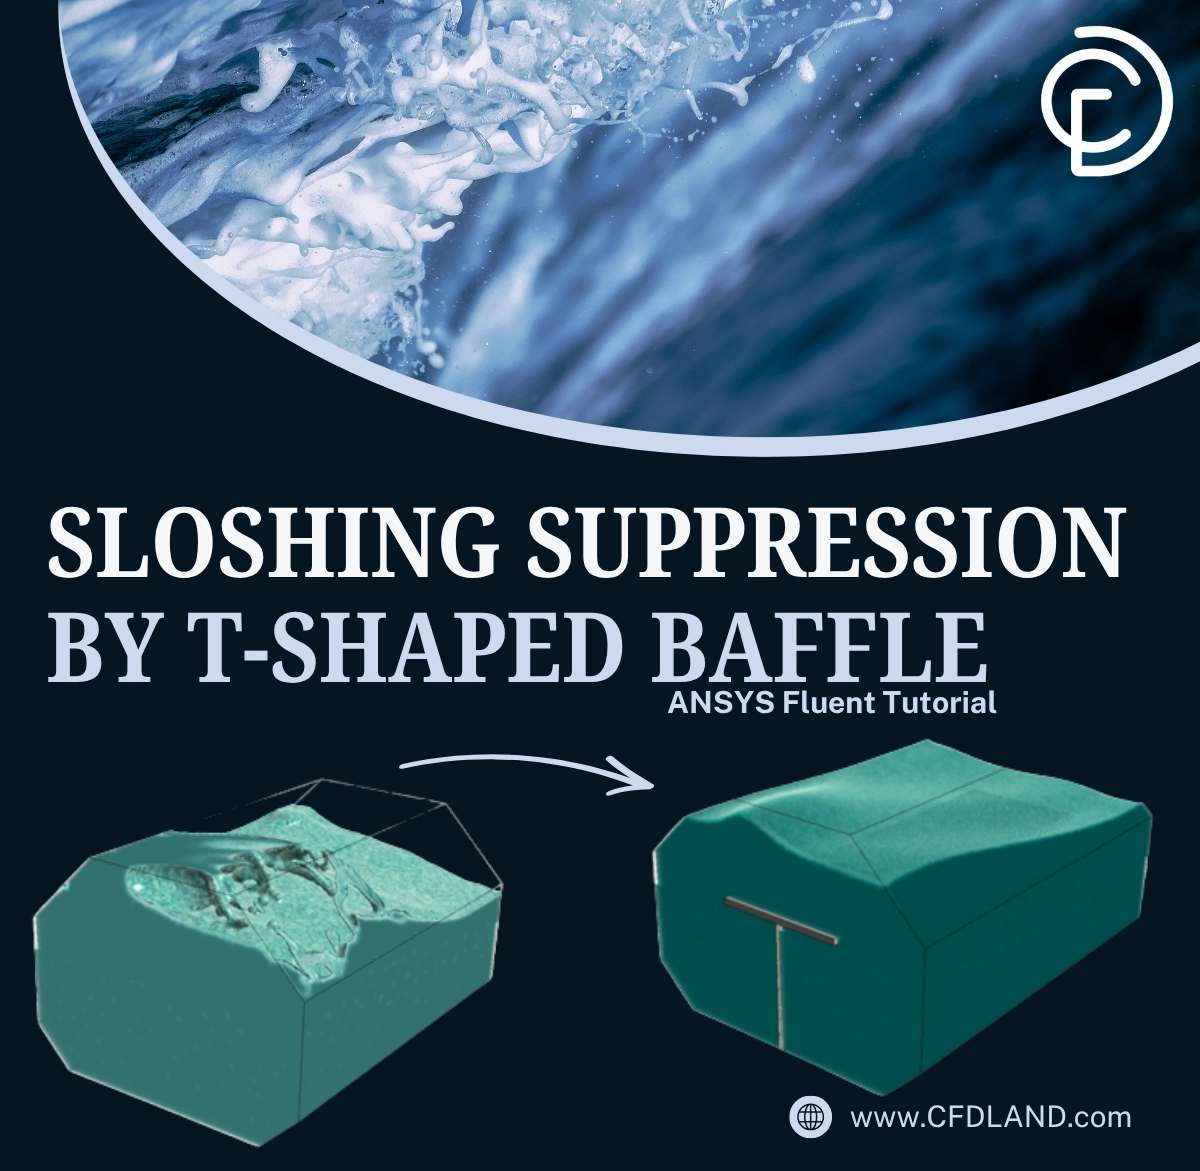


Have you ever wondered how ships carry huge amounts of liquid gas safely across rough seas? When a ship rocks on big ocean waves, the heavy liquid inside its tanks splashes violently. This splashing is called sloshing. It creates massive forces that hit the tank walls. If these forces are too strong, they can break the tank and cause terrible accidents on the water.
To stop this danger, marine engineers use smart metal plates called baffles inside the tanks. In this tutorial, we will study how a special vertical plate stops the waves from growing. If you want to learn how to model these complex moving fluids, exploring our library of multiphase CFD simulation projects is the perfect place to start. Let us explore and see how we can use ANSYS Fluent to solve this important engineering problem.
- Reference [1]: Lu, Zhimei, et al. “Numerical Simulation and Optimization Study of Liquid Sloshing in a LNG Storage Tank.” Journal of Marine Science and Engineering6 (2026): 525.
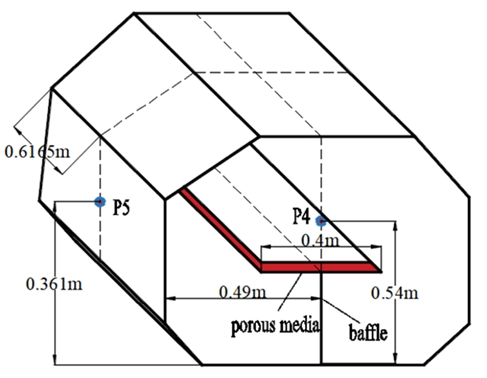
Figure 1: Model 4: baffle with porous media [1].
Simulation Process: Multiphase Flow and Baffle Physics
To set up this ANSYS Fluent simulation, we must choose the right physical modules. We want to compare a tank with no baffle against a tank with a baffle. The baffle erected from a vertical wall and a porous zone with 0.5 porosity. First, we use a high-quality grid to resolve the fluid motion. The grid uses a 595676 polyhedral mesh. These faces help the solver calculate the exact pressure and velocity near the solid walls and the baffle plate.
Second, we must track the liquid and gas phases. We use the Volume of Fluid (VOF) multiphase module. This module calculates the exact boundary where the cold liquid gas meets the empty vapor space.
Third, the tank cannot sit still. It must rock to simulate real ocean waves. We use the Dynamic Mesh module to move the entire tank. To control this rocking motion, we load a User Defined Function (UDF). This UDF uses mathematical formulas to apply a rolling and pitching motion. As the tank rotates, the baffle stands in the middle of the tank to block the sliding liquid.
Figure 2: Schematic design – 3 points to measure pressure – one on top wall , P4 on front wall (14cm above the baffle) – p5 on side wall with 36cm above the bottom tank face
Post-processing: Detailed Wave and Pressure Analysis
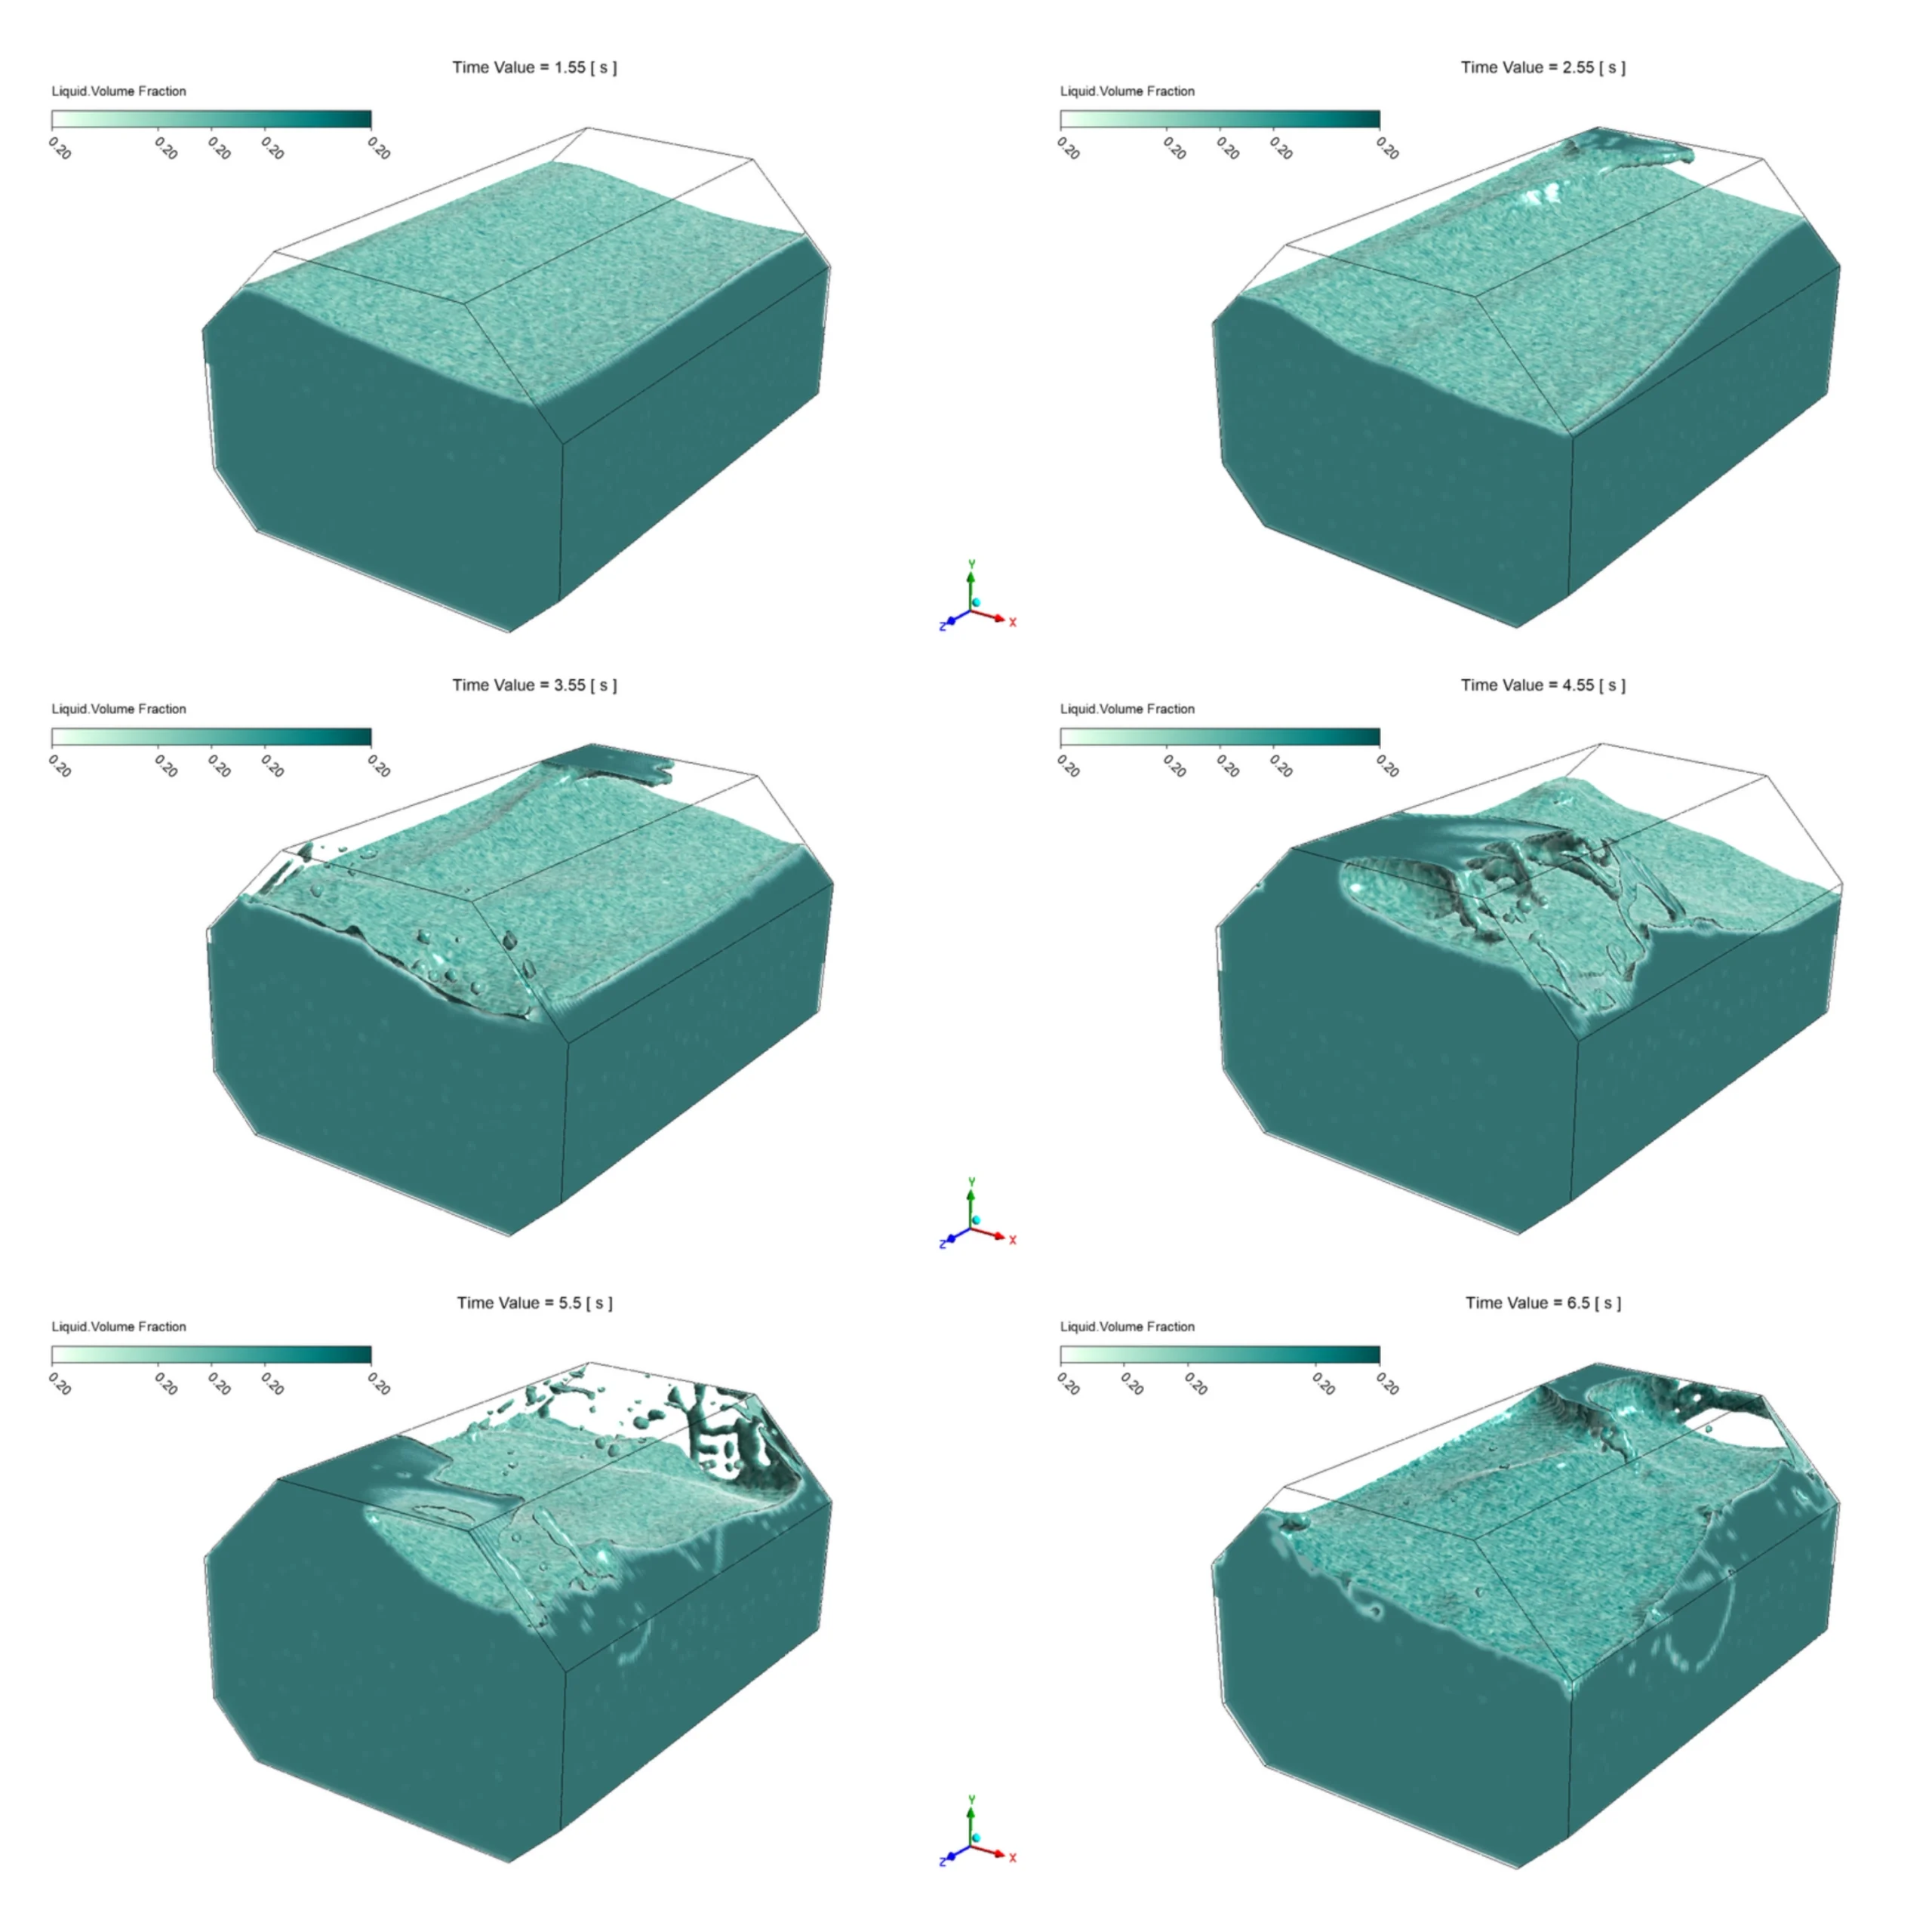
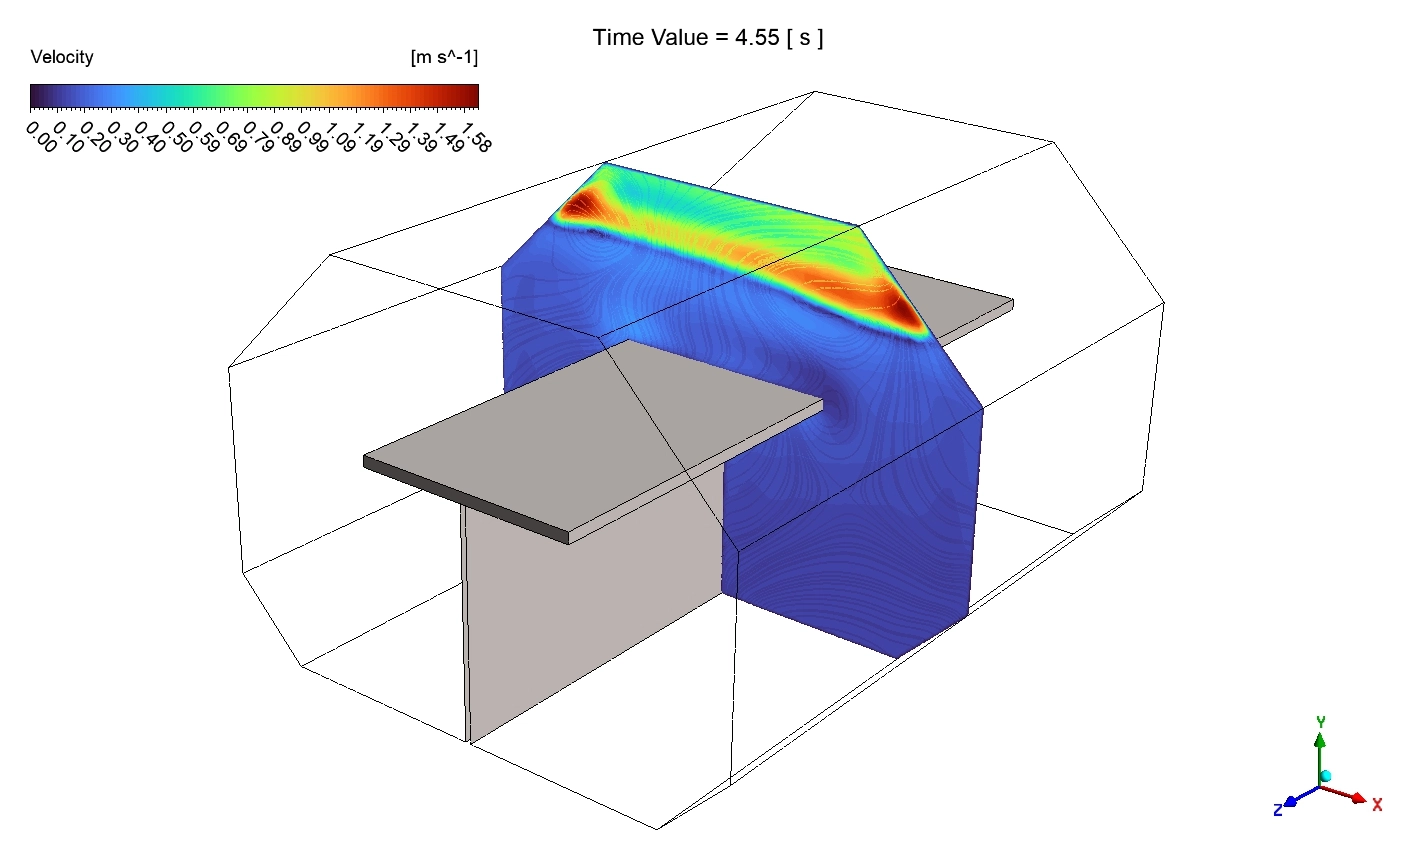
Let us look closely at our visual results to see how the baffle protects the tank. We will compare the wave shapes and the wall forces for both cases. In the unbaffled tank, the liquid moves with no restriction. At exactly 1.55 s, the liquid surface is mostly flat, but it is already starting to tilt. By 2.55 s, the liquid climbs very high up the right wall. It reaches all the way to the top corner. At 3.55 s, the wave rolls back across the tank, creating a steep slope. The most violent event happens at 4.55 s. The wave breaks completely. It crashes directly into the ceiling, creating a large trapped air pocket under the liquid. At 5.5 s, the liquid crashes down on the right side, splashing wildly and breaking into many small drops. Even at 6.5 s, the water is still highly turbulent and hits the top right corner with high speed.
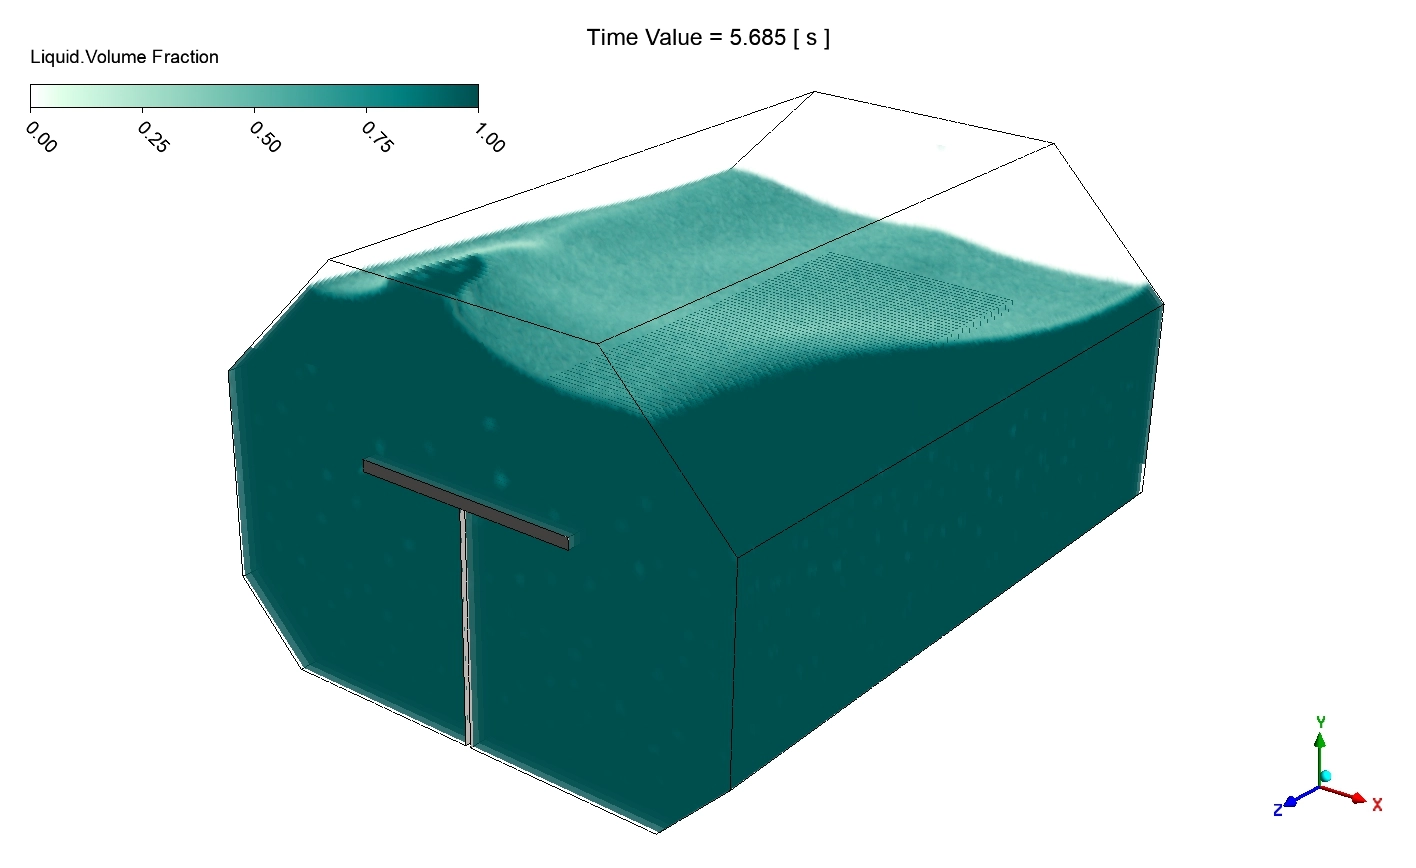
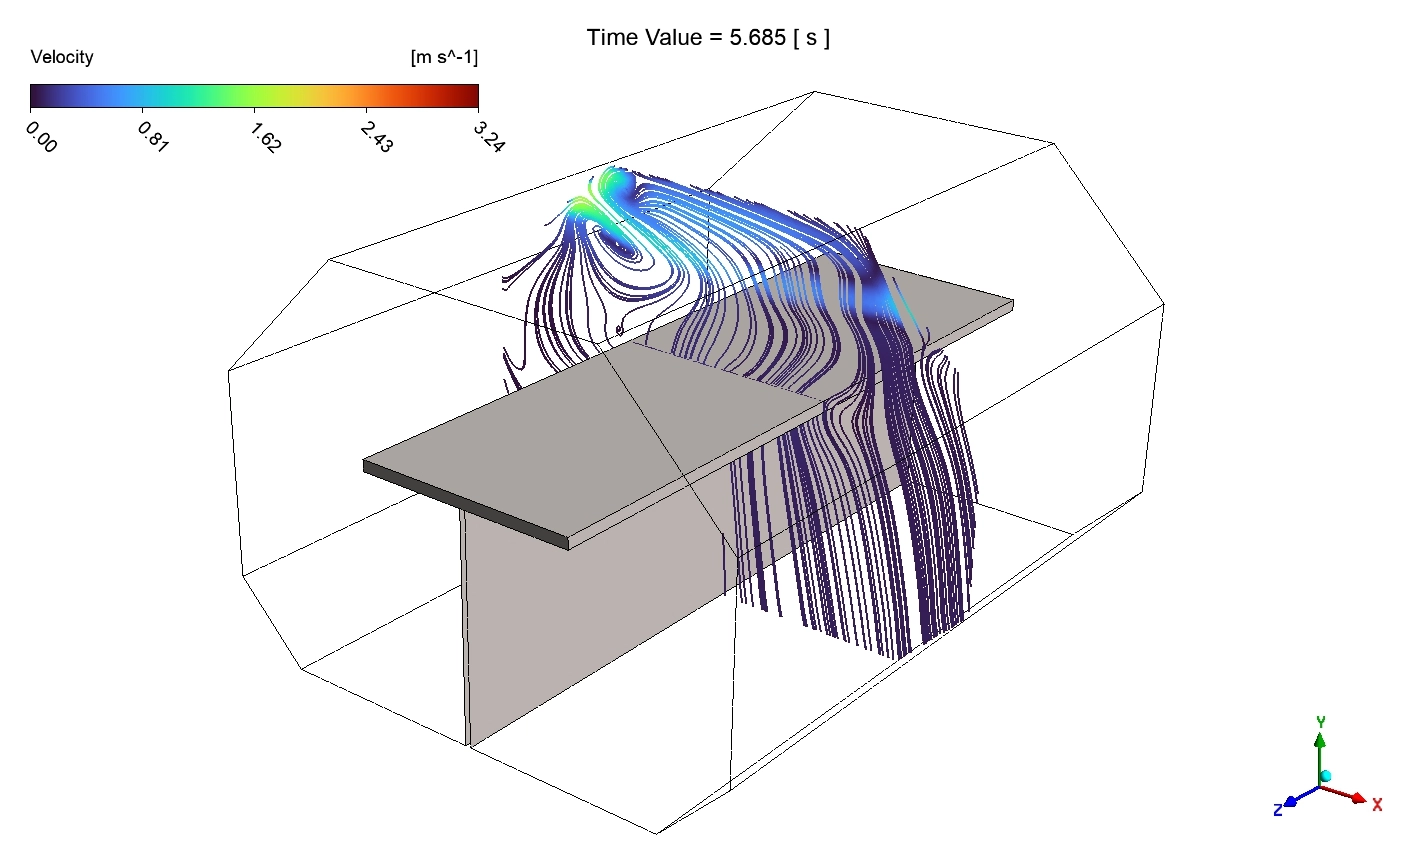
Now, let us look at the tank with the baffle. At exactly 1.5 s, the liquid is perfectly calm. By 2.5 s, the tank tilts, and the liquid starts to slide to the right. However, The horizontal porous top plate slows down the rising wave. The liquid cannot climb to the ceiling. At 3.5 s, the wave is well-contained. The vertical post of the baffle slows down the lateral fluid movement, while the top horizontal porous plate forces the liquid to turn back down. At 4.55 s, the liquid climbs the left side, but the wave remains smooth and stable. It does not break or crash into the ceiling. Even at 5.685 s, the liquid wave climbs the right side smoothly. The vertical baffle–horizontal porous plate configuration completely suppresses violent breaking waves and protects the ceiling from direct liquid impacts.
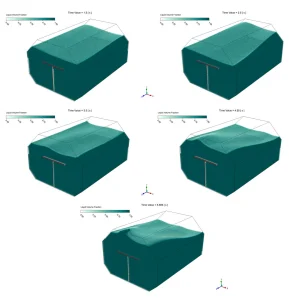
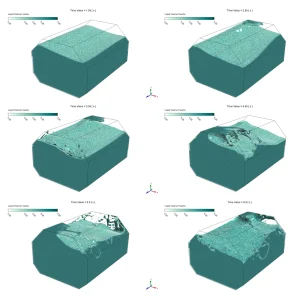
Figure 3: Liquid volume fraction contours in the baffled and unbaffled tank from 1.55 s to 6.5 s, showing violent wave impacts on the ceiling.
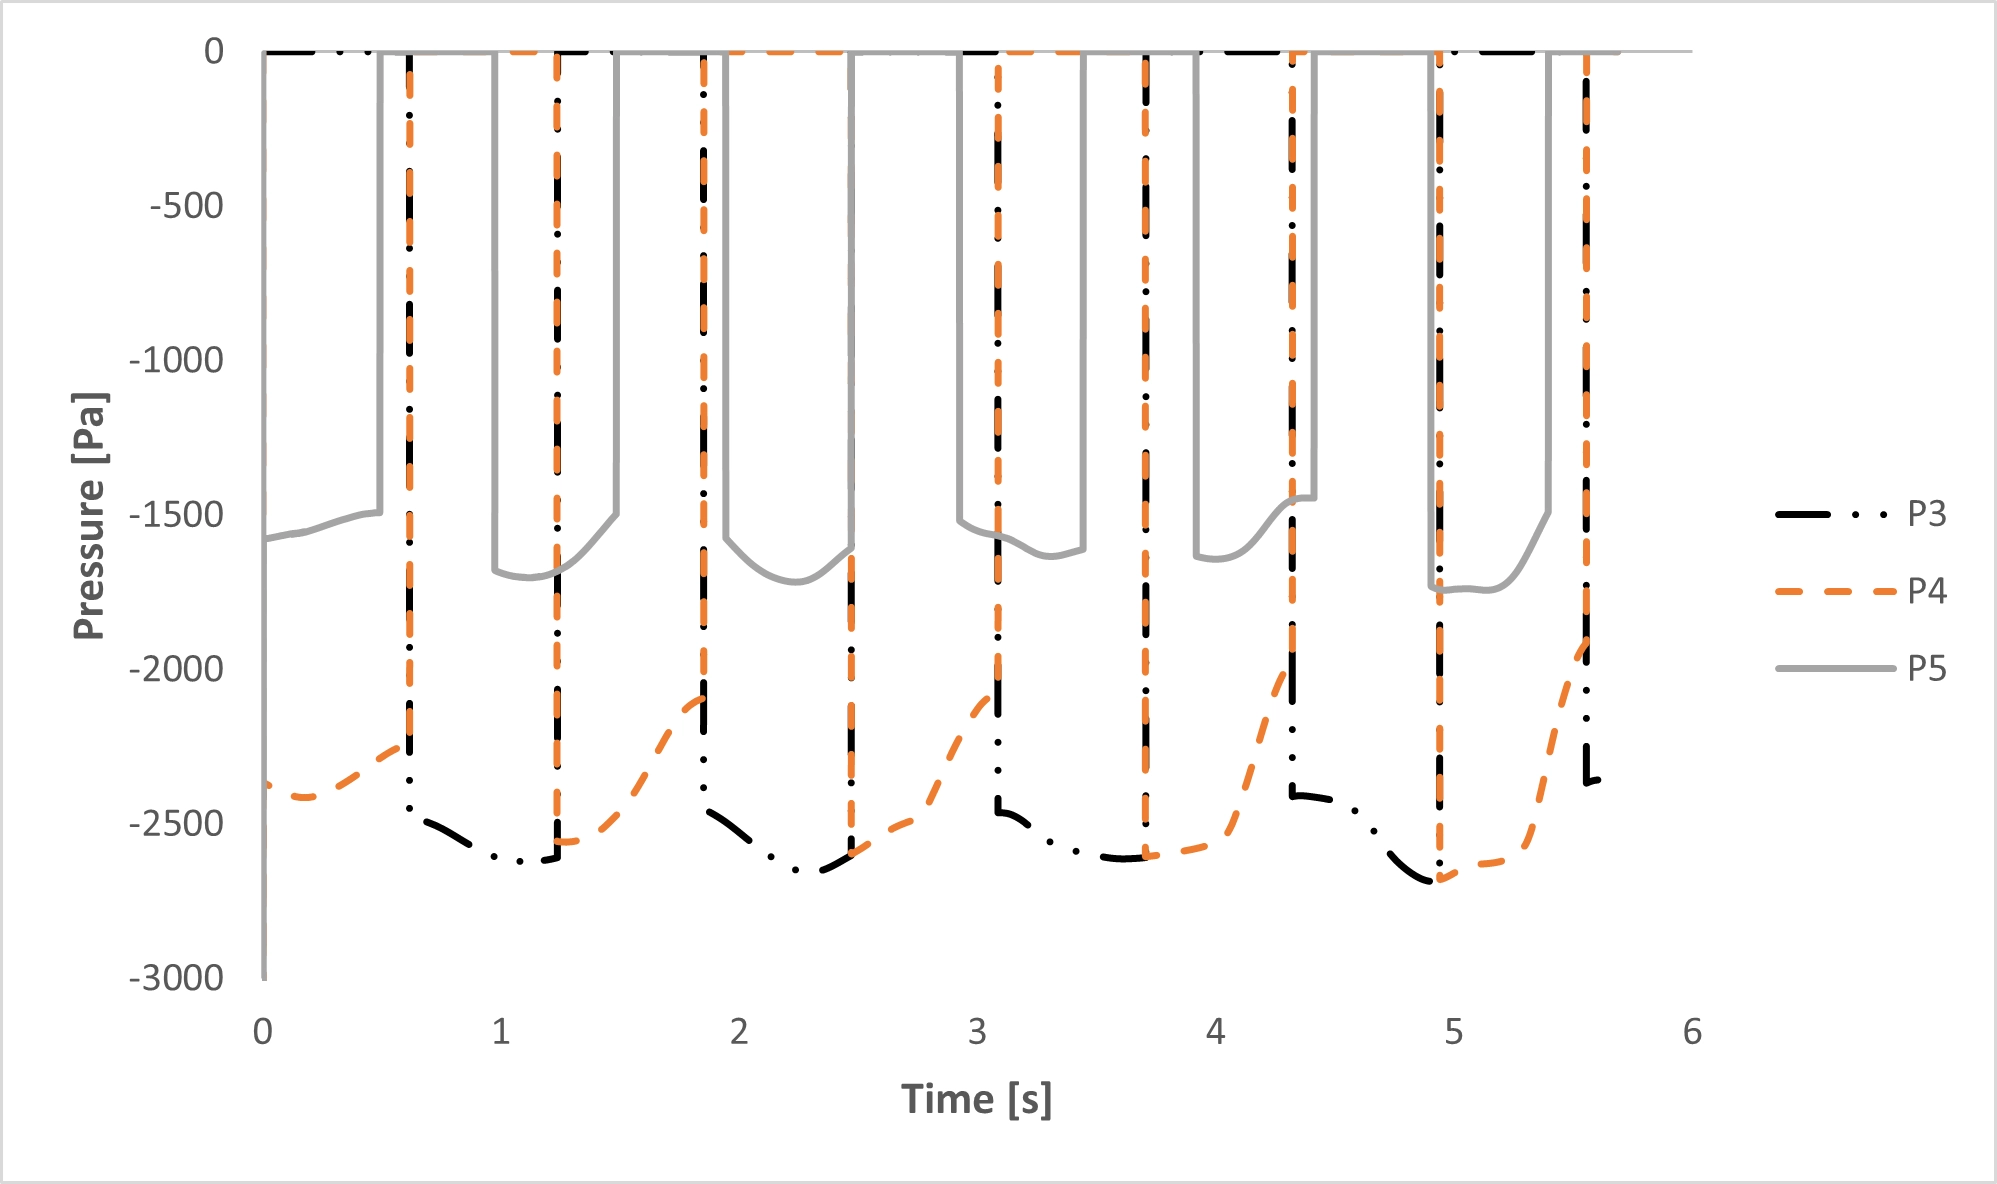
We can see the mathematical proof of this wave control by looking at the transient pressure plot. The graph tracks the pressure at three critical points: P3, P4, and P5.
The sensor P3 is shown by the black dash-dot-dot line. It experiences deep negative pressure values, reaching a maximum suction of about -2680 Pa at exactly 4.9 s. The sensor P4, shown by the orange dashed line, also experiences high suction, dropping to a minimum pressure of about -2650 Pa at 5.0 s. These large negative values represent a strong vacuum force. This happens when the heavy liquid is violently pulled away from the wall. This suction pulls the tank wall inward, which can cause structural fatigue.
The sensor P5 is shown by the solid grey line. It is placed higher on the wall. It stays around -1500 Pa to -1700 Pa. However, we see sharp spikes where the pressure goes directly to 0 Pa at regular intervals, such as at 0.6 s, 1.2 s, 1.8 s, 2.5 s, 3.1 s, 3.7 s, 4.3 s, and 5.0 s. These periodic spikes to 0 Pa happen precisely when the liquid wave sloshes and covers the sensor.
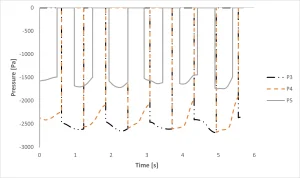
Figure 4: Transient pressure plot at points P3, P4, and P5, showing suction forces reaching -2680 Pa.
By installing the baffle, we reduce these rapid pressure changes. The baffle dampens the liquid movement, which lowers the maximum suction forces and prevents the dangerous pressure spikes that break the tank walls over time.
Frequently Asked Questions (FAQ)
- How does the Dynamic Mesh module help in this simulation?
- The Dynamic Mesh module allows the boundaries of the tank to move over time. This lets us apply a realistic rolling and pitching motion to the tank, which is necessary to create the sloshing waves.
- What do the pressure spikes to 0 Pa mean on the graph?
- The spikes to 0 Pa happen when the splashing liquid covers the pressure sensor. This shows the exact frequency of the waves hitting the wall, which happens about every 0.6 s in this test.


Reviews
There are no reviews yet.