
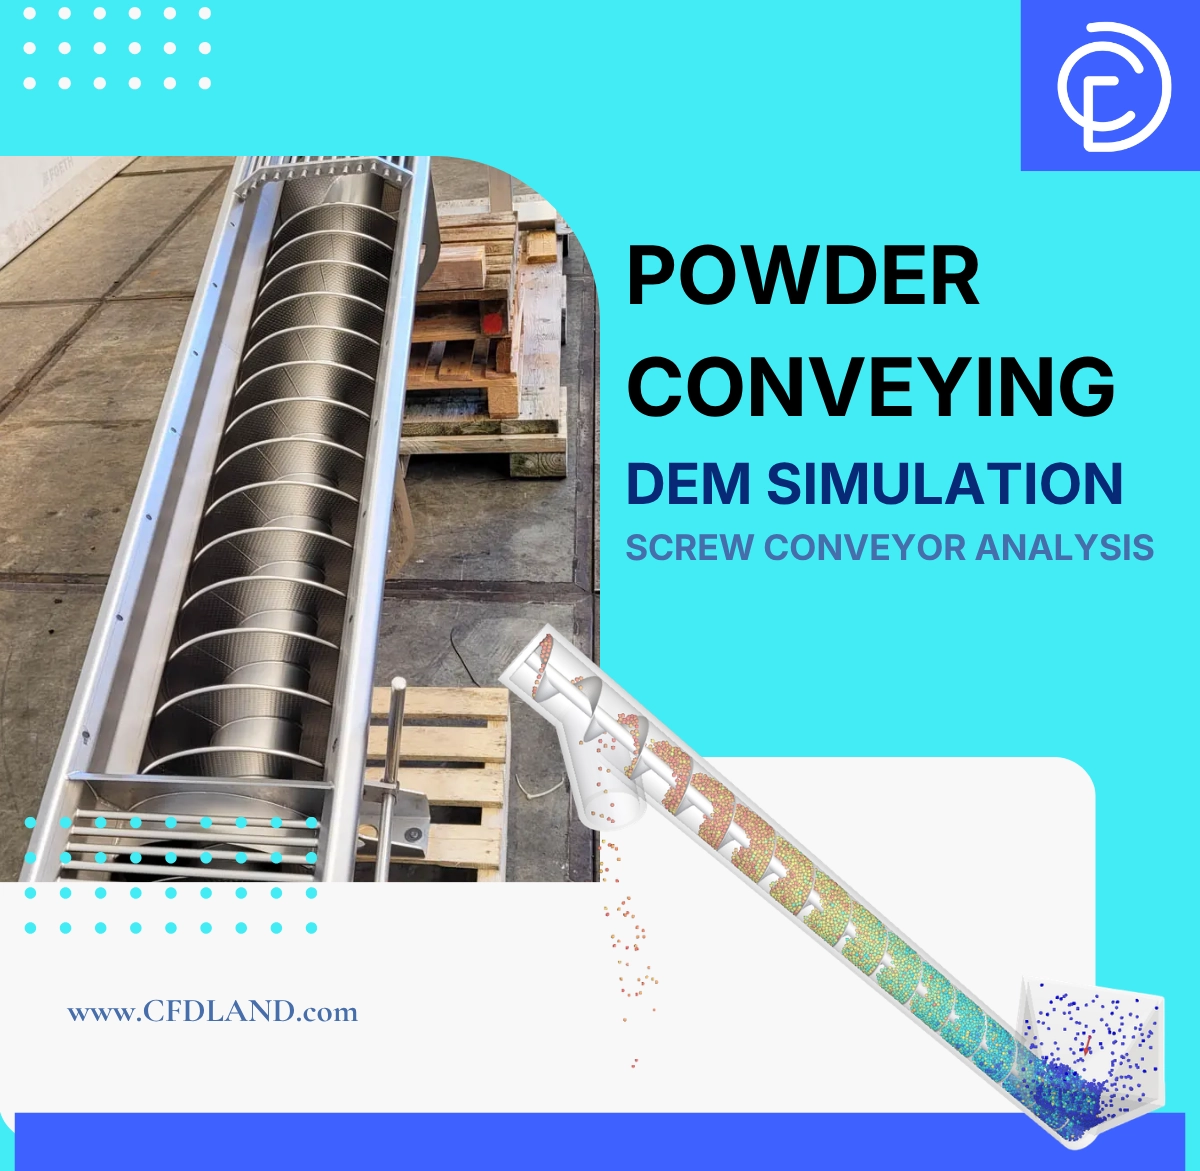
Many large factories use long, twisting metal tubes to move heavy dry materials like sand, cement, or flour. These machines are called screw conveyors. If engineers design these machines poorly, the dry powder will get stuck inside, and the electric motor will waste expensive energy. Therefore, designers perform a highly accurate Powder Conveying DEM Simulation to see exactly how the twisting blades push the small pieces forward. By practicing with this Rocky DEM tutorial project, you can learn how to set the exact rotation speed to make sure the machine never breaks. If you are interested in studying similar rotating machines moving liquid water, please visit our Screw Conveyors CFD Simulation Using Dynamic Mesh project. To learn more about tracking millions of dry solid pieces, we highly recommend exploring our professional DEM engineering tutorials.
- Reference: Motaln, Marko, and Tone Lerher. “Numerical simulation of conveying fine powders in a screw conveyor using the discrete element method.” Tehnički glasnik3 (2023): 338-345.
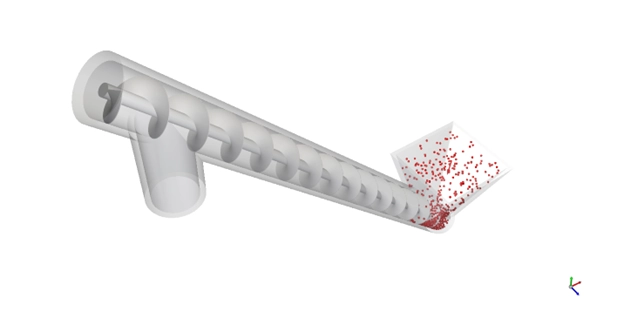
Figure 1: Geometry model & particle injection, showing the 3D metal screw blades and the top opening where the fresh sand enters the system.
Simulation Process: Rocky DEM Setup and Numerical Softening Factor
For this industrial project, we created a complete 3D computational representation of an inclined metal screw conveyor. Inside the Rocky DEM software, we set the central helical blades to rotate heavily at exactly 140 RPM (14.66 rad/s). To simulate a real working factory, we injected thousands of 3 mm sand particles into the top inlet at a steady rate of 0.5 tons per hour.
Because calculating thousands of collisions takes a very long time, we used a smart software tool called the Numerical Softening Factor. This advanced tool makes the sand particles mathematically softer in the simulation. This allows the software to take larger calculation steps while keeping the real bulk physics perfectly correct. Furthermore, we extract all tangential and normal forces based on valid references to calculate the exact rubbing friction between the sand and the metal pipe over the complete 10.5-second test.
Post-processing: Analysis of Powder Mass Flow and Residence Time
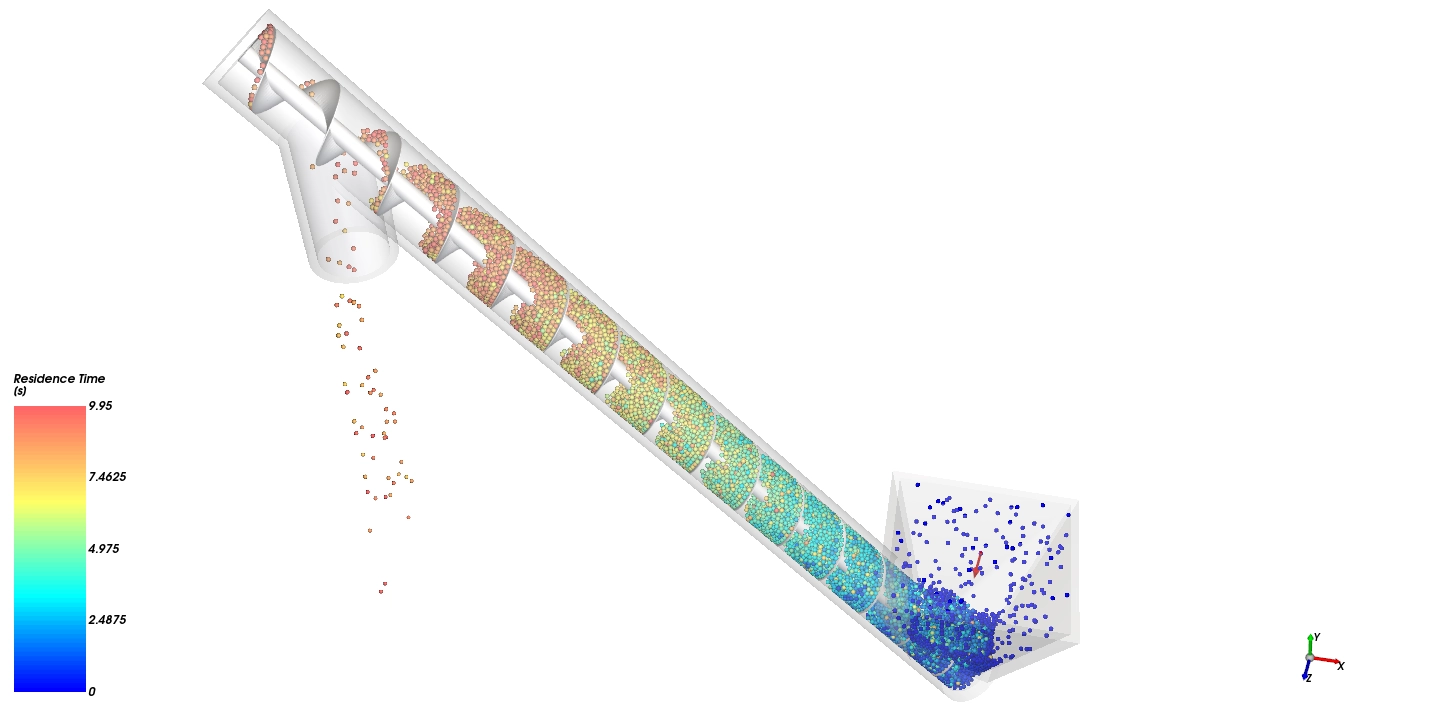
Let us carefully analyze the exact simulation contours and mass flow graphs to truly understand the machine performance. We ran this simulation for a total time of 10.5 seconds. When we evaluate the Residence Time contours, we see that the fresh blue sand enters the tube, but it takes roughly 9 to 10 seconds for the first particles to travel the full length and reach the top-level outlet. The red color perfectly highlights these leading particles that finally reach the 9.95-second mark at the exit.
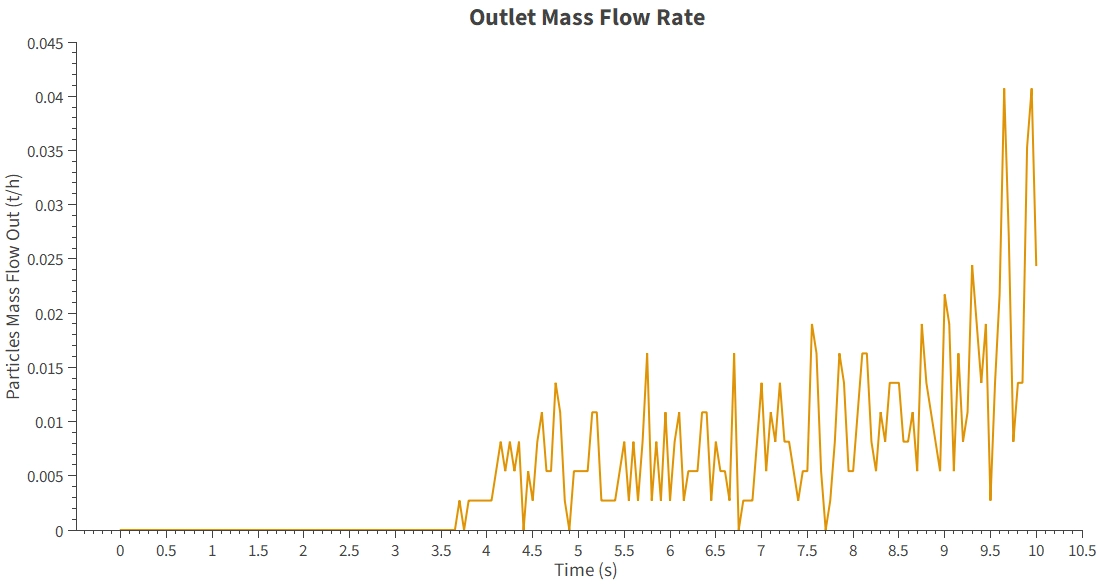
This specific timing is highly critical for engineering analysis. Because it takes 10 seconds just for the particles to reach the end, this 10.5-second test represents only the starting transient phase. The low outlet mass flow rate of 0.005 to 0.041 t/h simply proves that the pipe is still filling up. Therefore, to evaluate the true capacity of the machine, engineers must continue running the simulation much longer. The solver must run until the conveyor is completely full and the particles reach a steady work condition where the output perfectly matches the 0.5 t/h input feed.
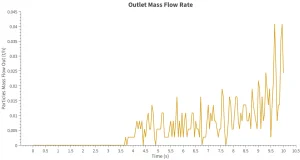
Figure 2: Outlet Mass Flow Rate from Rocky DEM (0-0.045 t/h over 10.5 s), displaying the highly unsteady particle discharge jumping up and down as the screw turns.

Figure 3: Residence Time contours (0 to 9.95 s), illustrating exactly how long the sand stays inside the tube from fresh blue to trapped red.


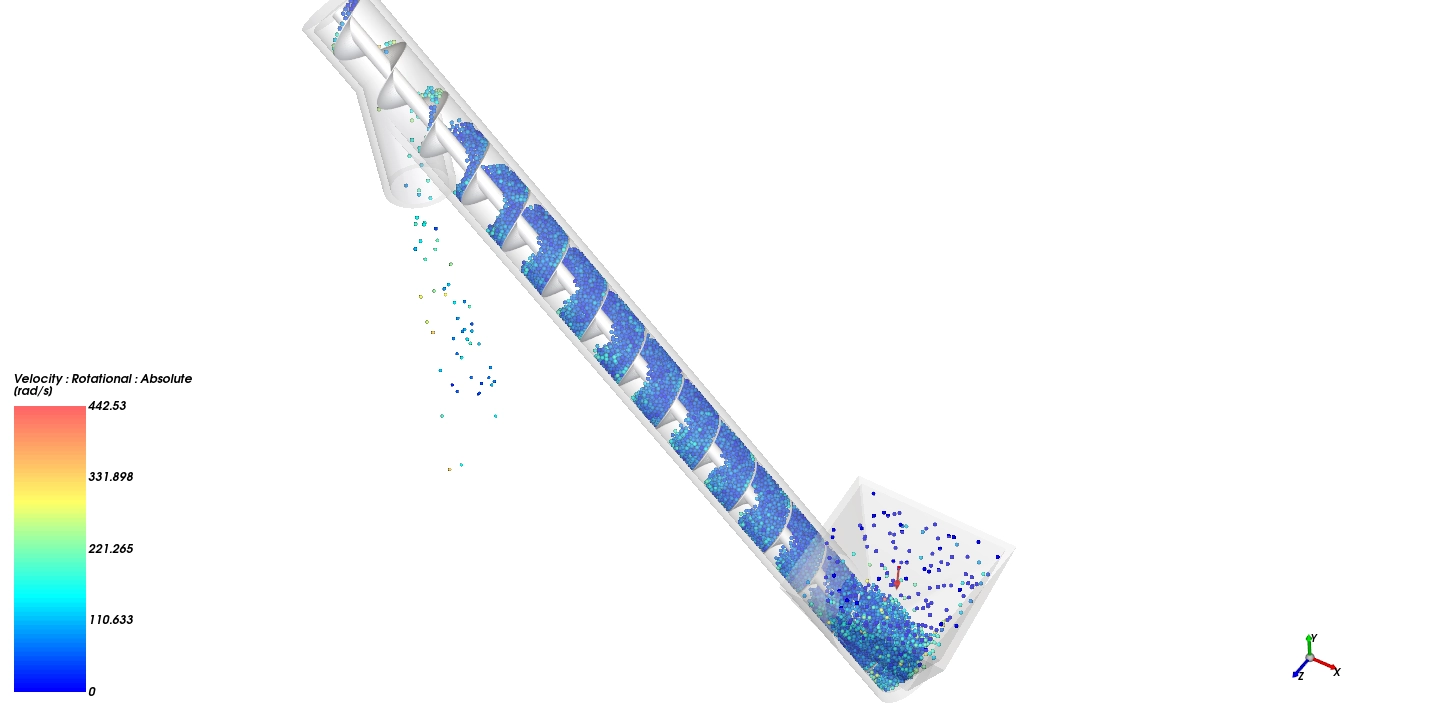
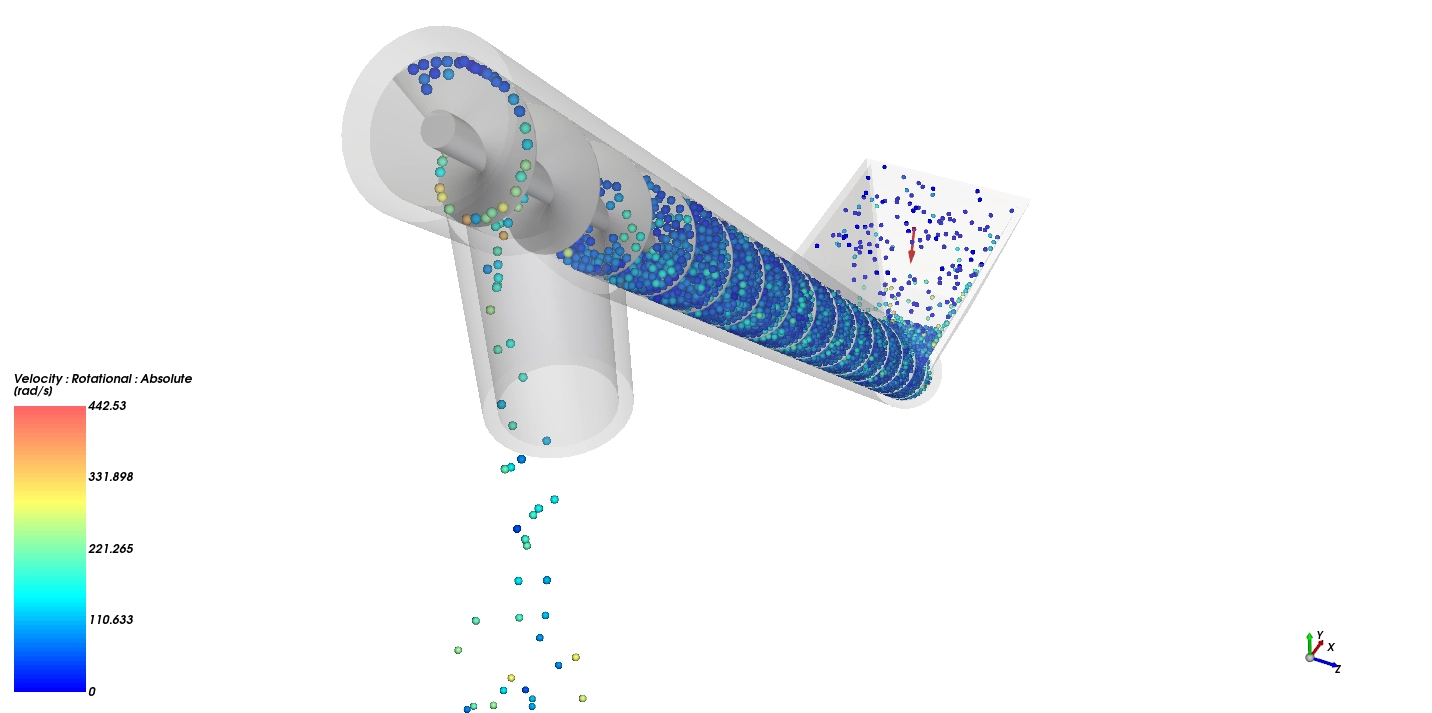
Figure 4: Velocity Rotational Absolute contours (0 to 442.53 rad/s), visualizing the extreme spinning speed of individual sand grains rubbing against the blades.
Finally, we study the Velocity Rotational Absolute contours to see how the sand mixes inside the tube. The visual colors clearly show that gravity pulls the heavy sand down to the bottom floor. Because the sand falls to the bottom, the upper half of the tube remains empty, which results in a low filling ratio of only 5% to 25%. While the majority of the sand tumbles slowly at 0 to 110 rad/s (blue color), a small amount of sand rubs violently against the fast metal blade tips. These specific particles spin at an extreme maximum speed of 332 to 442 rad/s (red color). This exact data proves that the sand does not move as one solid block. Instead, it continuously slips, rolls, and tumbles backward due to gravity. By understanding these exact particle mechanics, designers can change the blade angle to push the powder more smoothly.
Frequently Asked Questions (FAQ)
- Why is the outlet mass flow very low compared to the 0.5 t/h inlet feed?
- The mass flow is low because the simulation is only 10.5 seconds long. It takes roughly 9 to 10 seconds just for the very first sand pieces to travel up the pipe. To see the true output, engineers must run the simulation much longer until the flow reaches a steady work condition.
- What is the Numerical Softening Factor in Rocky DEM?
- It is a smart mathematical tool that makes hard particles act slightly softer in the calculations. This allows the software to calculate the simulation much faster without losing physical accuracy, which saves companies a lot of computer time.


Reviews
There are no reviews yet.